




#夏日创作营
Today’s Bitcoin Market Analysis
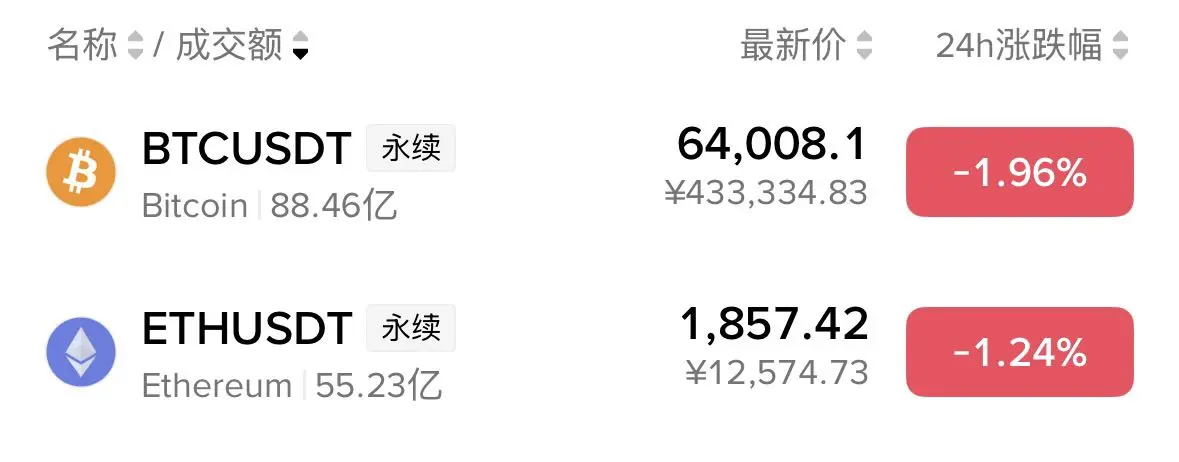
Bitcoin is currently trading at about $65,900, down slightly by around 0.3% over the past 24 hours, and up about 2.35% over the week. This month’s trend follows a “fall first, then rebound” pattern: in early July, it touched an approximately 21-month low near $57,950, then rebounded about 15% from the lows. It is now trading near the monthly high around $66,000. BTC fell about 20% cumulatively in June; July has recovered some of the losses, but it remains far below the highs from the beginning of the year.
The key catalyst behind the rebound over the past few days is that U.S. spot BTC ETFs have recorded net inflows for 5 consecutive days, totaling about $727 million—its longest positive streak since late April. At the same time, Treasury Secretary Bessent said the crypto regulatory Clarity Act is at the “final mile,” and the market is optimistic about the legislative outlook. BTC briefly surged to around $66,840. However, a Kitco analyst noted that part of the current rebound is driven by short-seller covering (with roughly $182.5M in short liquidations over 24 hours), rather than large-scale new capital entering the market—so investors still need to view Bitcoin Foundation CoinDesk Kitco’s situation with caution.
1. Technical Indicators
Moving Averages: Daily EMA50 is about $65,738, and EMA200 is about $76,019. The current price has just returned near EMA50, but it is still about 15% away from the EMA200. Structurally, this is still the rebound phase within a broader medium-term downtrend; the moving averages have not yet shown clear bullish alignment signals.
MACD: The daily MACD line remains in negative territory (about -1,045), but the histogram has flipped positive (about +656), indicating that short-term momentum is being repaired. The 4-hour MACD has generated a bearish crossover signal, conflicting with the daily trend—there is short-term downside pullback pressure, but medium-term rebound momentum still remains.
RSI: The daily RSI has entered overbought territory (Kitco clearly labeled it “overbought”), and the 4-hour level is also relatively high. Being overbought does not necessarily mean a drop immediately, but it does suggest that the risk of chasing longs in the short term is increasing—so investors should watch for a pullback or consolidation to digest the move.
Trading Volume: 24-hour trading volume is about $25.13B, but the 30-day average volume is only 62% of the yearly average. Daily spot volume is about $2.3B, so overall market participation is still relatively low. For the rebound to sustain, trading volume needs to expand further to confirm. CoinStats.
2. Key Support and Resistance Levels
Support levels:
$65,000–$65,500: The starting point of the rebound in recent days, and the position ETF analysts consider “must-hold.” If this level breaks, the rebound’s foundation would become unstable.
$60,600–$61,000: The late-June closing area and the early-July rebound starting point—deeper support.
$57,950: The July low. A break below it would confirm the continuation of the downtrend.
Resistance levels:
$66,445: A short-term resistance step that was broken on Tuesday and held.
$67,500–$68,000: The next key resistance zone. If $68,000 is broken, trader Ted Pillows expects a potential quick rally of 5–6% toward the $71,000–$72,000 area.
$70,000: The Q1 range high; a medium-term target level.
3. Outlook for This Week
BTC is in a delicate phase of “rebound momentum still exists, but indicators are already overheated.” ETF inflows and regulatory tailwinds are positive catalysts, but the overbought RSI, the 4-hour MACD bearish crossover, and relatively low trading volume all serve as reminders: this is not a place where investors can comfortably chase longs.
Scenario 1 (probability about 40%): After choppy consolidation, prices continue higher. If BTC can trade sideways between $65,000–$66,500 to digest the overbought indicators for 2–3 days, and then breaks out above $67,500–$68,000 with increased volume, it could move toward $70,000. Trigger conditions: continued net positive ETF inflows and meaningful progress on the Clarity Act.
Scenario 2 (probability about 35%): A short-term pullback to $64,000–$65,000. The overbought indicators naturally correct; the 4-hour bearish signals play out. BTC then revisits the EMA50 area to find support and stabilizes. This kind of pullback is actually a healthier pattern and helps build momentum for the next leg up.
Scenario 3 (probability about 25%): The rebound fails and BTC breaks back below $60,000. ETF inflows turn into outflows, and macro headwinds intensify (with AI funds continuing to divert and risks of a downturn in the credit cycle increasing). BTC then retests the July lows. Kitco analysts mentioned that some macro signals (S&P futures bearish-market consolidation, and a divergence in the dollar’s double-bear positioning) still lean defensive.
4. Trading Recommendations:
Holders: Set some take-profit orders above $66,000. There is no need to rush to fully exit, but you should keep room for a pullback buffer.
Those currently in cash: It is not recommended to chase longs at the current overbought level. Wait for a pullback into the $64,000–$65,000 range before considering building positions in batches.
Short-term traders: In the $65,000–$68,000 range, sell high and buy low, and strictly set stop-loss orders.
Closely monitor daily ETF inflow data and the legislative progress of the Clarity Act—these two variables will determine whether the rebound can continue.
Today’s Bitcoin Market Analysis
Bitcoin is currently trading at about $65,900, down slightly by around 0.3% over the past 24 hours, and up about 2.35% over the week. This month’s trend follows a “fall first, then rebound” pattern: in early July, it touched an approximately 21-month low near $57,950, then rebounded about 15% from the lows. It is now trading near the monthly high around $66,000. BTC fell about 20% cumulatively in June; July has recovered some of the losses, but it remains far below the highs from the beginning of the year.
The key catalyst behind the rebound over the past few days is that U.S. spot BTC ETFs have recorded net inflows for 5 consecutive days, totaling about $727 million—its longest positive streak since late April. At the same time, Treasury Secretary Bessent said the crypto regulatory Clarity Act is at the “final mile,” and the market is optimistic about the legislative outlook. BTC briefly surged to around $66,840. However, a Kitco analyst noted that part of the current rebound is driven by short-seller covering (with roughly $182.5M in short liquidations over 24 hours), rather than large-scale new capital entering the market—so investors still need to view Bitcoin Foundation CoinDesk Kitco’s situation with caution.
1. Technical Indicators
Moving Averages: Daily EMA50 is about $65,738, and EMA200 is about $76,019. The current price has just returned near EMA50, but it is still about 15% away from the EMA200. Structurally, this is still the rebound phase within a broader medium-term downtrend; the moving averages have not yet shown clear bullish alignment signals.
MACD: The daily MACD line remains in negative territory (about -1,045), but the histogram has flipped positive (about +656), indicating that short-term momentum is being repaired. The 4-hour MACD has generated a bearish crossover signal, conflicting with the daily trend—there is short-term downside pullback pressure, but medium-term rebound momentum still remains.
RSI: The daily RSI has entered overbought territory (Kitco clearly labeled it “overbought”), and the 4-hour level is also relatively high. Being overbought does not necessarily mean a drop immediately, but it does suggest that the risk of chasing longs in the short term is increasing—so investors should watch for a pullback or consolidation to digest the move.
Trading Volume: 24-hour trading volume is about $25.13B, but the 30-day average volume is only 62% of the yearly average. Daily spot volume is about $2.3B, so overall market participation is still relatively low. For the rebound to sustain, trading volume needs to expand further to confirm. CoinStats.
2. Key Support and Resistance Levels
Support levels:
$65,000–$65,500: The starting point of the rebound in recent days, and the position ETF analysts consider “must-hold.” If this level breaks, the rebound’s foundation would become unstable.
$60,600–$61,000: The late-June closing area and the early-July rebound starting point—deeper support.
$57,950: The July low. A break below it would confirm the continuation of the downtrend.
Resistance levels:
$66,445: A short-term resistance step that was broken on Tuesday and held.
$67,500–$68,000: The next key resistance zone. If $68,000 is broken, trader Ted Pillows expects a potential quick rally of 5–6% toward the $71,000–$72,000 area.
$70,000: The Q1 range high; a medium-term target level.
3. Outlook for This Week
BTC is in a delicate phase of “rebound momentum still exists, but indicators are already overheated.” ETF inflows and regulatory tailwinds are positive catalysts, but the overbought RSI, the 4-hour MACD bearish crossover, and relatively low trading volume all serve as reminders: this is not a place where investors can comfortably chase longs.
Scenario 1 (probability about 40%): After choppy consolidation, prices continue higher. If BTC can trade sideways between $65,000–$66,500 to digest the overbought indicators for 2–3 days, and then breaks out above $67,500–$68,000 with increased volume, it could move toward $70,000. Trigger conditions: continued net positive ETF inflows and meaningful progress on the Clarity Act.
Scenario 2 (probability about 35%): A short-term pullback to $64,000–$65,000. The overbought indicators naturally correct; the 4-hour bearish signals play out. BTC then revisits the EMA50 area to find support and stabilizes. This kind of pullback is actually a healthier pattern and helps build momentum for the next leg up.
Scenario 3 (probability about 25%): The rebound fails and BTC breaks back below $60,000. ETF inflows turn into outflows, and macro headwinds intensify (with AI funds continuing to divert and risks of a downturn in the credit cycle increasing). BTC then retests the July lows. Kitco analysts mentioned that some macro signals (S&P futures bearish-market consolidation, and a divergence in the dollar’s double-bear positioning) still lean defensive.
4. Trading Recommendations:
Holders: Set some take-profit orders above $66,000. There is no need to rush to fully exit, but you should keep room for a pullback buffer.
Those currently in cash: It is not recommended to chase longs at the current overbought level. Wait for a pullback into the $64,000–$65,000 range before considering building positions in batches.
Short-term traders: In the $65,000–$68,000 range, sell high and buy low, and strictly set stop-loss orders.
Closely monitor daily ETF inflow data and the legislative progress of the Clarity Act—these two variables will determine whether the rebound can continue.