


#我的Gate交易时刻 Behind the easing of the international situation, the game and changes in the crypto market
The pricing logic of global risk assets has always been anchored on the dual main lines of geopolitical struggles and monetary policy.
In the first half of June, the navigation crisis in the Strait of Hormuz and the unexpectedly high U.S. inflation data jointly exerted downward pressure on Bitcoin, pushing the price from the $70k mark down to below $60k, hitting a nearly 20-month new low during the correction. On June 15, as the international situation showed signs of phase-wise easing, Bitcoin experienced a technical rebound, briefly climbing back above the $65k level, with market sentiment slightly recovering from the "extreme fear" zone.
The immediate catalyst for this rebound came from a phase-wise cooling of geopolitical risks.
Previously, the blockage of navigation in the Strait of Hormuz caused by the U.S.-Iran standoff had pushed up international oil prices and strengthened global inflation expectations, becoming a key external factor suppressing the crypto market. As both sides reached a temporary navigation agreement, energy supply risks in the Gulf region eased, with Brent crude oil prices falling below $95, and global risk assets generally saw a recovery in risk appetite—U.S. stock futures and commodities strengthened simultaneously, the dollar index weakened slightly, and Bitcoin, as a high-volatility risk asset, also saw renewed buying interest.
The marginal improvement in macro expectations also provided support. With only two trading days left before the first FOMC meeting hosted by new Federal Reserve Chair Jerome Powell on June 17-18, the market currently prices in a 98.2% probability that the Fed will keep interest rates unchanged, easing fears of short-term tightening.
Despite U.S. CPI rising to 4.2% year-over-year in May, a three-year high, market expectations for rate hikes within the year remain elevated. However, before policy decisions are implemented, the market entered a brief "wait-and-see" recovery window, with some short-sellers taking profits, driving the rebound. Based on capital and trading data, initial signs of institutional fund replenishment have appeared in this rebound.
After five consecutive days of net outflows, the U.S. spot Bitcoin ETF recorded a single-day net inflow of $85.85 million on June 12, the highest in nearly four weeks, with major products like BlackRock's iBIT and Fidelity's FBTC contributing most of the increase. The market interprets this as institutional funds beginning to cautiously test buying on dips around $60k. However, it should be noted that since June, ETF net outflows have exceeded $2.1 billion, approaching the total outflow for May, indicating that the long-term capital exit trend has not fundamentally reversed. Market volatility remains intense, with a 24-hour total liquidation amount reaching $339 million, over 100k investors' positions being liquidated, with short positions accounting for more than 70%, reflecting ongoing fierce leverage gameplays in the short term.
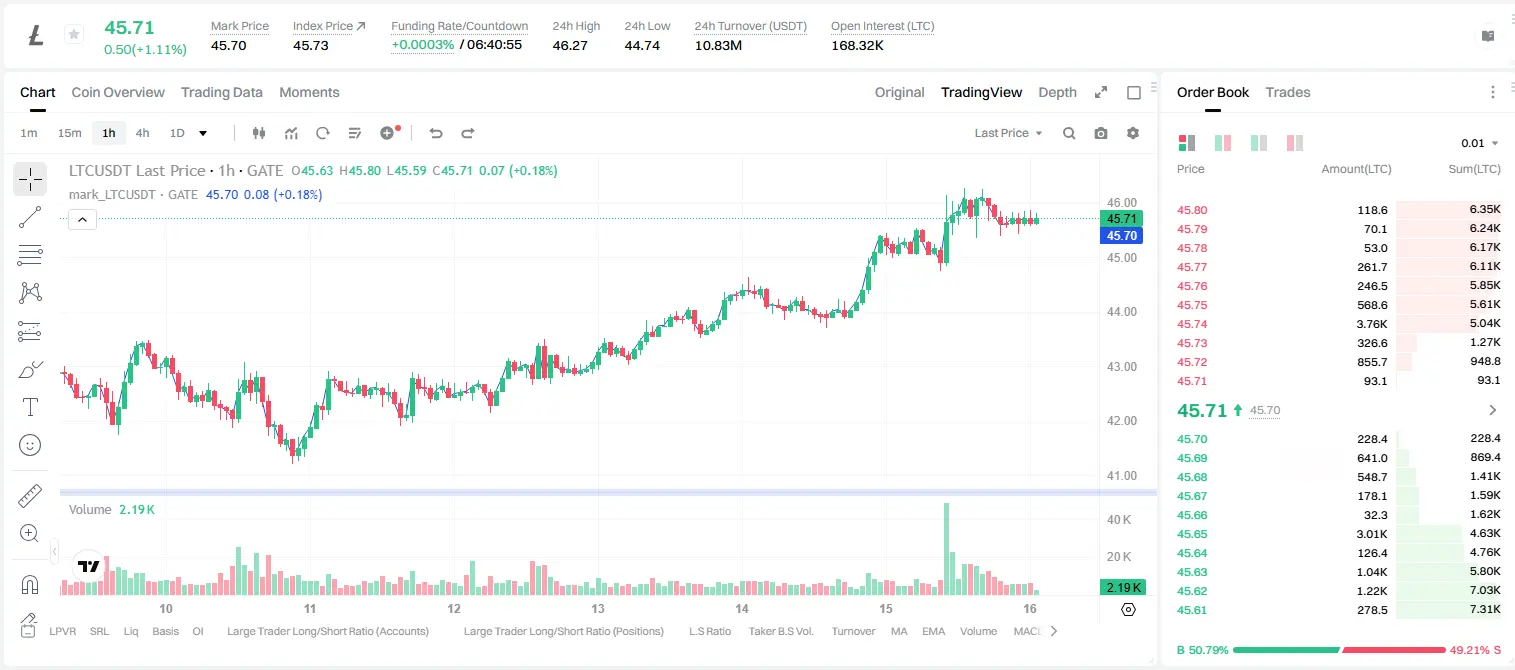
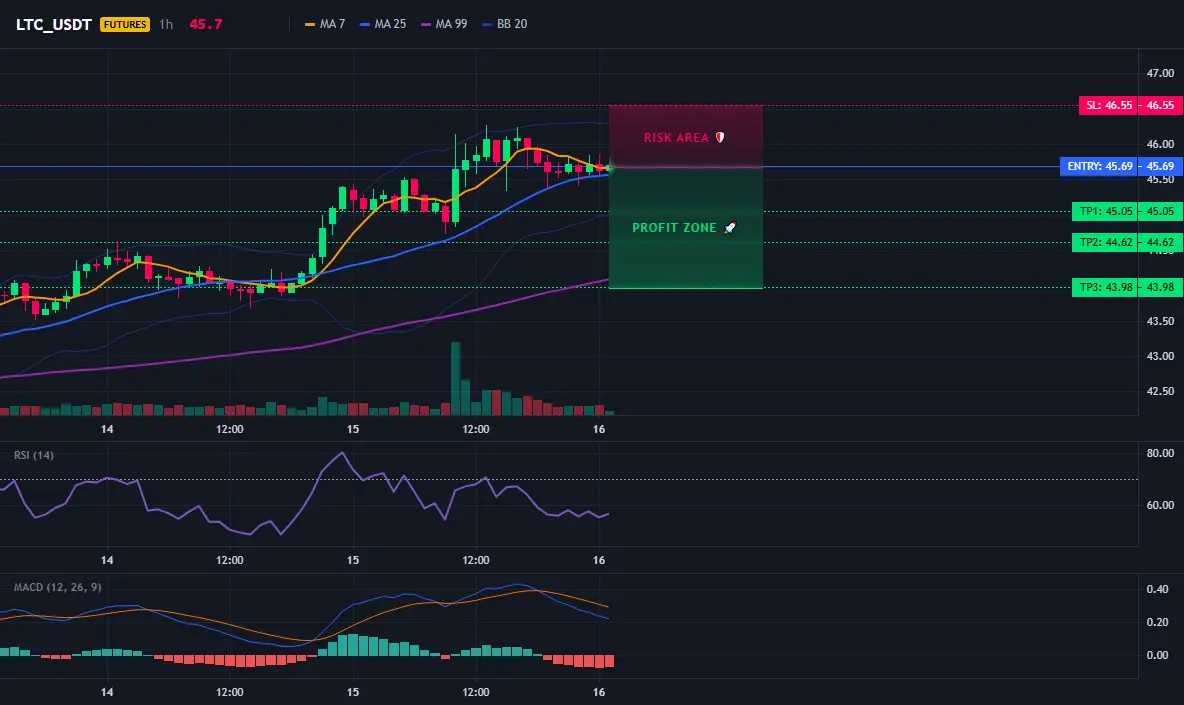
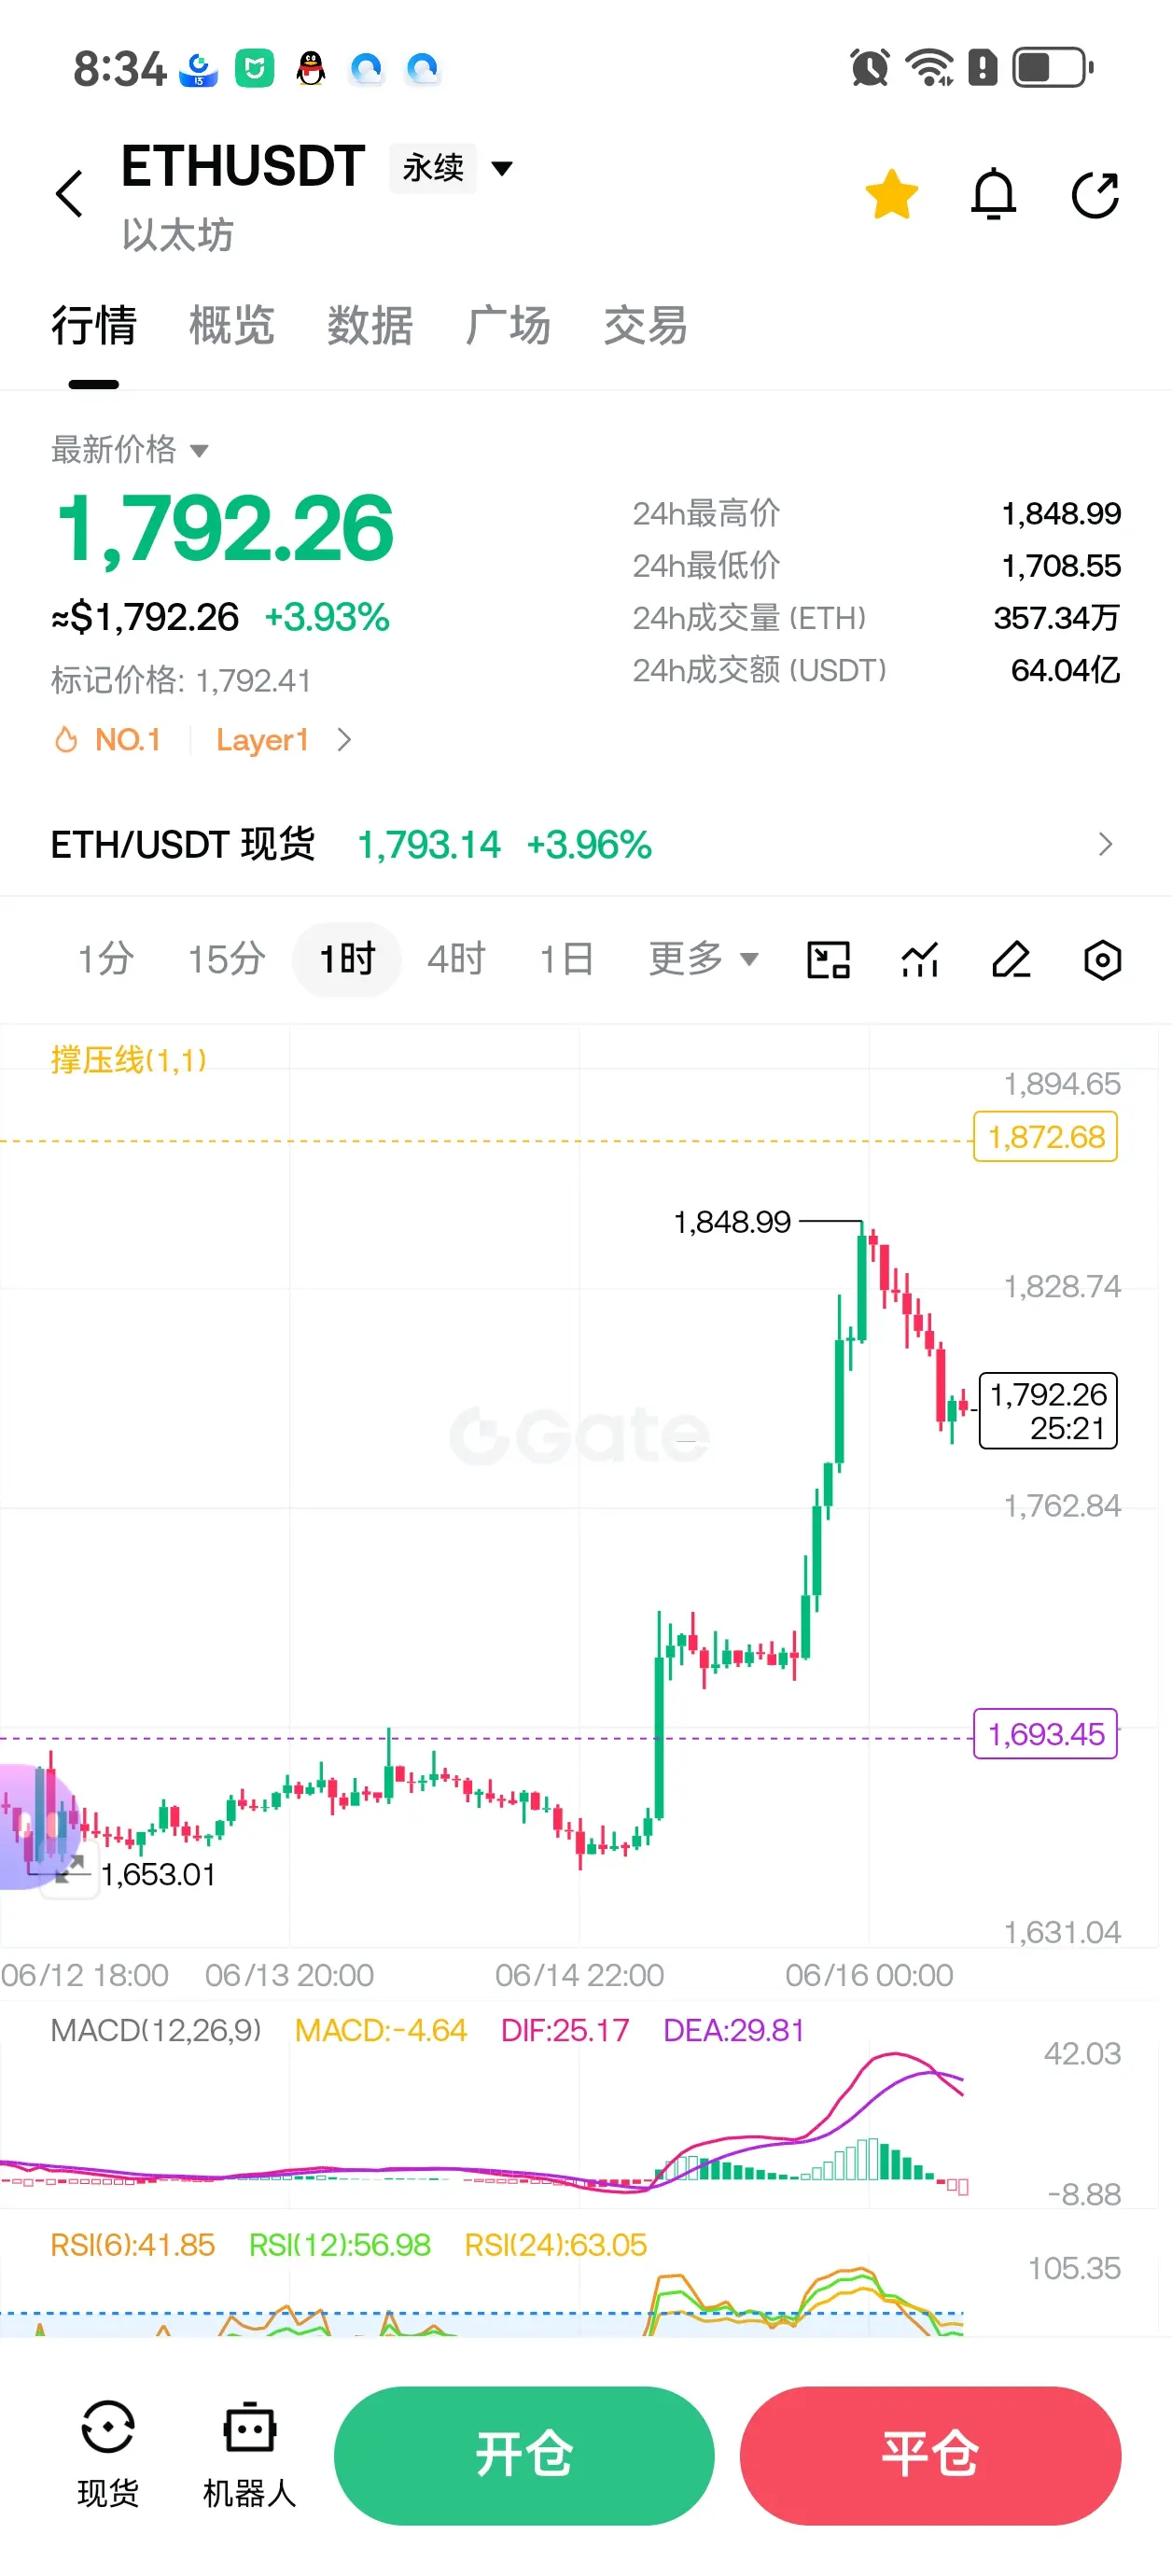
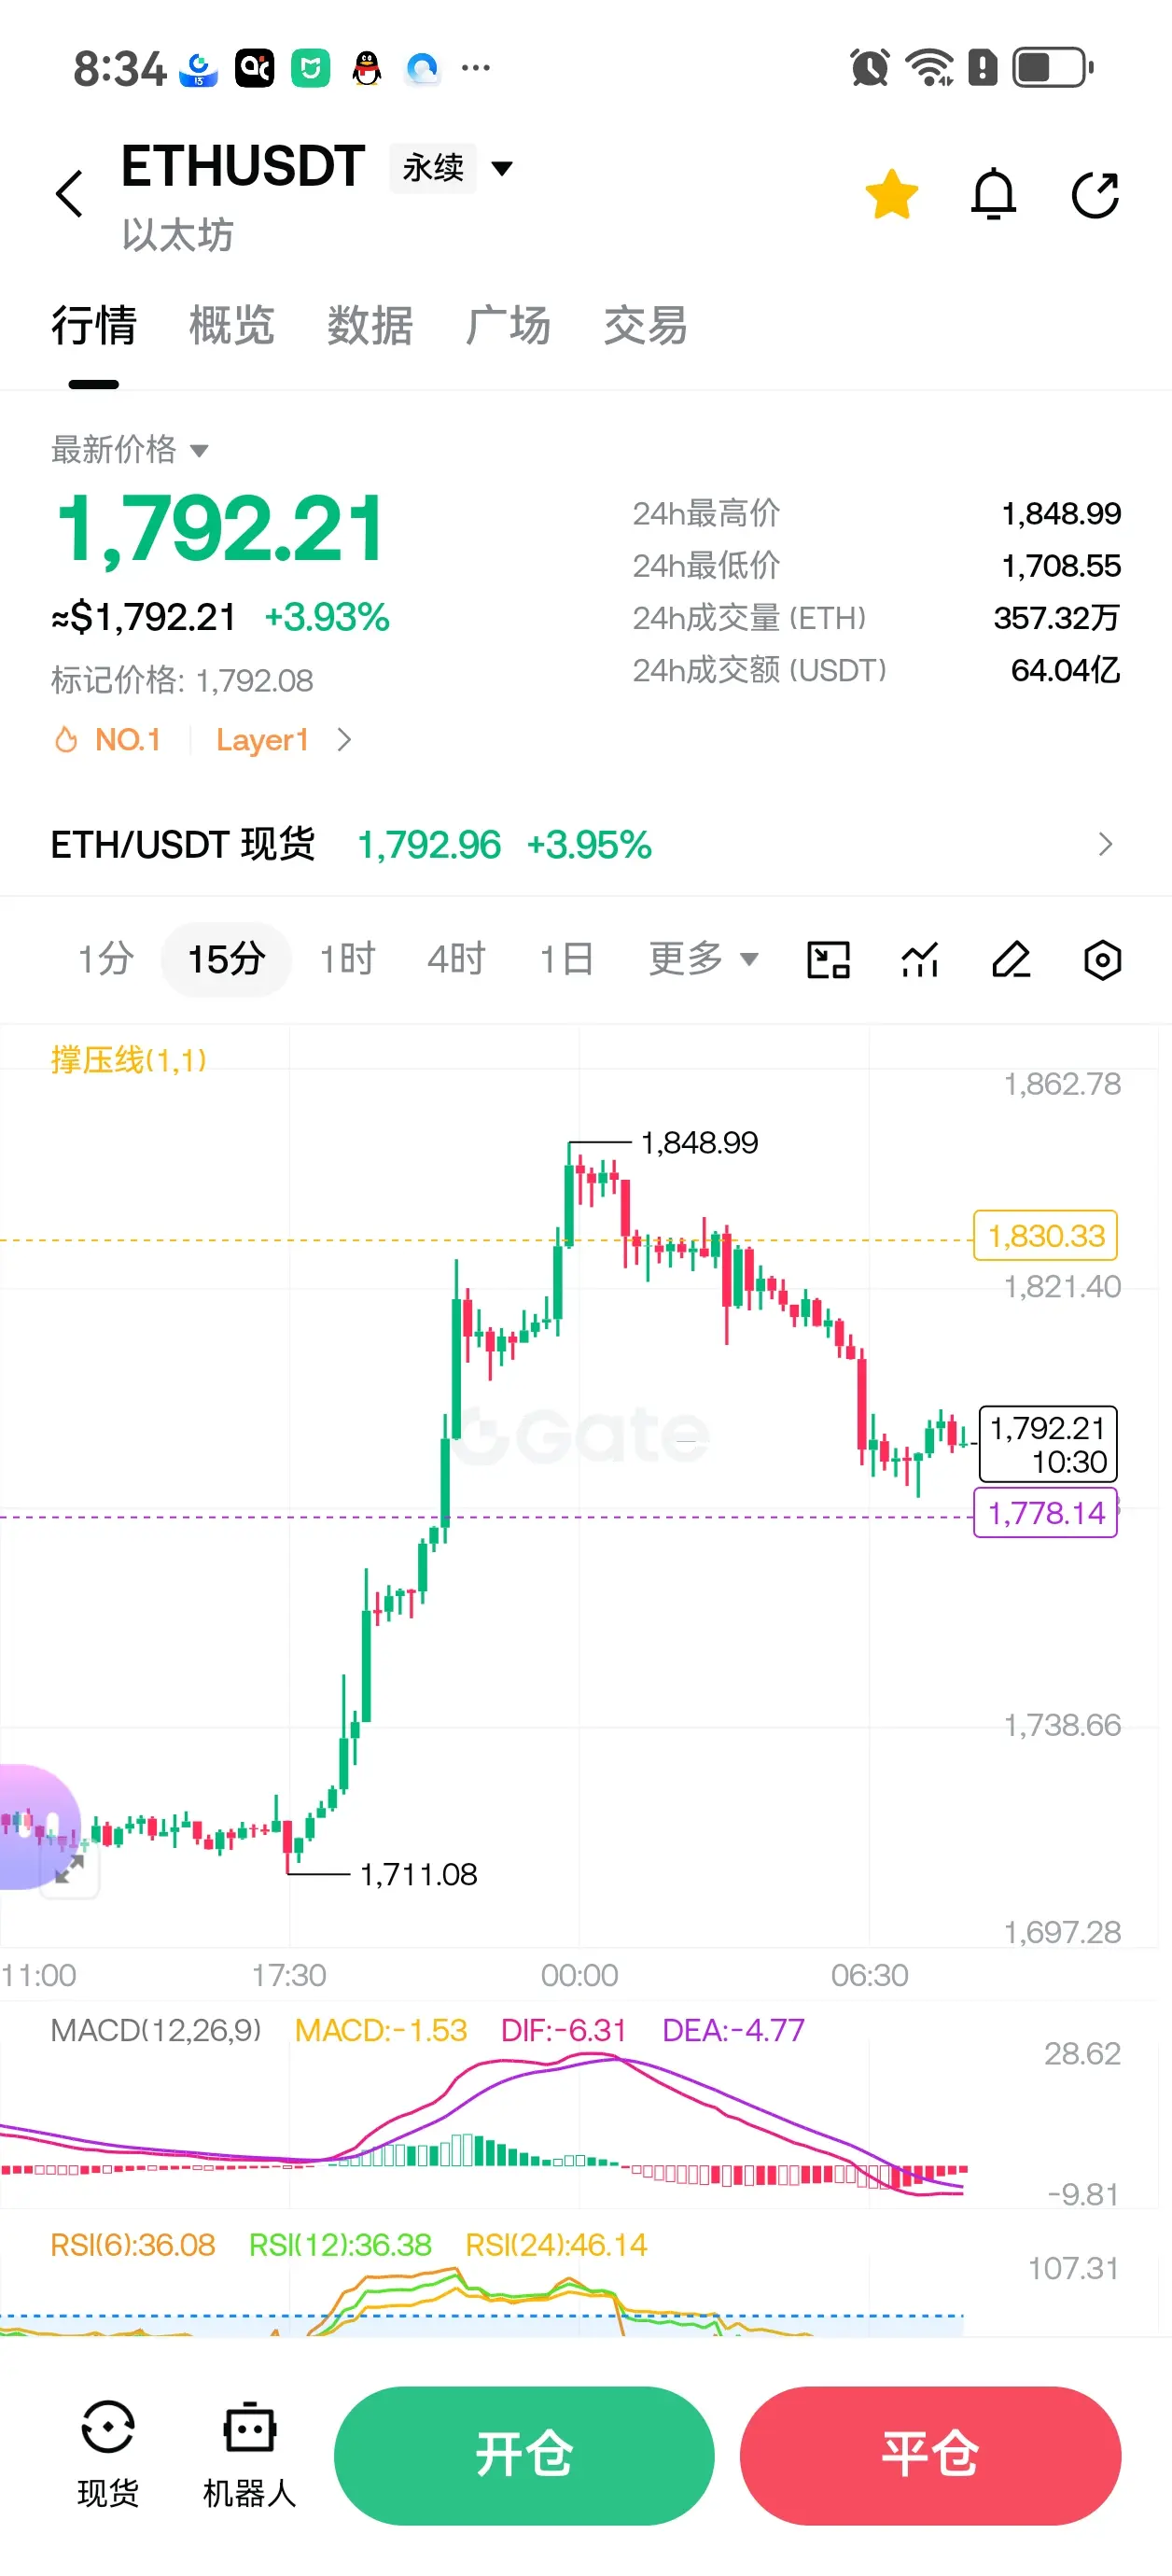
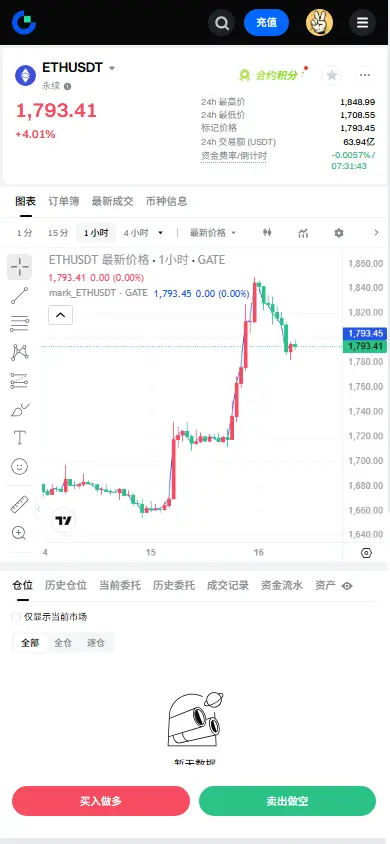
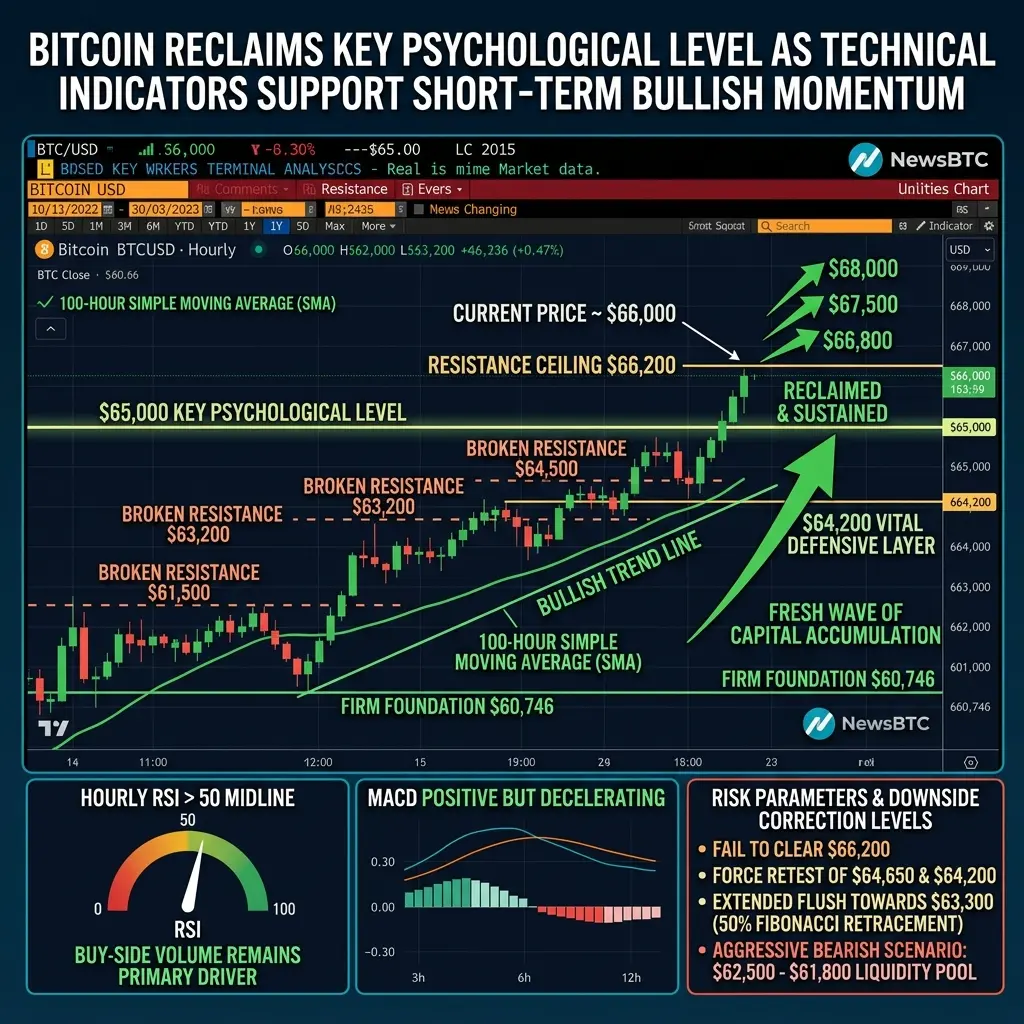
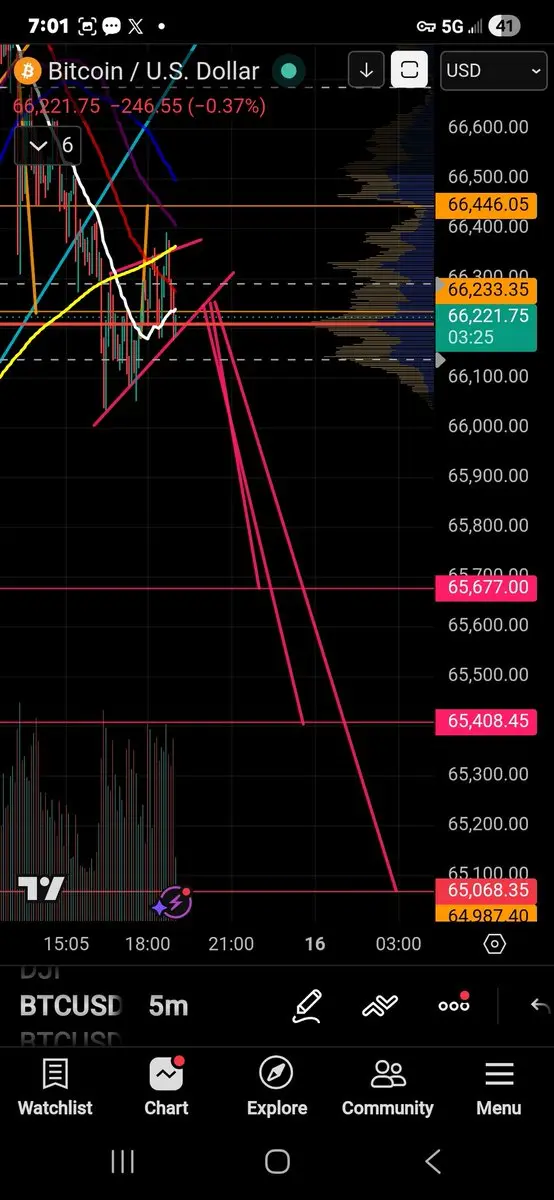
Technically, Bitcoin currently remains in a conflicting pattern of "big-cycle pressure and small-cycle rebound." On the daily chart, the price is still below the 20-day moving average (around $66,700), with all cycle moving averages in a bearish alignment, and the overall downtrend structure unchanged; the daily RSI is about 42, in a neutral-weak zone, neither entering oversold territory to trigger a strong rebound nor having enough momentum for sustained upward movement. On the short-term hourly chart, a clear upward channel has formed, with the price above short-term moving averages, but volume is relatively moderate, and a bearish divergence has appeared on the 15-minute level, indicating diminishing rebound momentum.
Overall, this rebound is more of a technical correction driven by the easing of the international situation rather than a trend reversal. The future trajectory will still depend on the Fed's policy signals and capital flows: if the FOMC meeting signals dovishness and ETF funds continue to flow in, Bitcoin could recover to the $68,000–$70,000 range; if the Fed intensifies rate hike expectations or geopolitical tensions flare up again, the price is likely to test the $60k support again, and a decisive break below could open further downside space.
For investors, it is not advisable to blindly chase the rally at this stage, and caution should be exercised regarding the risk of a second correction after the rebound, with particular attention to the effectiveness of breaking through the resistance at around $66,700. $BTC
The pricing logic of global risk assets has always been anchored on the dual main lines of geopolitical struggles and monetary policy.
In the first half of June, the navigation crisis in the Strait of Hormuz and the unexpectedly high U.S. inflation data jointly exerted downward pressure on Bitcoin, pushing the price from the $70k mark down to below $60k, hitting a nearly 20-month new low during the correction. On June 15, as the international situation showed signs of phase-wise easing, Bitcoin experienced a technical rebound, briefly climbing back above the $65k level, with market sentiment slightly recovering from the "extreme fear" zone.
The immediate catalyst for this rebound came from a phase-wise cooling of geopolitical risks.
Previously, the blockage of navigation in the Strait of Hormuz caused by the U.S.-Iran standoff had pushed up international oil prices and strengthened global inflation expectations, becoming a key external factor suppressing the crypto market. As both sides reached a temporary navigation agreement, energy supply risks in the Gulf region eased, with Brent crude oil prices falling below $95, and global risk assets generally saw a recovery in risk appetite—U.S. stock futures and commodities strengthened simultaneously, the dollar index weakened slightly, and Bitcoin, as a high-volatility risk asset, also saw renewed buying interest.
The marginal improvement in macro expectations also provided support. With only two trading days left before the first FOMC meeting hosted by new Federal Reserve Chair Jerome Powell on June 17-18, the market currently prices in a 98.2% probability that the Fed will keep interest rates unchanged, easing fears of short-term tightening.
Despite U.S. CPI rising to 4.2% year-over-year in May, a three-year high, market expectations for rate hikes within the year remain elevated. However, before policy decisions are implemented, the market entered a brief "wait-and-see" recovery window, with some short-sellers taking profits, driving the rebound. Based on capital and trading data, initial signs of institutional fund replenishment have appeared in this rebound.
After five consecutive days of net outflows, the U.S. spot Bitcoin ETF recorded a single-day net inflow of $85.85 million on June 12, the highest in nearly four weeks, with major products like BlackRock's iBIT and Fidelity's FBTC contributing most of the increase. The market interprets this as institutional funds beginning to cautiously test buying on dips around $60k. However, it should be noted that since June, ETF net outflows have exceeded $2.1 billion, approaching the total outflow for May, indicating that the long-term capital exit trend has not fundamentally reversed. Market volatility remains intense, with a 24-hour total liquidation amount reaching $339 million, over 100k investors' positions being liquidated, with short positions accounting for more than 70%, reflecting ongoing fierce leverage gameplays in the short term.
Technically, Bitcoin currently remains in a conflicting pattern of "big-cycle pressure and small-cycle rebound." On the daily chart, the price is still below the 20-day moving average (around $66,700), with all cycle moving averages in a bearish alignment, and the overall downtrend structure unchanged; the daily RSI is about 42, in a neutral-weak zone, neither entering oversold territory to trigger a strong rebound nor having enough momentum for sustained upward movement. On the short-term hourly chart, a clear upward channel has formed, with the price above short-term moving averages, but volume is relatively moderate, and a bearish divergence has appeared on the 15-minute level, indicating diminishing rebound momentum.
Overall, this rebound is more of a technical correction driven by the easing of the international situation rather than a trend reversal. The future trajectory will still depend on the Fed's policy signals and capital flows: if the FOMC meeting signals dovishness and ETF funds continue to flow in, Bitcoin could recover to the $68,000–$70,000 range; if the Fed intensifies rate hike expectations or geopolitical tensions flare up again, the price is likely to test the $60k support again, and a decisive break below could open further downside space.
For investors, it is not advisable to blindly chase the rally at this stage, and caution should be exercised regarding the risk of a second correction after the rebound, with particular attention to the effectiveness of breaking through the resistance at around $66,700. $BTC