

Public Companies Bought $575M in BTC and ETH Last Week
During June 1–7, public companies acquired 4,508 BTC (roughly $288 million) and added large ETH positions, according to Lookonchain data. Strategy led the Bitcoin buys with 1,550 BTC purchased at an average price of $65,332, costing about $101 million. Strive also added 32 BTC on the same day. On the Ethereum side, Bitmine acquired 126,971 ETH, valued at approximately $214 million at current prices — its largest single-week accumulation of 2026. The company now holds roughly 5.54 million ETH, representing about 4.59% of Ethereum's circulating supply. Combined, the two companies accounted for just over half of the $575 million total institutional accumulation last week.
DEX Activity Picked Up Sharply
Trading on decentralized exchanges rebounded strongly during the same period. Spot volume rose 64% week-over-week, while perpetuals volume climbed 69%. The surge in on-chain trading suggests renewed engagement from market participants even as prices remained under pressure. Whether this activity translates into sustained momentum depends on whether spot demand follows.
Stablecoin Market Cap Contracted by $3.47 Billion
The total stablecoin market capitalization declined by $3.47 billion last week. The contraction signals liquidity leaving the market rather than waiting on the sidelines for reallocation, which could make a sustained recovery harder to maintain without fresh capital inflows.
Funding Rates Turned Negative
Bitcoin perpetual futures funding rates have moved into negative territory, with the annualized rate near minus 2%. This indicates that bearish traders are now more confident and willing to pay to hold short exposure. When funding rates are negative, shorts are paying longs — a setup that historically has preceded sharp short squeezes if price moves against them.
Where the Short Squeeze Risk Actually Sits
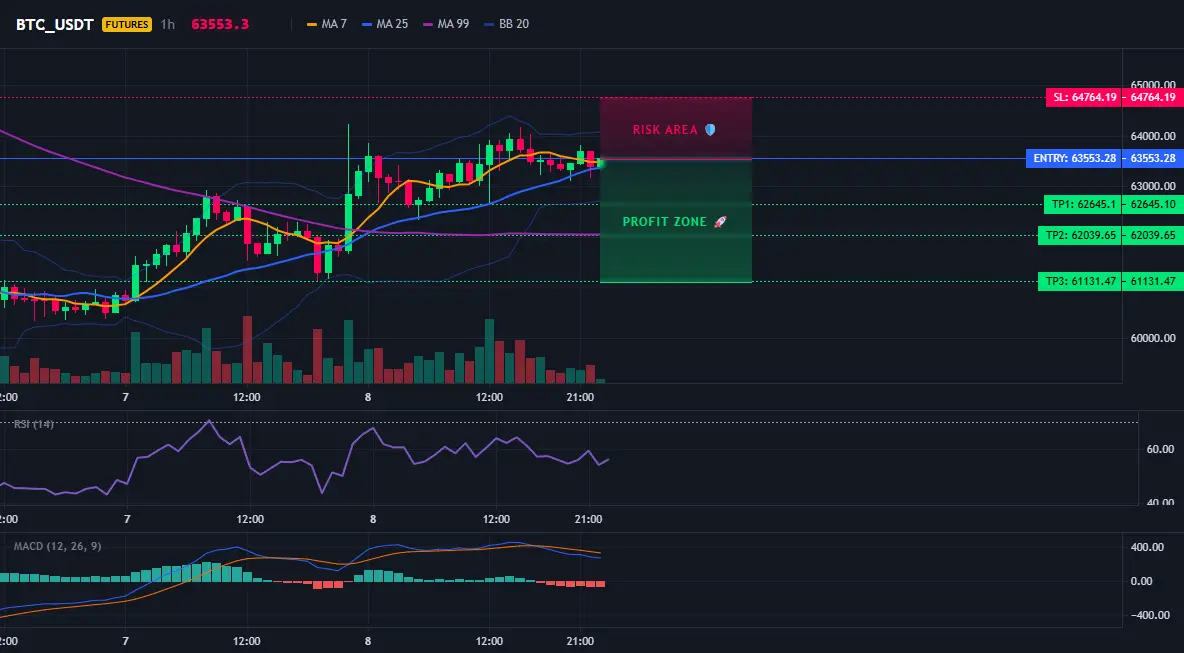
Crowded short positions have accumulated between $63,000 and $66,000. If Bitcoin rebounds toward $66,000, an estimated $2.6 billion in short positions could be forced out. By comparison, a further decline from current levels to $57,000 would put about $1.2 billion in long positions at risk. This asymmetry makes the current range more dangerous for bears than the headline price action suggests.
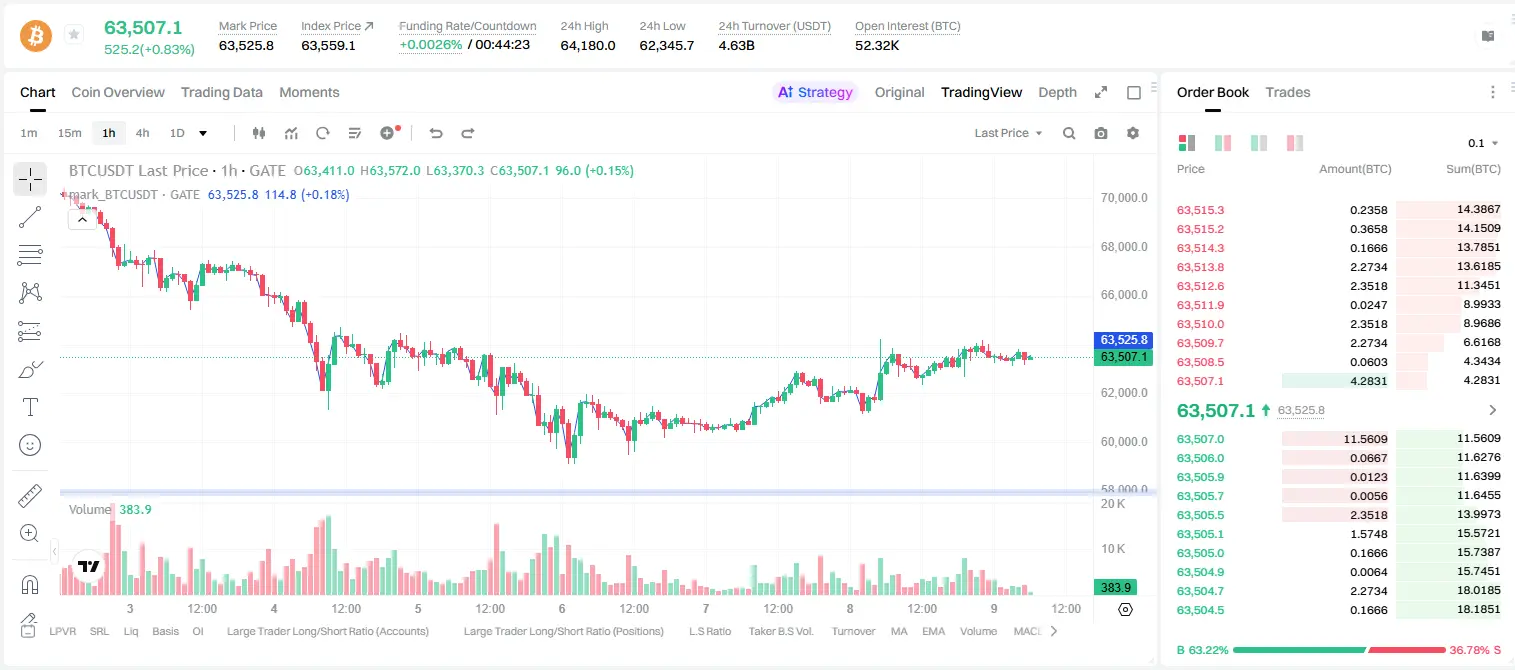
Technical support sits between $59,000 and $62,000, which aligns with the zone where funding flipped negative. On June 5, Bitcoin briefly fell below $60,000, touching $59,100, before bouncing back above $62,000. The clean test of that support zone and the subsequent recovery confirm its significance.
What This Means for Positioning
The leverage reset has removed much of the crowded long positioning that fueled the prior drawdown. Open interest has fallen substantially, and funding now tilts toward short-heavy. Cleaner positioning means the market is less prone to cascading liquidations on the downside, but it does not replace lost spot demand.
Bitcoin ETF outflows remain a headwind. US spot Bitcoin ETFs posted 13 consecutive days of net outflows through last week, totaling $4.33 billion. Until ETF flows stabilize or reverse, upside conviction will remain limited.
For now, the structure favors a potential relief rally driven by short covering, but sustained upside requires fresh spot demand — which has not yet materialized.
This content is for informational purposes only and does not constitute financial advice. Always conduct your own research.
#BitcoinRalliesOver5Percent
$BTC $ETH
During June 1–7, public companies acquired 4,508 BTC (roughly $288 million) and added large ETH positions, according to Lookonchain data. Strategy led the Bitcoin buys with 1,550 BTC purchased at an average price of $65,332, costing about $101 million. Strive also added 32 BTC on the same day. On the Ethereum side, Bitmine acquired 126,971 ETH, valued at approximately $214 million at current prices — its largest single-week accumulation of 2026. The company now holds roughly 5.54 million ETH, representing about 4.59% of Ethereum's circulating supply. Combined, the two companies accounted for just over half of the $575 million total institutional accumulation last week.
DEX Activity Picked Up Sharply
Trading on decentralized exchanges rebounded strongly during the same period. Spot volume rose 64% week-over-week, while perpetuals volume climbed 69%. The surge in on-chain trading suggests renewed engagement from market participants even as prices remained under pressure. Whether this activity translates into sustained momentum depends on whether spot demand follows.
Stablecoin Market Cap Contracted by $3.47 Billion
The total stablecoin market capitalization declined by $3.47 billion last week. The contraction signals liquidity leaving the market rather than waiting on the sidelines for reallocation, which could make a sustained recovery harder to maintain without fresh capital inflows.
Funding Rates Turned Negative
Bitcoin perpetual futures funding rates have moved into negative territory, with the annualized rate near minus 2%. This indicates that bearish traders are now more confident and willing to pay to hold short exposure. When funding rates are negative, shorts are paying longs — a setup that historically has preceded sharp short squeezes if price moves against them.
Where the Short Squeeze Risk Actually Sits
Crowded short positions have accumulated between $63,000 and $66,000. If Bitcoin rebounds toward $66,000, an estimated $2.6 billion in short positions could be forced out. By comparison, a further decline from current levels to $57,000 would put about $1.2 billion in long positions at risk. This asymmetry makes the current range more dangerous for bears than the headline price action suggests.
Technical support sits between $59,000 and $62,000, which aligns with the zone where funding flipped negative. On June 5, Bitcoin briefly fell below $60,000, touching $59,100, before bouncing back above $62,000. The clean test of that support zone and the subsequent recovery confirm its significance.
What This Means for Positioning
The leverage reset has removed much of the crowded long positioning that fueled the prior drawdown. Open interest has fallen substantially, and funding now tilts toward short-heavy. Cleaner positioning means the market is less prone to cascading liquidations on the downside, but it does not replace lost spot demand.
Bitcoin ETF outflows remain a headwind. US spot Bitcoin ETFs posted 13 consecutive days of net outflows through last week, totaling $4.33 billion. Until ETF flows stabilize or reverse, upside conviction will remain limited.
For now, the structure favors a potential relief rally driven by short covering, but sustained upside requires fresh spot demand — which has not yet materialized.
This content is for informational purposes only and does not constitute financial advice. Always conduct your own research.
#BitcoinRalliesOver5Percent
$BTC $ETH