Share crypto content and earn up to 60% commissions through content mining.
placeholder
gatefun
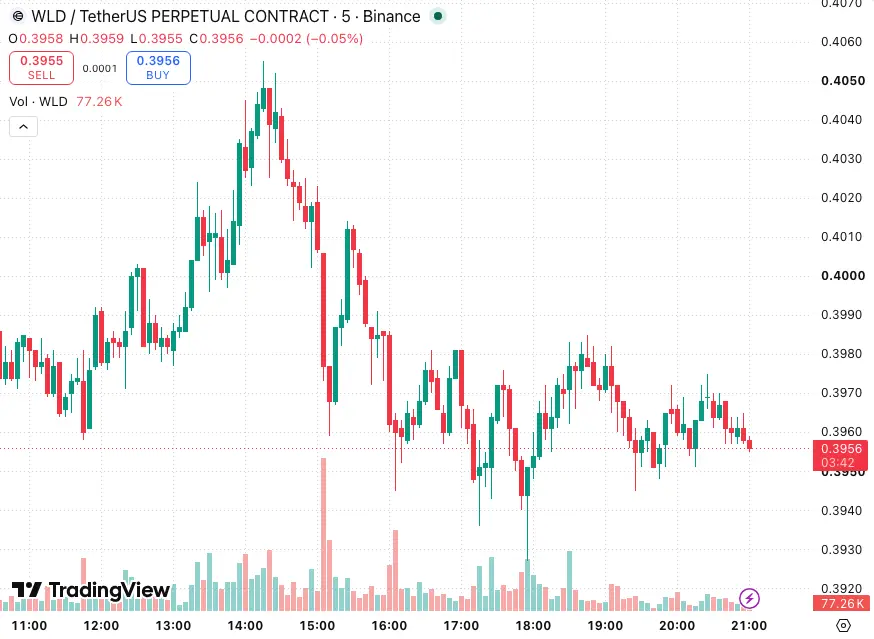
$WLD Keep shorting. This coin is basically allergic to bullish candles. Right now, it may keep sliding down the stairway to find the next support. For an entry, watch around 0.3962 to 0.4061. For downside targets, first look at 0.3854, then further down at 0.3728. Place the defense level at 0.4183. But watch the risk: if the 0.3950 support holds, there could be a rebound after a fake breakdown. Never go all-in. Control your position size based on your own account. Also, you can check the bearish patterns of $ESPORTS and $SNDK .
WLD-3.65%
View Original
post-image
  • Reward
  • Comment
  • Repost
  • Share
Crypto Market Behavior During High Volatility
gate liveLIVE
85
  • Reward
  • Comment
  • Repost
  • Share
Crypto Myth vs Fact
gate liveLIVE
87
  • Reward
  • Comment
  • Repost
  • Share
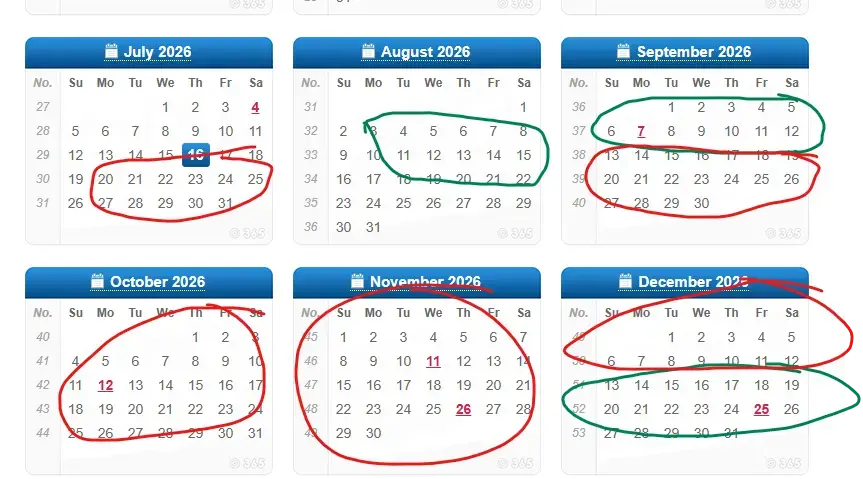
first dip, they look smart for buying it, greed returns.
September November is rape, no relief until late q4.
think this is exactly how stocks play out.
crypto should be a relief rally until September as well.
post-image
  • Reward
  • 1
  • Repost
  • Share
DuniaForexCrypto:
Magic Calendar Kah
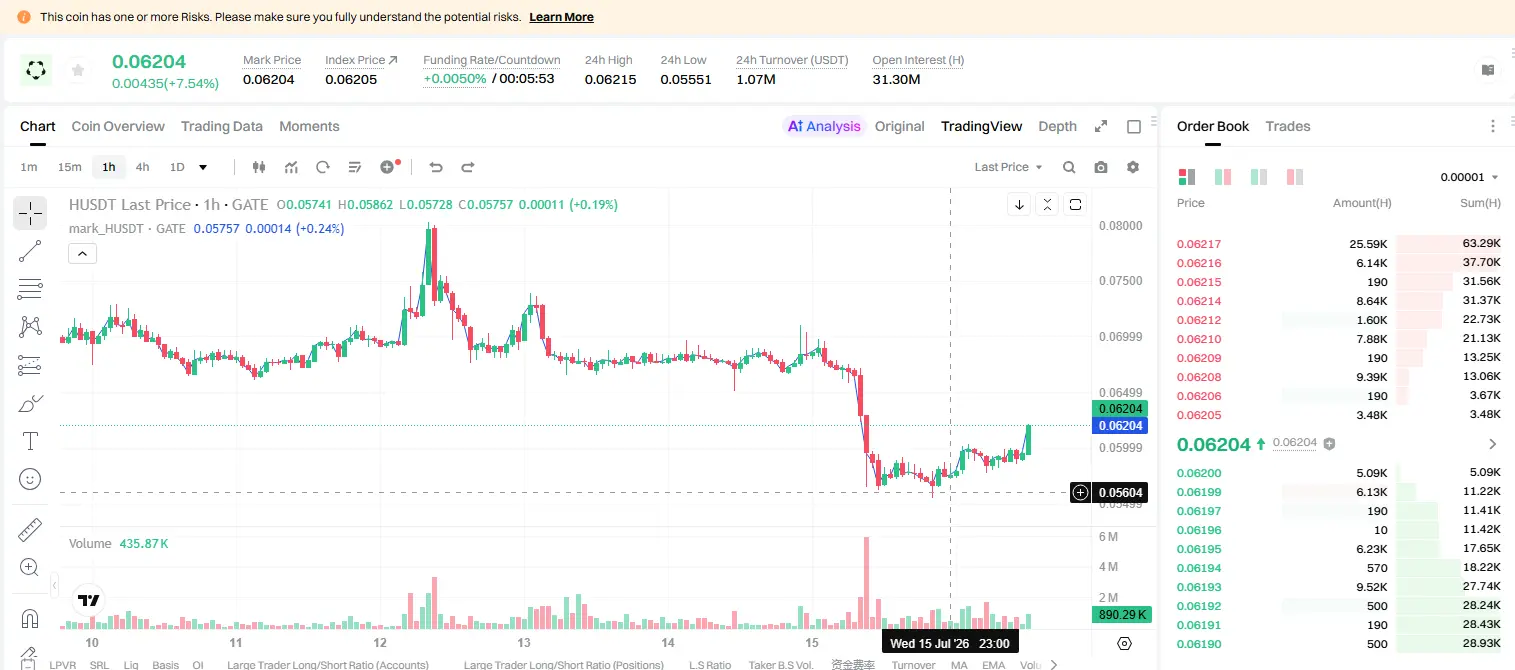
H/USDT 95% bearish signal—are you brave enough to follow it?

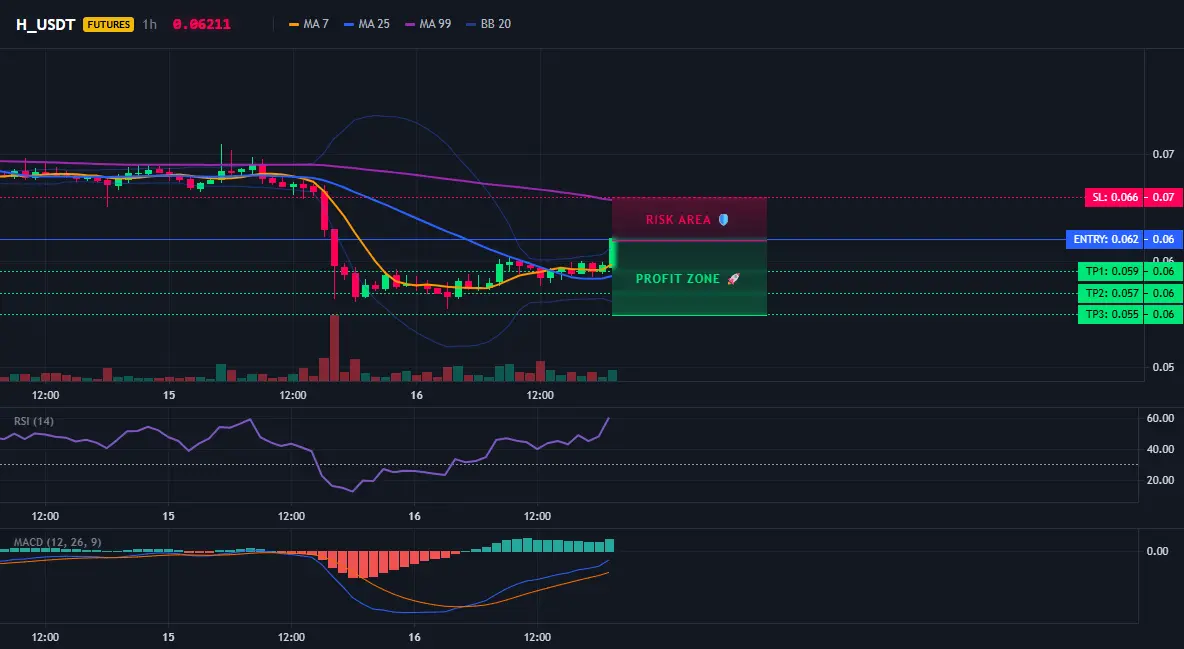
$H /USDT - SHORT

Trading plan:
Entry: 0.062 – 0.062
SL: 0.066
TP1: 0.059
TP2: 0.057
TP3: 0.055

Why focus on this setup?
- On the 4-hour timeframe it’s clearly bearish; the 1D trend is bearish too. The 15m RSI hit 74.61, entering the overbought zone—reversal is imminent.
- Current price is 0.062. EMA support is weak. The short targets TP1 0.059 and TP2 0.057, with SL set just at 0.066.
- Why now? Because the 15-minute RSI is overheated, making a short-term pullback extremely likely, and the daily bearish momentum hasn’t faded ye
H4.08%
View Original
post-image
post-image
  • Reward
  • Comment
  • Repost
  • Share
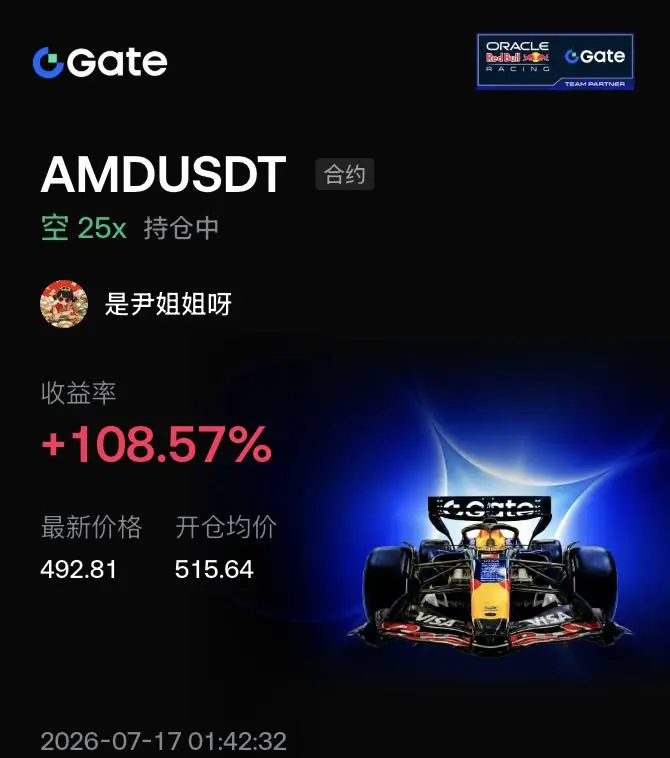
AMD has taken out more again 😬@JS大鲨鱼
AMD-5.29%
View Original
post-image
  • Reward
  • Comment
  • Repost
  • Share
This price action is kind of outrageous! 🚨📉 A few days ago in the early hours, it was still hovering at high levels. At first glance it looked quite strong, but when you look closer you’d know—there wasn’t anyone taking it on the way up. The more it was stretched and hollow, the easier it was to get hammered down later.

During the intraday top-stalling, I watched $CTR ’s rebound strength and found the volume couldn’t keep up. Once selling pressure showed up, it got pushed back down immediately. So around 0.02063, I opened a long position directionally, aiming to ride along with weakness in
CTR-1.56%
BTC-1.13%
ETH-2.42%
View Original
post-image
  • Reward
  • Comment
  • Repost
  • Share
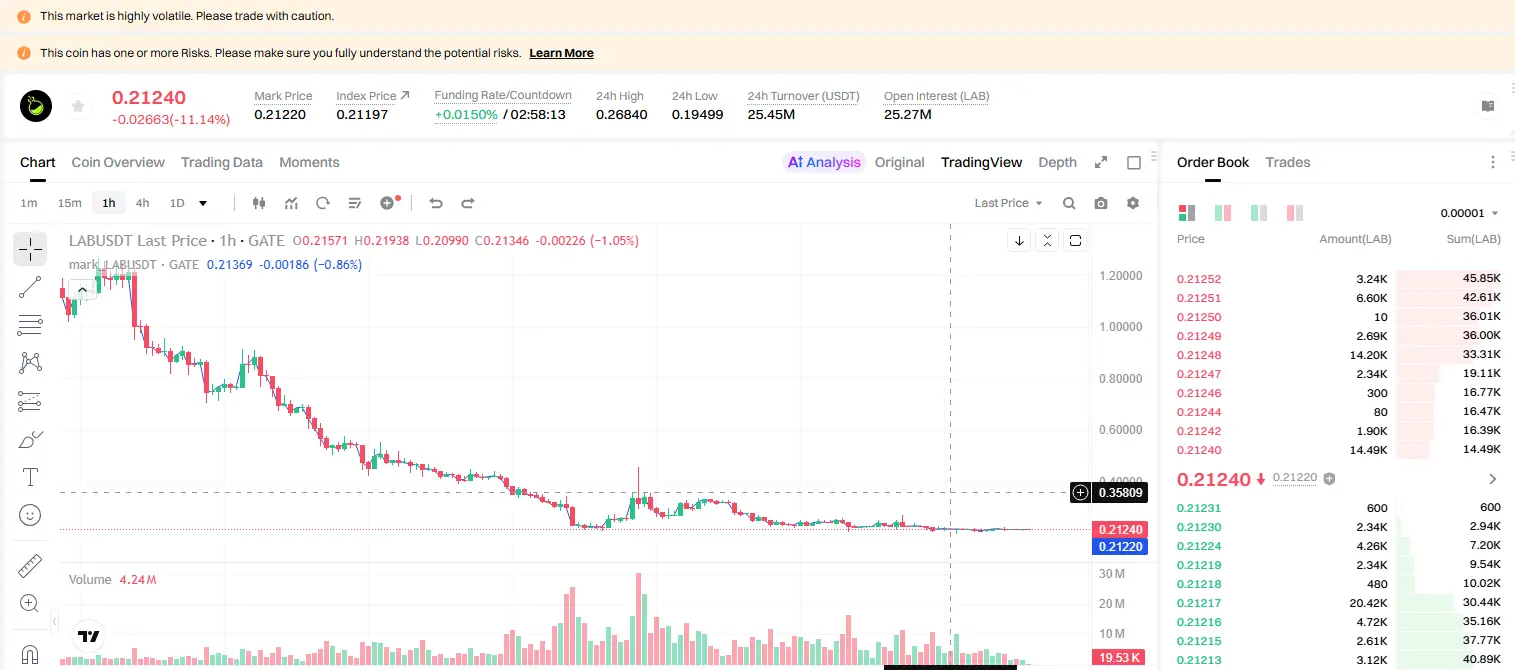
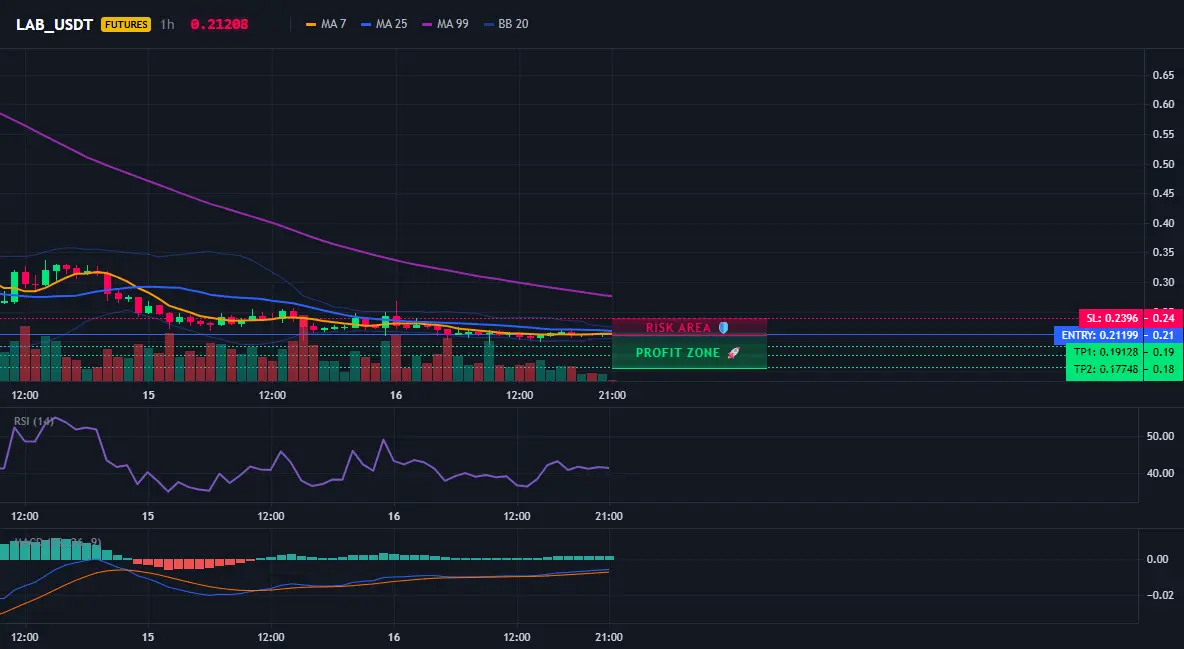
$LAB /USDT 4-hour timeframe bearish signals are already activated—what are you waiting for?

$LAB /USDT - SHORT the market

Trading plan:
Entry: 0.20911 – 0.21487
SL: 0.23960
TP1: 0.19128
TP2: 0.17748
TP3: 0.15678

Why watch this structure?
Current EMA/RSI data points to near-term downside pressure: the 15-minute RSI is 48.31, neutral but slightly weak; the 1-day trend is ranging, but the 4-hour direction is clearly SHORT. The entry reference is 0.21199, TP1 at 0.19128 (about -9.8%), TP2 at 0.17748 (about -16.3%), with SL at 0.23960. Why now? The signal is already live, and bearish momentum
LAB-9.24%
View Original
post-image
post-image
  • Reward
  • Comment
  • Repost
  • Share
Who’s in—or not??? If not, look at 👀 again. This round of the $TSLAX short isn’t just mouth-hardness after the fact. A few days ago, in the afternoon when the price action was still creeping upward, I clearly noticed strong resistance overhead—pull it and it turns soft, and the volume also didn’t keep up 📌
At the time, what I was watching was simple: a low-momentum / weak-volume rally with nobody stepping in to buy it—then the “bait for longs” feeling only got heavier. Around 419.62, I directly signaled to open a long—not chasing emotions, but to lock onto that level 🎯
Now the price is at 3
TSLAX-1.02%
BTC-1.13%
ETH-2.42%
View Original
post-image
  • Reward
  • Comment
  • Repost
  • Share
This one drop and the chart basically stops pretending! 📉🔥 I opened the chart this morning to look at $HYPE —the previous days’ look of stubbornly propping up at the high level is already gone. Once the shorts got active, the rhythm became very clear.

A few days ago, before bed, I watched HYPE. What I saw wasn’t strong continuation, but clear suppression overhead, weak rebounds, and volume not keeping up👀 Every time it surged, it was missing that one breath. At the time, I warned not to chase longs. The long opportunities were actually cleaner.

From 63.334 to now 62.63—this round is up 1
HYPE-7.08%
BTC-1.13%
ETH-2.42%
View Original
post-image
  • Reward
  • Comment
  • Repost
  • Share
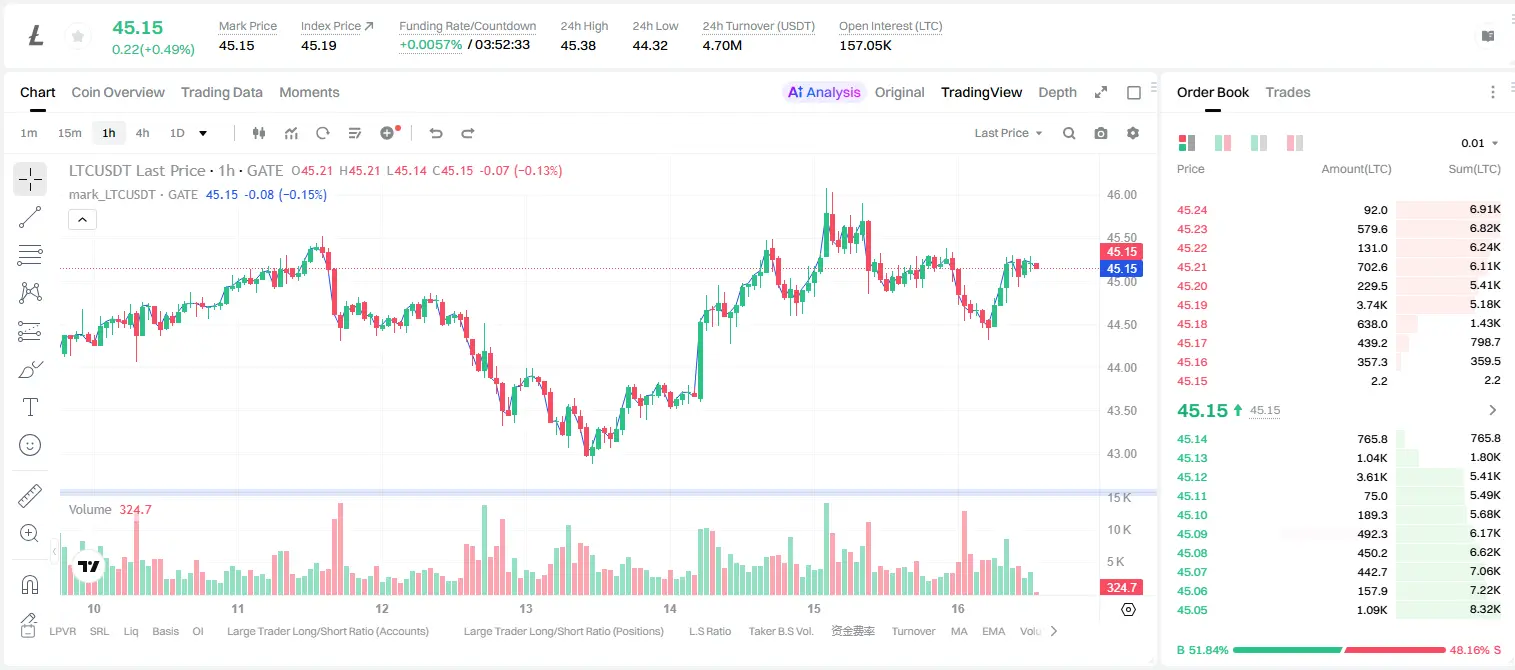
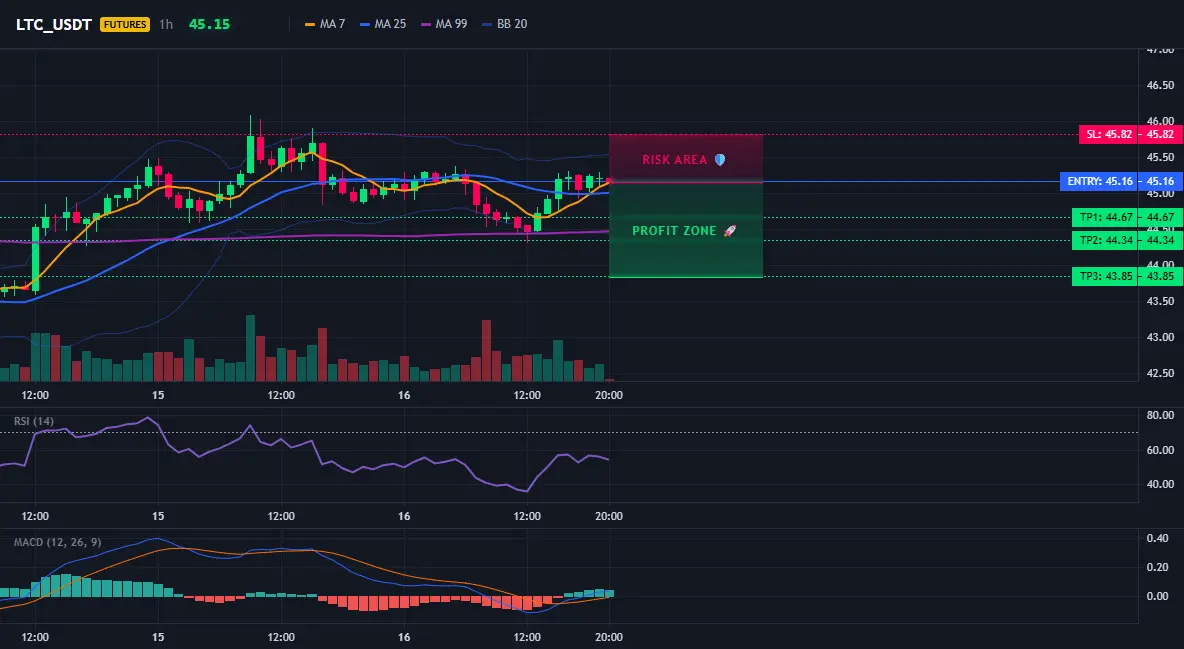
LTC 44.8 won’t break—will shorts get squeezed?
$LTC /USDT - SHORT sell
Trading plan:
Entry: 45.09 – 45.23
SL: 45.82
TP1: 44.67
TP2: 44.34
TP3: 43.85
Why focus on this structure?
- The 1D trend is clearly bearish, with a 95% confidence short signal.
- 15-minute RSI is 54.15; rebounds lack strength, and EMA suppression is still in place.
- Enter now: TP1 44.67, TP2 44.34, stop loss 45.82, risk-reward ratio 1:2.5.
Discussion:
Are you betting on this move reaching TP2 first, or is it going to fake up and pull back to 45.8?
LTC0.11%
View Original
post-image
post-image
  • Reward
  • Comment
  • Repost
  • Share
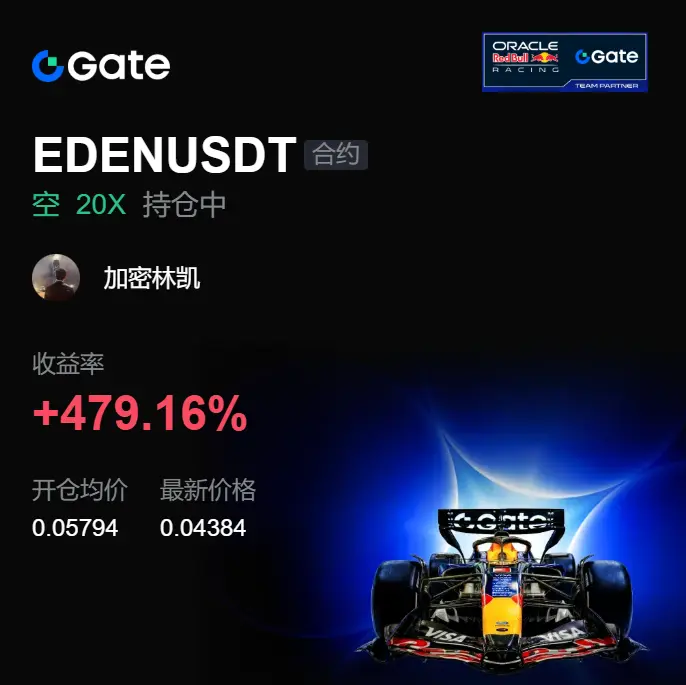
This downside profit isn’t luck you’ve cashed in on—it’s timing and rhythm.

When $EDEN repeatedly went sideways at high levels before, many people thought it was building up energy. I thought the structure had clearly changed. After the price touched 0.05794, the rebound got weaker and weaker, while the key levels started drifting downward step by step. What this kind of market is most afraid of isn’t simply going down—it’s grinding you until you doubt, then suddenly accelerating.

Back then, I wasn’t watching a single candlestick. I was watching how price reacted after each push in terms o
EDEN1.65%
BTC-1.13%
ETH-2.42%
View Original
post-image
  • Reward
  • Comment
  • Repost
  • Share
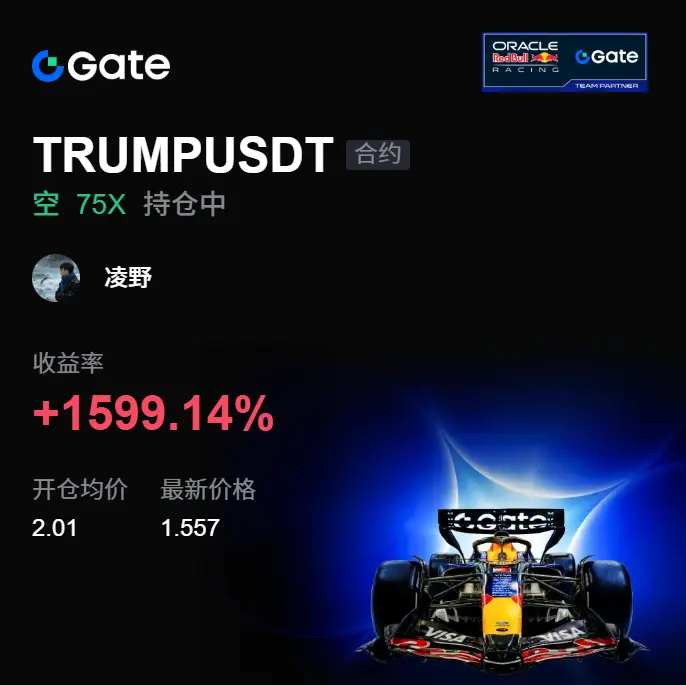
Don’t say. This round is really giving face.📉🔥 Before the board was fully underway, $TRUMP kept grinding above, and everyone was still watching. What I saw was weak rebounds and insufficient support—if nobody is there to take bids once it goes up, it’s easy to get smashed.

A few days ago around 2.010 in the early hours, I pointed it out: don’t乱冲 under high-position pressure then; the shorts’ tempo was clearer.👀📌 It’s not that I’m saying it after it starts dropping—back then when it couldn’t push up, the feel was already there.

Now the price is at 1.557. From 2.010 to the current price,
TRUMP-1.52%
BTC-1.13%
ETH-2.42%
View Original
post-image
  • Reward
  • Comment
  • Repost
  • Share
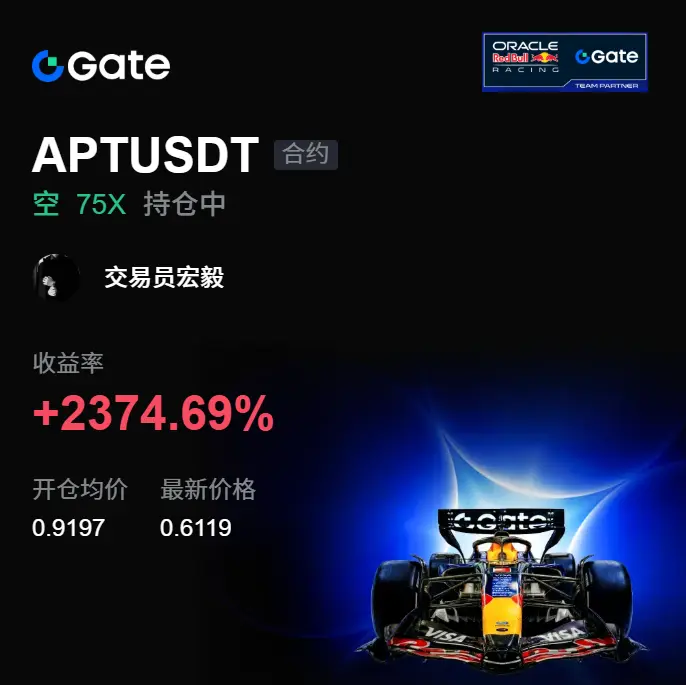
This drop finally broke through; the short position has managed to open up the space. $APT It was repeatedly topped in the high zone before. What I care about isn’t whether it can still break higher, but the fact that after every push it can’t be held—buy pressure relay keeps getting weaker. This already doesn’t look right.

At the time, I was watching the pressure above APT. When the price got to around 0.9197, the rebound looked fierce, but the moment it touched the key level, it was pushed back down. A lot of people are still waiting for a second surge. I, however, feel the structure has
APT-1.88%
BTC-1.13%
ETH-2.42%
View Original
post-image
  • Reward
  • Comment
  • Repost
  • Share
Gate Polymarket has just rolled out a new feature, Real-Time Market Movement Alerts, designed to help users catch large capital flows the moment they happen, without needing to manually scan through every prediction event's order book.
The feature is available starting with app version v8.27.0, and its core function is monitoring large buy and sell transactions across all prediction markets in real time. The system pushes out capital flow signals and sentiment shifts directly to users, so there's no need to sit and watch individual events one by one, any significant trade gets flagged the inst
post-image
  • Reward
  • Comment
  • Repost
  • Share
This move is honestly a bit outrageous! 🚀 A few days ago, around midnight, it was still grinding like it was annoying—$BTC moving up and down without taking a clear stance. But I kept it simple: the key level hadn’t been broken, buyers were absorbing at the lows, and the sell pressure was getting lighter 📌
While everyone else was still watching, around 59,719.6 I signaled to go long. Not because it had already taken off, but because it was grinding the bottom without breaking the level—the structure started to show the flavor 👀
Some money isn’t made by impulse.
When it’s time to take profi
BTC-1.13%
ETH-2.42%
SOL-1.94%
View Original
post-image
  • Reward
  • Comment
  • Repost
  • Share
Gate has launched a new Stock Portfolio Bot, giving users a way to build and automatically maintain a diversified equity portfolio across more than 12,500 stocks spanning the US, Hong Kong, and South Korean markets.
The core idea is straightforward, users pick between 2 and 10 stocks and assign each one a target allocation percentage. As prices move and the portfolio's actual weights drift away from those targets, the bot steps in automatically, trimming positions that have grown overweight and adding to ones that have fallen underweight, continuously pulling the portfolio back toward its orig
post-image
  • Reward
  • Comment
  • Repost
  • Share
Gate's new Top Coins Lucky Matrix campaign is live, running from July 16 through July 25, and it stacks three separate reward layers around futures trading activity across BTC, ETH, SOL, and XRP.
The first layer is the simplest, the first 10,000 users who register during the event automatically receive a 10 USDT position voucher, first-come, first-served, no trading required.
The second layer is where the daily draw chances come in, and this is genuinely built around regular trading habits rather than one-off actions. There are two tiers of tasks for each of the four supported coins. The check
BTC-1.13%
ETH-2.42%
SOL-1.94%
XRP-1.62%
post-image
  • Reward
  • Comment
  • Repost
  • Share
$ETH Ethereum is currently trading around $1,872, below both the 7-day EMA at $1,886 and the 30-day moving average at $1,910, and the technical picture here points to a real struggle between different timeframes rather than a clear directional signal.
The moving average structure aligns with the actual price action this week, where ETH broke above resistance around $1,895 and rose to $1,923, meaning the current short-term decline appears more like a pullback following last week's breakout than a new crash. The RSI being at 40.7 also supports this reading, weak but far from the oversold zone, c
ETH-2.39%
  • Reward
  • Comment
  • Repost
  • Share
This move is really a bit outrageous! 🚨📉 A few days ago in the early morning, it was just grinding back and forth. $PEPE looked like it was about to surge upward, but every time you looked up, it was pushed back. The moment sell pressure showed up, the chart immediately gave itself away. 👀 What I saw at the time was pretty simple: a limitless push-up, but no solid follow-through, and a rebound with no strength. In this kind of position, it’s not suitable to chase from the front. Around 0.000003521, I got a short-entry window—so I followed the plan and went for it. 🎯 Now the price has moved
PEPE-2.07%
BTC-1.13%
ETH-2.42%
View Original
post-image
  • Reward
  • Comment
  • Repost
  • Share
Load More

Join 40 M users in our growing community

⚡️ Join 40 M users in the crypto craze discussion
💬 Engage with your favorite top creators
👍 See what interests you
  • Pinned