













Share crypto content and earn up to 60% commissions through content mining.
placeholder
gatefun
JUST IN: Samsung and Broadcom reportedly inked a five-year, $200B advanced storage chip foundry deal. If confirmed, this could deepen supply chain ties in semiconductors and memory tech. $SAMS $AVGO
AVGO-2.79%
post-image
  • Reward
  • Comment
  • Repost
  • Share
$TLM /USDT - LONG
Trade Plan:
Entry: 0.0018122 – 0.0018258
SL: 0.0016415
TP1: 0.0019521
TP2: 0.0020409
TP3: 0.0021740#EventContractsLaunch
TLM8.02%
post-image
  • Reward
  • Comment
  • Repost
  • Share
#夏日创作营 SpaceX: a dream or a nightmare!
Iron Man was still human after all—not a god. The essence of business isn’t creating myths, it’s manufacturing value. SpaceX’s stock price volatility is precisely proof of that.
When the market cooled down from IPO frenzy and returned to rationality, investors began scrutinizing every expense, every launch, and the operational data of every satellite—under a magnifying glass.
On June 12, its first day of trading, the close price of SpaceX’s $86 billion—its biggest IPO in history—was $160.9, up more than 19% from the $150 offer price. After listing, the st
SPCX-2.71%
View Original
post-image
post-image
  • Reward
  • 7
  • Repost
  • Share
ThisIsTranslateContent::
Hurry up and get on board! 🚗
View More
Get ready for a positive knockout coming your way 😂
View Original
post-image
  • Reward
  • Comment
  • Repost
  • Share
Layout large pie, Ethereum dog head
gate liveLIVE
1,424
  • Reward
  • 3
  • Repost
  • Share
TalkingAboutMemeAsTheCoinMakes:
Bet it all in one go 🤑
View More
ETF Capital Builds Again! Is BTC Ready for Another Breakout?
gate liveLIVE
403
live-coin
  • Reward
  • Comment
  • Repost
  • Share
#夏日创作营
Bitcoin’s sluggish slide hasn’t stopped—why has the extreme shakeout’s open positions increased despite the bears dominating?
I. Macro and market background: Capital outflows tugged by mixed news
The core reason lies in a shifting macro environment and the exhaustion of incremental capital:
Geopolitical headlines are contradictory: Taking U.S. political developments as an example, the House and Senate are issuing inconsistent signals on legislation concerning the authority to conduct military actions toward Iran; on top of that, the ceasefire talks agreement was rejected. The macro
BTC-1.85%
View Original
post-image
ThisIsTranslateContent:
#夏日创作营 Bitcoin’s sluggish decline shows no sign of stopping—why has the extreme washout holding volume increased under the dominance of the bears?
I. Macro and market backdrop: capital outflow vs. contradictory headlines
The core reason lies in a volatile macro environment and the exhaustion of incremental capital:
Geopolitical headlines sending mixed signals: taking US political developments as an example, Congress releases inconsistent signals in a bill regarding powers for military action against Iran, and in addition, the situation-ending ceasefire agreement was rejected. The macro layer is filled with extreme uncertainty, causing both bulls and bears to hesitate.
Incremental capital being withdrawn: the overall capital base in the crypto market is currently relatively weak, with a large amount of liquidity being pulled into the US stock market. Without continuous inflows of OTC funds, it’s unrealistic to blindly expect a major upside one-way rebound.
Market sentiment hits a freezing point: due to prolonged narrow-range up-and-down wash trading, retail investors feel extremely uncomfortable. The Fear and Greed index across the whole network has officially fallen into an “extreme fear” phase around 20.
II. Price-volume analysis: the “undercurrent” behind the increase in open positions
On the chart, there’s a critically important contradiction—while the price keeps probing lower, the total open positions clearly rise during rebounds.
There is indeed bid support at the lows: when the price broke down and touched the 64,600 low, the market didn’t collapse quickly. Instead, alongside the synchronized increase in open positions, there was a rebound, indicating that some capital actively bought and absorbed at the low level.
Bulls are extremely passive: the most unfavorable detail for bulls is that although new positions appeared at the low and were retained, the trades didn’t transform into strong upward momentum. The high failed to effectively break through the prior selloff breakout zone. This means the newly added chips lack sustained upward attack power, and the market structure is still dominated by the bears.
III. Multi-timeframe technicals
Judging from moving averages, the Bollinger Bands, and momentum indicators, each timeframe shows different suppression and support characteristics:
1-hour – 4-hour lines (short-term under pressure): the 5-day and 7-day moving averages have already been fully broken down, and short-term rebound momentum has weakened rapidly. The 4-hour level is currently running along the lower Bollinger Band. The strong resistance concentration is at 65,200 – 65,500. If it cannot break upward effectively, the outlook is more likely to continue breaking down than to just trade sideways in place.
Daily timeframe (extreme compression and mid-term protection at the floor): the daily chart printed a bearish candle, and the price’s center of gravity keeps shifting downward. The Bollinger Bands’ upper and lower rails are in a severe “extreme compression” phase, with price tightly trapped in the narrow range of 64,300 to 65,500. Usually, when such long space keeps tightening, it signals that a new round of major one-way breakout is about to arrive. The 20-day moving average (around 64,300) is still providing a mid-term support floor that has held for three weeks.
Weekly timeframe (weak repair within a downtrend): from a bigger perspective, after the prior quick blow-off top at the high, it quickly fell back, swallowing the earlier upswing gains. Currently, the weekly chart is only a very weak rebound within the broader trend’s downward path, without changing the overarching pressure structure.
Core momentum indicators:
MACD: short-term is in a golden-cross repair below the zero axis, but the expansion in volume is limited. The 4-hour line still maintains a dead-cross configuration, and the counterattack structure has yet to materialize.
DMI – RSI: the DMI indicator shows bears dominate (bearish advantage). Meanwhile, the RSI also failed to return above the 50 strength/weakness dividing line across key timeframes, proving that bulls are passive across the board.
IV. Support and resistance levels
Strong resistance: 65,800, the extreme rebound pressure zone—a disaster area bulls cannot cross.
First resistance: 65,200 – 65,500, the intraday battleground between bulls and bears. If the 4-hour close can stand above this level, it can be viewed as a continuation of weak repair; if it meets resistance, the rebound is immediately considered over.
First support: 64,600 – 64,700, the core short-term defense area. The overlap zone of the prior low probe and the closing area—once broken, the rebound fails and downside risk increases.
Strong support: 64,100 – 64,300, the final mid-term line of defense. Corresponding to the daily and 4-hour channel support—if there’s a breakdown with a wick insertion, focus on whether price can quickly reclaim this level.
Respect the market and manage risk reasonably
In such an extreme sideways washout and a chop market where bulls and bears repeatedly get double-killed, trying to guess the top or bottom subjectively often brings unnecessary stop-loss burden. In the face of market uncertainty, traders should maintain a sense of敬畏之心 (respect/awe) and face normal pullbacks within the trading system. At this stage, staying in cash with a light position or strictly following the key boundaries—short at the top and long at the bottom—with stop-losses in place is the way to preserve strength during a washout and wait for the arrival of the bigger trend. $BTC
repost-content-media
  • Reward
  • 2
  • Repost
  • Share
ThisIsTranslateContent::
Steadfast HODL 💎
View More
🚨 US DATA CENTER POWER BOOM!
Power demand forecast has surged 83% in just 7 months.
194 GW by 2035
Around 20% of US electricity could power data centers.
AI is driving an unprecedented infrastructure boom.
POWER5.48%
post-image
  • Reward
  • Comment
  • Repost
  • Share
Good Morning CT 🌃
Enjoy your weekend.
  • Reward
  • Comment
  • Repost
  • Share
BITCOIN IS GOING TO $300,000 🚀
PASS THE CLARITY ACT 🔥
BTC-1.85%
post-image
  • Reward
  • Comment
  • Repost
  • Share
$DEXE The swings feel great
DEXE150.87%
View Original
post-image
post-image
  • Reward
  • Comment
  • Repost
  • Share
This sell-off didn’t kick off quickly enough, and many people may still be waiting for it to pull back up. What I was watching, though, was the sell pressure after the rebound. The price started weakening around 0.2144; several attempts to reclaim it failed, and the feel of the shorts gradually came through.
What really torments people is the sideways consolidation in the middle: it didn’t get dumped immediately, and it didn’t give a clearly obvious direction. At the time, I didn’t make random moves out of boredom, and I also didn’t see one rebound candle and then chase orders to flip directio
BTC-1.83%
ETH-1.05%
View Original
post-image
  • Reward
  • Comment
  • Repost
  • Share
When people have money, money loses value
When people don’t have money, people lose value
View Original
post-image
  • Reward
  • Comment
  • Repost
  • Share
A legendary old post from an early crypto forum on Baidu Tieba
May 7, 2017
A thread starter bought ten million Dogecoin at a price of 0.006
He made a vow: Please all witness me becoming a millionaire, and I will never sell off or abandon even one
Do you think this cycle, Doge still has a chance to recreate the glory from back then?
DOGE0.49%
View Original
post-image
  • Reward
  • Comment
  • Repost
  • Share
Just finished lunch and was checking the market when the prices on the screen suddenly started to flip. It was pretending to be strong just a moment ago, but in the blink of an eye it turned downward to hunt for key levels. When the market keeps whipsawing during the session, $MAV ’s rebounds never get sustained buying follow-through. The moment sell pressure shows up overhead, the price drops. In this situation of insufficient continuation, I’d rather wait for the shorts to confirm.
After completing a long around 0.01362, the chart didn’t give longs too many more opportunities. The current pr
MAV-2.75%
BTC-1.83%
ETH-1.05%
View Original
post-image
  • Reward
  • Comment
  • Repost
  • Share
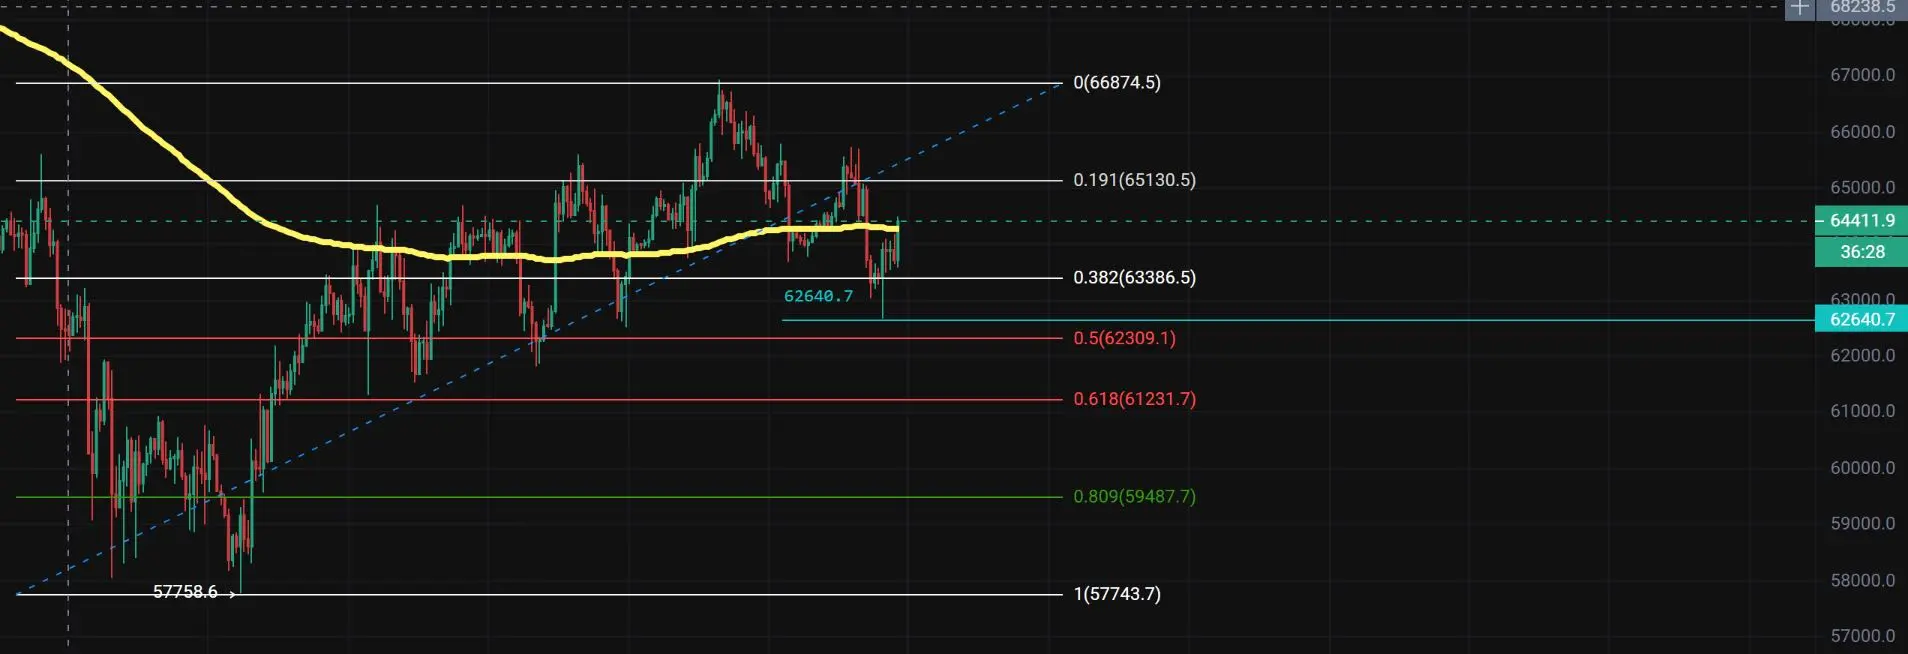
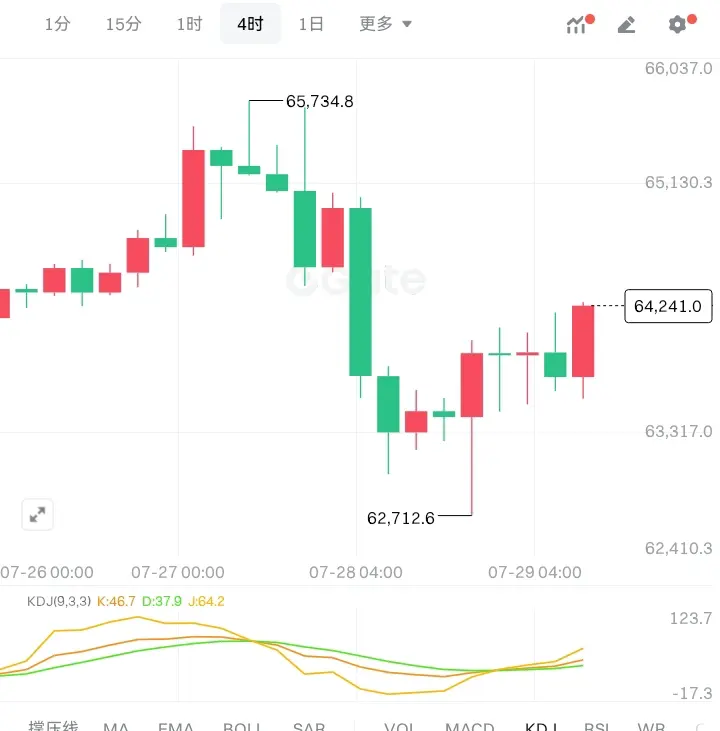
7.25 big cake $BTC shorting idea

Entry: short at 64150 - 64450
Stop-loss: above 64680
First target: 63850 - 63700
Second target: 63550 - 63400

BTC has been steadily falling from the prior high at 65110. After shorts concentrated their release, a short-term corrective consolidation came. Currently, the price is under pressure from the overhead resistance zone; multiple rebounds fail to effectively break through, and the long side’s upside momentum continues to weaken.
This rebound is only a technical pause after a big drop, not a reversal. There’s ample sell pressure in the heavy pressure
BTC-1.83%
View Original
post-image
  • Reward
  • Comment
  • Repost
  • Share
The market action in the opening part was pretty exhausting. The price looked strong at one point, and many people probably expected it to keep rallying. I didn’t chase the order at the time; instead, I watched the repeated spikes and pullbacks around 0.05769, and found that every time it went up, it didn’t leave any real follow-through.
Later, the order book suddenly started to look off: the pump got shorter and shorter, but the dump got faster and faster. That moment confirmed to me that this wasn’t just a wash; the shorts had already started to take the initiative. The price moved from 0.05
BTC-1.83%
ETH-1.05%
View Original
post-image
  • Reward
  • Comment
  • Repost
  • Share
LAB coin is a multi-chaiin,It trades at rough
LAB0.92%
post-image
  • Reward
  • Comment
  • Repost
  • Share
LAB/USDT (1H) Trade Plan.
$LAB #BrentReturnsTo100
Current Price: 0.1549 USDT
Market Structure
LAB recently rallied from 0.1428 to 0.1670, then entered a consolidation phase.
The latest candle is a strong bearish candle, testing the MA30 (0.1534), which is acting as immediate support.
Short-term momentum has weakened, but the overall 1H structure remains neutral-to-bullish as long as 0.1530 holds.
Technical Outlook
Support: 0.1530–0.1540
Major Support: 0.1490
Resistance: 0.1600–0.1620
Major Resistance: 0.1670
Bullish Trade
Entry: 0.1535–0.1555 (after a bullish reversal candle)
Targets:
TP1:
LAB0.92%
post-image
  • Reward
  • Comment
  • Repost
  • Share
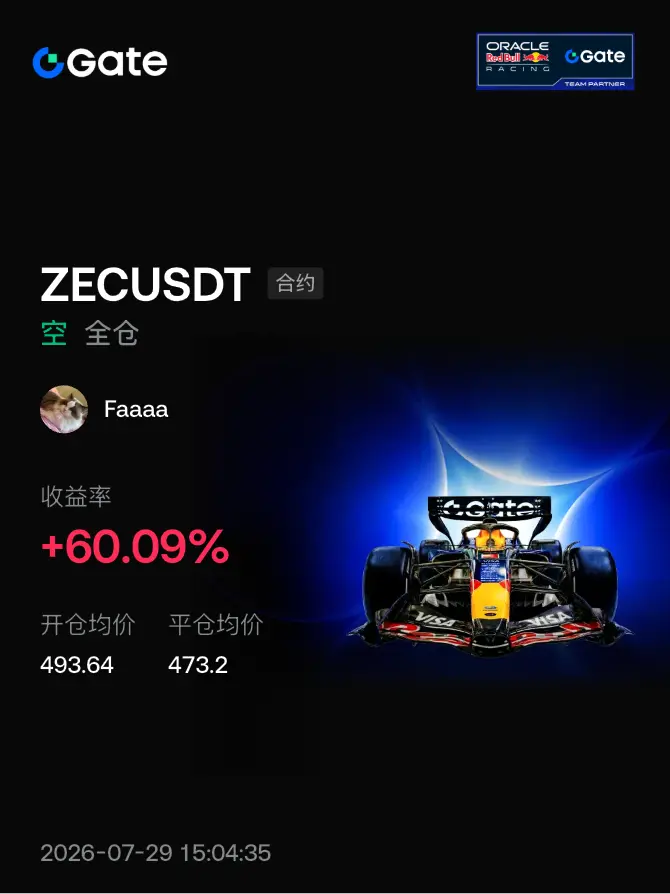
XRP Risks Falling Below $1 While Hyperliquid Eyes $70 Bounce - - #xrp #zec
XRP-1.51%
HYPE-1.81%
ZEC-4.69%
post-image
  • Reward
  • Comment
  • Repost
  • Share
Load More

Join 40 M users in our growing community

⚡️ Join 40 M users in the crypto craze discussion
💬 Engage with your favorite top creators
👍 See what interests you
  • Pinned