Share crypto content and earn up to 60% commissions through content mining.
placeholder
gatefun
Sad stream but CryptoDiscover AURR.........
gate liveLIVE
1,063
  • Reward
  • Comment
  • Repost
  • Share
Most traders are still long SOL — that’s exactly why I’m shorting into 61.95.

$SOL /USDT - SHORT

Trade Plan:
Entry: 64.37 – 64.81
SL: 66.70
TP1: 63.01
TP2: 61.95
TP3: 60.37

Why this setup?
• 95% confidence SHORT on 4h timeframe, 1D trend is bearish.
• Entry zone 64.37–64.81, with tight stop at 66.70.
• RSI 15m at 48.33 shows no immediate bounce — momentum favors downside.
• Why now? ATR 1h at 0.88 suggests volatility contraction before breakdown to TP2.

Debate:
Do you trust a 95% confidence short, or is this the fakeout before the weekend pump?
SOL7.6%
post-image
post-image
  • Reward
  • Comment
  • Repost
  • Share
$BEAT Signal 🚀 1H breakout continuation, buying depth continues to dominate
$BEAT 4H RSI 85.97, MACD histogram still expanding. The 1H Bollinger Band upper band at 3.5996 has been tested, buy depth Bid/Ask Ratio 1.24, order density at high levels. Funding rate 0.0332% remains manageable, OI stable with no liquidation pressure.
🎯Direction: long
⚡Entry/Order: 3.388604 - 3.398800
🛑Stop loss: 3.228860
🚀Target 1: 3.653710
🚀Target 2: 3.781165
🛡️Trade management:
- Execution strategy: Reduce 50% of position after reaching Target 1, and move stop loss to break-even. If price falls back to entry
BEAT59.92%
View Original
post-image
  • Reward
  • Comment
  • Repost
  • Share
I’m shorting TON at 1.6721 while everyone is still looking for the bottom.

$TON /USDT - SHORT

Trade Plan:
Entry: 1.6632 – 1.6810
SL: 1.7572
TP1: 1.6083
TP2: 1.5657
TP3: 1.5019

Why this setup?
Why now? The daily trend is bearish, and my 4h model just armed a SHORT with 95% confidence. RSI on the 15m sits at 44.52—no oversold bounce, just weak momentum. The ATR on the 1h is 0.0355, giving us room to target TP1 at 1.6083 and TP2 at 1.5657 before any real squeeze risk. This isn’t a guess; it’s a structural breakdown in motion.

Debate:
Are you waiting for a dead cat bounce or front-running
TON3.31%
post-image
post-image
  • Reward
  • Comment
  • Repost
  • Share
6 Years Trapped?
That morning cup of coffee now costs 105% more than it did in 2020. Ground beef is up 68%. Heating a home with fuel oil takes 63% more dollars. Inflation has been running so hot for so long that the American paycheck has fallen decisively behind. The Consumer Price Index sits 13% above its 2% trend line, and the Federal Reserve’s preferred core PCE gauge has spent 62 consecutive months above target. The rate-cut narrative is not just delayed. It is buried.
🔹 Essentials Outpace Wages — The Household Squeeze Tightens
Cumulative price increases across daily staples have dramatic
US5000.27%
US500200.27%
post-image
post-image
  • Reward
  • 5
  • Repost
  • Share
SinCity:
To The Moon 🌕
View More
Funds today are not dispersing to chase but are directly pouring into the few strong market makers.
$BSB +65.9%, trading volume reaching $287 million, open interest surged by 77.1% in one hour.
This is not a lack of volume pulse; rather, prices, trading volume, and open interest are rising together, and the market has entered a high-volatility zone.
The long-short ratio is 1.74, indicating funds are clearly leaning long, and whether this momentum can continue depends on if it can sustain this tone.
$BEAT +52.2%, trading volume of $247 million, open interest increased by 40.6%.
The
BSB46.95%
BEAT59.92%
BLESS53.43%
SIREN52.4%
View Original
post-image
  • Reward
  • Comment
  • Repost
  • Share
🚀 $ETH As expected, it plummeted, from 2118.05 → 1631.45, a drop of over 22.97%!
Friends who followed have gained +2135.62%, this is the power of trend-following shorting. 💥
⚠️ Latest instructions:
1 Suggest closing 80%, lock in profits;
2 The remaining 20% to continue trend betting;
3 Move all stop-losses up to the cost price, prioritizing capital preservation.
Friends who missed out don’t need to chase orders, recent opportunities are dense, wait for my next clear signal. ‍$BTC $SOL
ETH7.95%
BTC4.19%
SOL7.6%
View Original
post-image
  • Reward
  • Comment
  • Repost
  • Share
Everyone’s bullish on SLX—but the 4h MTF just flagged a SHORT at 55% confidence.

$SLX /USDT - SHORT

Trade Plan:
Entry: 0.17756 – 0.18022
SL: 0.19163
TP1: 0.16933
TP2: 0.16296
TP3: 0.15340

Why this setup?
Why now? RSI on 15m is 62.5—still overbought in a range-bound 1D trend. ATR of 0.00531 on 1h shows tight volatility, meaning a break below 0.17756 could trigger a cascade to TP1 at 0.16933. The entry ref at 0.17889 is the pivot—if it holds, short bias is active.

Debate:
Is this a fakeout before a dump, or will SLX squeeze to 0.18022 first?
SLX4.03%
post-image
post-image
  • Reward
  • Comment
  • Repost
  • Share
  • Reward
  • 3
  • Repost
  • Share
HighAmbition:
good 👍 good
View More
Good morning, the path taken is not easy, always protect against losses.
gate liveLIVE
178
  • Reward
  • Comment
  • Repost
  • Share
#ShareYourUSStocksWinNvidia ⚡ The Semiconductor Industry: The Backbone of Modern Technology
From smartphones and gaming consoles to artificial intelligence and self-driving vehicles, semiconductors power nearly every aspect of modern life. As technology becomes more advanced, the demand for faster and more efficient chips continues to grow.
Companies such as Nvidia, AMD, Broadcom, and TSMC are benefiting from global investment in AI infrastructure, cloud computing, and high-performance computing. Many analysts believe semiconductors will remain one of the most important sectors for future inno
post-image
  • Reward
  • 6
  • Repost
  • Share
BlackoutCryptoBoy:
To The Moon 🌕
View More
#ShareYourUSStocksWinNvidia 📈 Apple: Why Investors Continue to Trust AAPL
Apple remains one of the world's most valuable companies thanks to its powerful ecosystem, strong brand loyalty, and consistent financial performance. Millions of users rely on Apple products every day, creating a business model that generates recurring revenue through hardware, software, and services.
One of Apple's biggest strengths is its ability to turn innovation into profitable products. From the iPhone and Mac to digital services and AI-powered features, the company continues to expand its reach across multiple i
post-image
  • Reward
  • 8
  • Repost
  • Share
BlackoutCryptoBoy:
To The Moon 🌕
View More
View Original
post-image
  • Reward
  • Comment
  • Repost
  • Share
#ShareYourUSStocksWinNvidia
*#ShareYourUSStocksWinNvidia* - you’re asking again so here’s the quick rundown + what’s live now:
1. *What the campaign is*
Gate’s engagement push for US stock CFDs/tokens. Pattern = *trade + post = rewards*. Same structure as #WinGoldBarsWithGrowthPoints.
*Typical rules*:
1. *Trade NVDA* via CFDs or US stock tokens on Gate
2. *Post PnL/win screenshot* on Gate Square with #ShareYourUSStocksWinNvidia + analysis
3. *Win NVDA tokens, USDT, fee rebates, or merch*
2. *NVDA setup right now*
*Price*: $173.51, -0.13% today
*Catalysts pushing Gate to feature it*:
1. *UAE d
BTC4.12%
GT4.08%
post-image
post-image
post-image
  • Reward
  • 1
  • Repost
  • Share
HighAmbition:
thnxx for the update good 💯
$BEAT Signal】Long position · 1H volume breakout + buying depth advantage
$BEAT RSI 1H 83.58, 4H MACD bars narrowing but still expanding above zero. Bid/Ask 1.24, thick buy orders. Current price touches 3.399, upper Bollinger band at 3.599 not reached. Bulls actively pushing up, trading volume has been increasing for three consecutive hours.
🎯Direction: long
⚡Entry/Order: 3.388604 - 3.398800
🛑Stop loss: 3.228860
🚀Target 1: 3.653710
🚀Target 2: 3.781165
🛡️Trade management:
- Execution strategy: Reduce 50% of the position after reaching Target 1, and move the stop loss to break-even. If th
BEAT61.78%
BTC4.12%
ETH7.89%
View Original
post-image
  • Reward
  • Comment
  • Repost
  • Share
Everyone is still bullish on LTC, but the 1D trend just flipped bearish with 95% confidence.

$LTC /USDT - SHORT

Trade Plan:
Entry: 41.5 – 41.7
SL: 42.9
TP1: 40.6
TP2: 40.0
TP3: 39.0

Why this setup?
• RSI on the 15m is at 44.1 — already below neutral, hinting at early downside momentum.
• ATR on the 1h is tight (0.54), suggesting a breakout is imminent.
• Primary targets: TP1 at 40.6, TP2 at 40.0 — with a hard invalidation only above 46.5.
• Why now? The 4h structure is armed for a SHORT, and the daily trend confirms the path of least resistance is down.

Debate:
Are you scaling into sho
LTC4.37%
post-image
post-image
  • Reward
  • Comment
  • Repost
  • Share
$SIREN Signal】Long position 4H buying volume gap + capital support
$SIREN RSI 4H skyrocketed to 82.42, Bollinger Band upper band 1.28 was broken, and the current price 1.2943 stabilized.
1H MACD histogram shrank to 0.005, bullish momentum marginally decreasing but buying depth indicated by 1.40 shows strong support below.
Funding rate 0.039% neutral, OI stable.
Current price is close to the upper edge of the suggested range, short-term funds are still tentatively pushing higher.
🎯Direction: Long
⚡Entry/Order: 1.2904-1.2943
🛑Stop loss: 1.281357
🚀Target 1: 1.313714
🚀Target
SIREN52.4%
BTC4.12%
ETH7.89%
View Original
post-image
  • Reward
  • Comment
  • Repost
  • Share
$BTC #Bitcoin
Quietly Breaking?
Bitcoin is falling without a sound. The price trends lower, yet the volatility gauge has collapsed to the 15th percentile of its seven-year range. This is not calm. This is compression. A market holding its breath before a move that will likely catch everyone leaning the wrong way.
🔹 Volatility Suppression Hides the Pressure
Bitcoin's realized volatility sits in the basement of its historical distribution. Over the past seven years, only 15% of trading days have been this quiet while the trend pointed down. The last time this combination appeared, a 30% move f
BTC4.12%
post-image
post-image
User_any
$BTC
Short-term Bitcoin holders are bleeding on a scale that the market has only witnessed twice before since the cycle peak. On-chain data reveals that 95% of the supply held by short-term investors is now sitting in an unrealized loss. This is the third such capitulation event since Bitcoin touched $126,000. The last time this metric flashed, Bitcoin was carving out the floor of the brutal 2022 bear market.
🔹 The Capitulation Metric That Ends Bear Markets
Glassnode data shows the Short-Term Holder Supply in Loss ratio has surged to 95%. This means virtually every coin that moved in the last 155 days is underwater. Historically, readings above 90% have aligned with local price floors. In March 2020, the ratio spiked above 97% weeks before a historic rally. In November 2022, it hit 96% as FTX collapsed, marking the absolute bottom of that cycle. Weak hands are not just nervous — they are exhausted, and exhausted sellers typically signal the final phase of a flush.
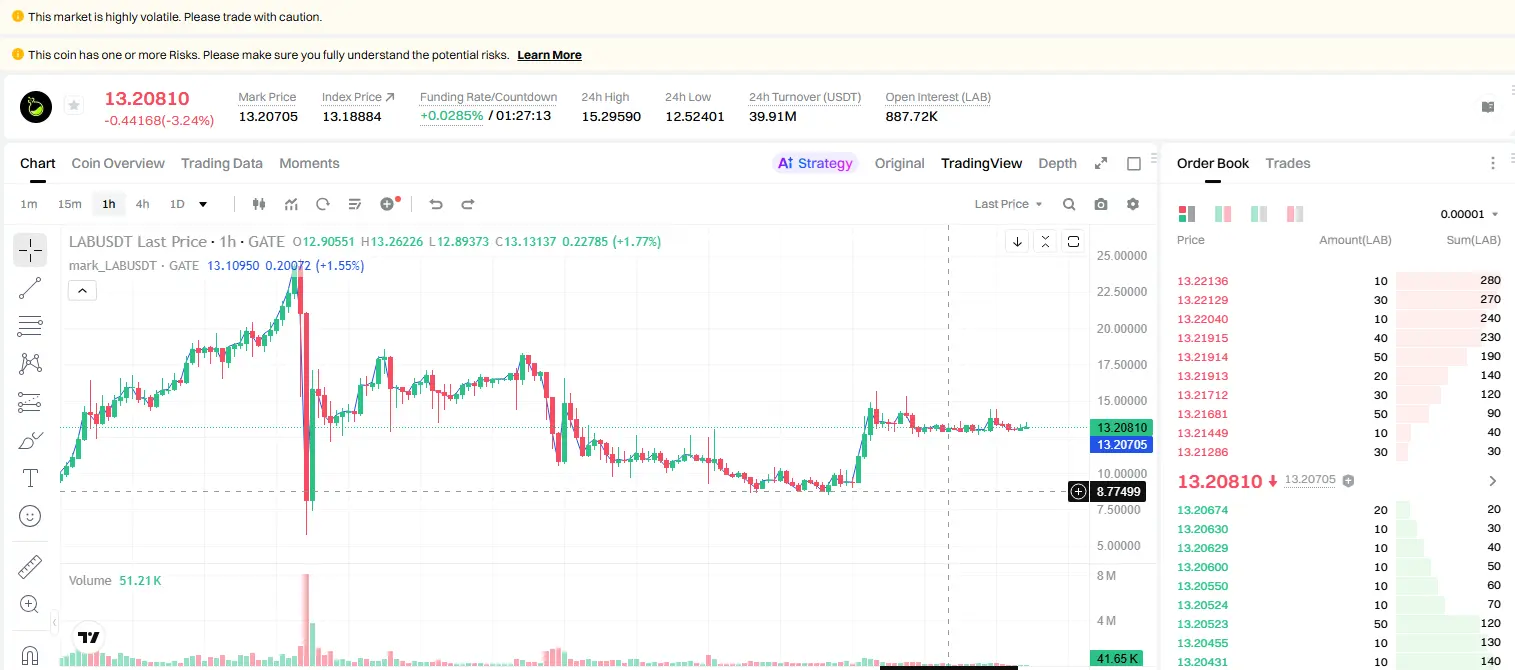
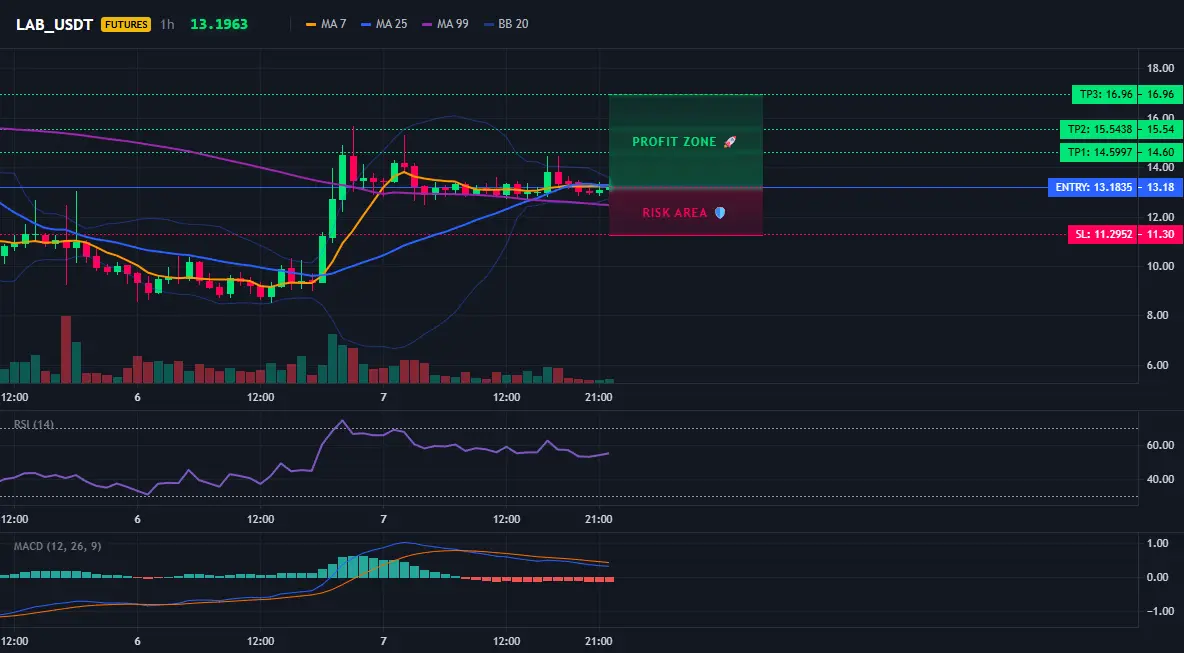
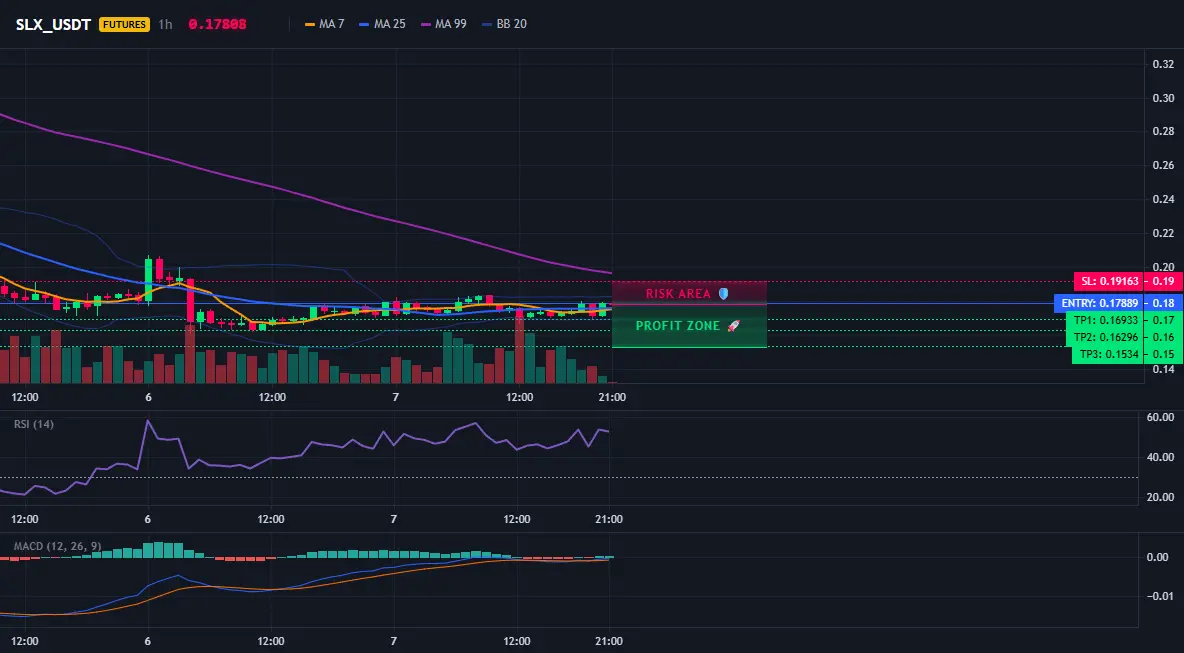
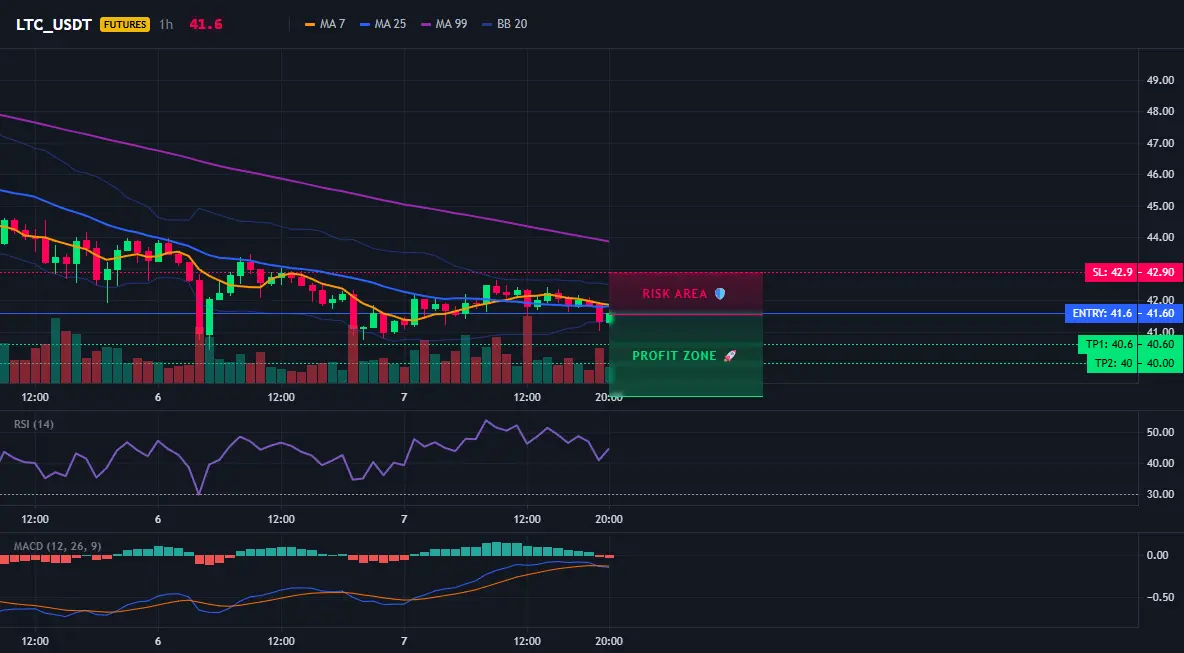
🔹 Price Drops 13.58% in a Week — RSI Implodes to 21
The daily RSI has crashed to 21.36, a depth rarely visited outside of black-swan events. The moving averages on the 4-hour and daily charts remain locked in bearish alignment, but the 15-minute chart is flashing early recovery signals with a bullish cross. Bollinger Bands have expanded sharply, confirming the volatility burst. Bitcoin bounced to $61,995 from a low of $60,433, but the weekend volume will determine whether this is a dead cat bounce or a genuine reversal.
🔹 BlackRock Leads a $400 Million Exodus
Institutional capital is running for the exit. BlackRock’s spot Bitcoin ETF recorded a single-day outflow exceeding $400 million in the past week. Strategy disclosed the sale of 32 BTC to meet operational needs, a symbolic move that rattled sentiment. ETF flows have turned persistently negative, and the Crypto Fear and Greed Index has collapsed to 12 — Extreme Fear. The last time the index printed a 12, Bitcoin was trading near $16,000 in late 2022.
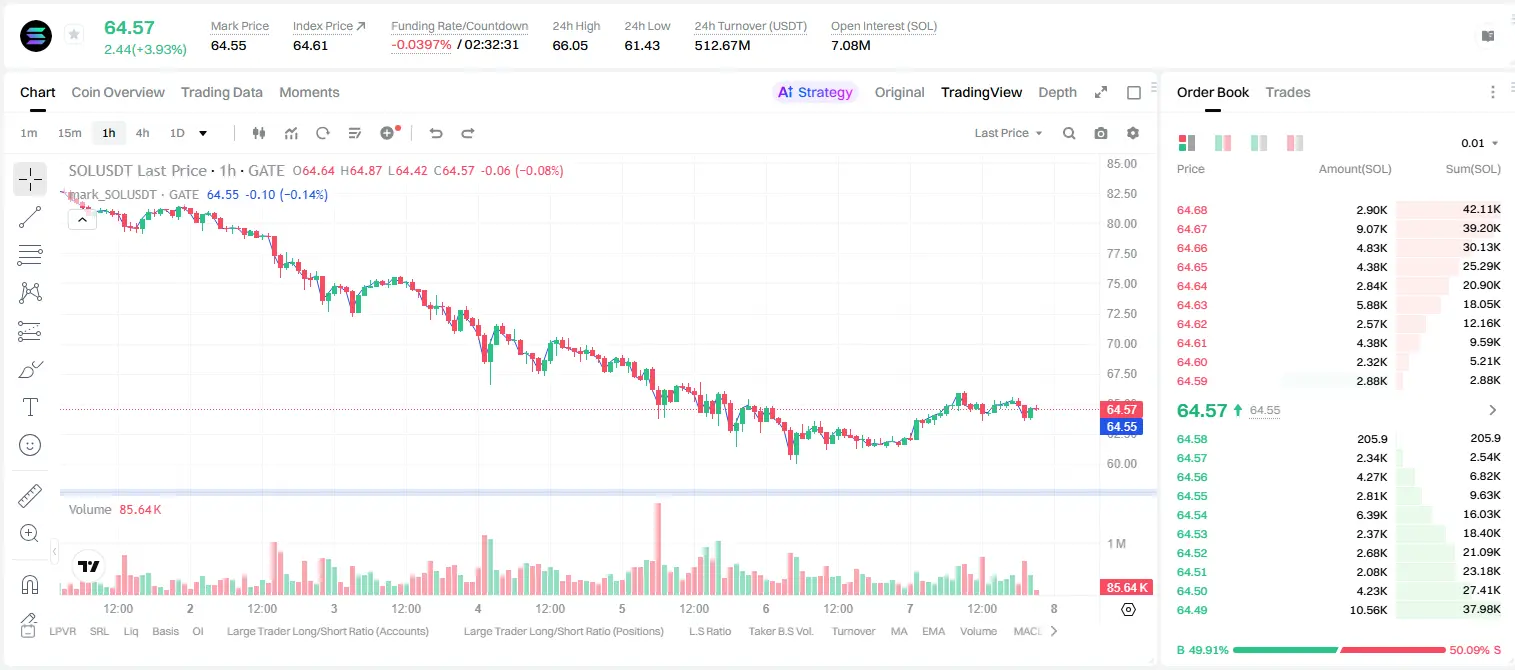
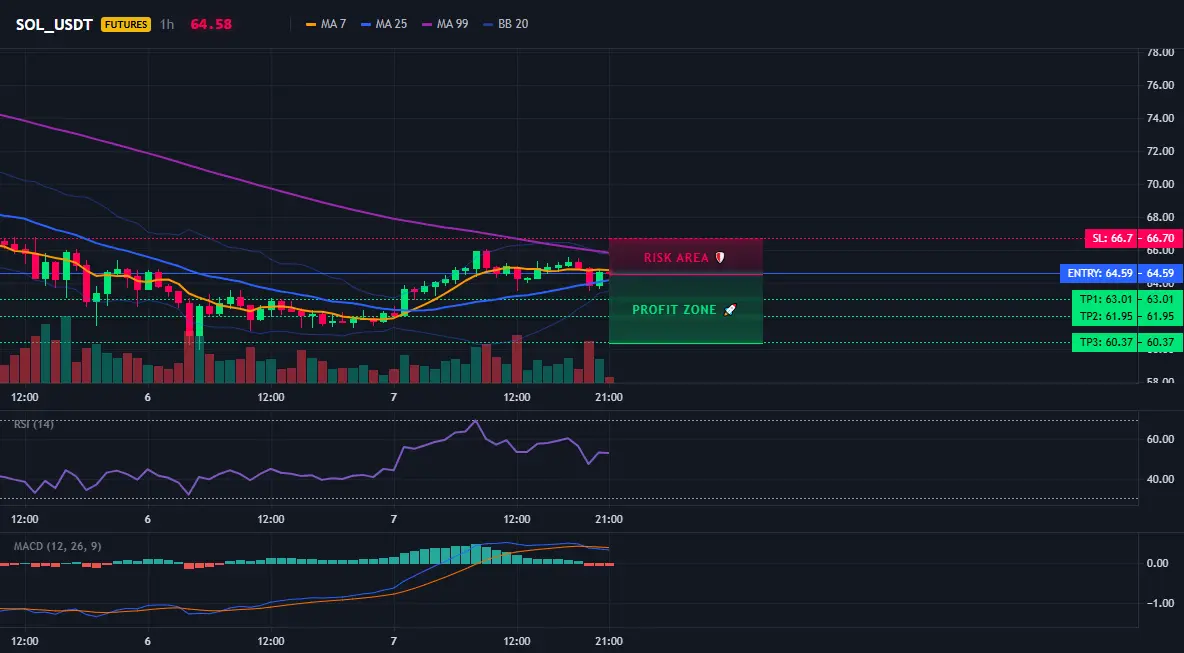
🔹 Volume Explodes as Panic Sellers Capitulate
Trading volume surged over four times the weekly average as Bitcoin plunged into the low $60,000s. This pattern — a massive volume spike on a steep decline — is a classic sign of seller exhaustion. Panic selling with heavy volume often burns out the remaining supply, creating a vacuum that buyers can exploit if macro conditions cooperate. For now, that cooperation is missing. Fed Chair Kevin Warsh remains hawkish, and rates are staying higher for longer.
The data is brutal, but brutal data has historically been a forward-looking indicator, not a tombstone. The market is stress-testing the conviction of every holder, and the weak hands are being shaken out one final time.
Friends, do you believe this 95% loss ratio marks the bottom or is there one more painful flush ahead?
⚠️ Not financial advice.
repost-content-media
  • Reward
  • 4
  • Repost
  • Share
M谋ngYueZen:
LFG 🔥
View More
$NIL This wave of short positions was perfectly captured!
From 0.05916 → 0.03787, this wave's profit reached +2708.09%.
I told everyone before: a volume-less hard pull is just a trap for more buyers, and the counter-short has a very high win rate. The market has now proven this.
📌 What should we do next?
1. Take profit on 80%, secure the gains first;
2. Hold the remaining 20% lightly, set the stop loss at the entry price to prevent profit reversal.
If you missed it, don't worry. The market is there every day. Wait for my next signal 🔔
$BTC $ETH
NIL1.95%
BTC4.19%
ETH7.95%
View Original
post-image
  • Reward
  • Comment
  • Repost
  • Share
Everyone’s ignoring $LAB /USDT—but the 4h chart just whispered a secret.

$LAB /USDT - LONG

Trade Plan:
Entry: 12.98676 – 13.38016
SL: 11.29517
TP1: 14.59967
TP2: 15.54382
TP3: 16.96003

Why this setup?
Why now? 95% confidence LONG with a 1D bullish trend. RSI (15m) at 50.76—neutral, not overheated. ATR (1h) at 0.79 shows volatility is alive. Entry zone: 12.99–13.38. TP2 at 15.54 is 18% away. The “Armed” status means the setup is live, not dead.

Debate:
Are you fading the crowd or front-running the breakout before TP2?
LAB-1.84%
post-image
post-image
  • Reward
  • Comment
  • Repost
  • Share
Load More