Share crypto content and earn up to 60% commissions through content mining.
placeholder
gatefun
Defending Champions Argentina—experience is the real trump card
After reaching the World Cup semifinals, many people began to worry that Argentina’s squad is too old, but the deeper into the tournament the more experience often matters than youth.
As defending champions, Argentina has major-tournament experience that the other three teams don’t. From the knockout stage onward, they have demonstrated an exceptionally strong ability to adapt to adversity against teams such as Cape Verde, Egypt, and Switzerland.
Although Messi is no longer young, his passing, playmaking, and ability to read t
View Original
post-image
post-image
  • Reward
  • Comment
  • Repost
  • Share
XAUT 4-hour divergence—who are the main players waiting for to make the first move?
$XAUT /USDT - Go LONG
Trading plan:
Entry: 4067.8 – 4071.4
SL: 4046.8
TP1: 4086.7
TP2: 4098.1
TP3: 4115.2
Why focus on this setup?
- Current price 4069.6, 15-minute RSI is only 39.77—an oversold bounce is about to trigger.
- While the daily chart is somewhat bearish, the 4-hour LONG signal (84% confidence) lines up with the 1-hour EMA support, with the entry zone at 4067.8-4071.4.
- Why now? RSI is low + ATR is just 7.3. After volatility compression, direction usually breaks out—TP1 is at 4086.7.
Discussion:
Wi
XAUT-0.69%
View Original
post-image
post-image
  • Reward
  • Comment
  • Repost
  • Share
Technical Outlook: ETH Reclaims the 20 EMA, but Key Resistance Still Caps the Recovery
Ethereum is showing signs of recovery after defending the $1,767–1,780 demand zone. Price has reclaimed the 20 EMA and is attempting to build momentum above short-term support, while the RSI has climbed above the neutral 50 level, reflecting improving bullish sentiment. However, ETH continues to trade below the 50 EMA, 100 EMA, and 200 EMA, meaning the higher-timeframe trend remains bearish despite the recent rebound.
📈 EMA Structure (Bullish Recovery Within a Bearish Trend)
20 EMA: $1,738.10
50 EMA: $1,800
ETH0.99%
post-image
post-image
  • Reward
  • 6
  • Repost
  • Share
ThisIsTranslateContent::
Get on board now! 🚗
View More
DOGE - 4 years later... such a waste of time
DOGE-0.05%
post-image
  • Reward
  • Comment
  • Repost
  • Share
This short position finally got filled and paid off. The moment $IDOL got pushed down from the high level was given very directly on the order book. A lot of people at the time were still watching for a rebound, thinking it could keep topping out, but what I really focused on was the speed of the pullback after it met resistance overhead—by then, it was already off.
My short entry was based on 0.024361. The current price is already at 0.015917, and the unrealized profit shows +678.28%. This move wasn’t about guessing. After repeated attempts to break higher from the high level failed, the acti
IDOL9.47%
BTC-0.34%
ETH0.91%
View Original
post-image
  • Reward
  • Comment
  • Repost
  • Share
Ethereum short is in
At the daily level, it has already reached the resistance position of the major consolidation range
The risk-reward ratio is especially favorable—going aggressive short is over$ETH
ETH0.91%
View Original
  • Reward
  • Comment
  • Repost
  • Share
Guys, who gets it! Once this drops, the chart directly gives the answer 📉🔥 A few days ago, before going to sleep, it was still dragging along—BTC tried to break up a few times but just couldn’t quite get there. I immediately felt something was off with this rebound: the volume didn’t keep up, and the overhead resistance was also obvious.
At that time, around 78135.9, what I was watching was a short opportunity. The core is one sentence: when it goes up, nobody takes it—so instead it gets increasingly weak 👀 Even before the chart fully started, the question was whether you would dare to foll
BTC-0.34%
ETH0.91%
SOL0.61%
View Original
post-image
  • Reward
  • Comment
  • Repost
  • Share
btc prediction
gate liveLIVE
1,573
  • Reward
  • Comment
  • Repost
  • Share
WLD Short Alert: 95% Win-Rate Signal Triggered
$WLD /USDT - SHORT to go short
Trading plan:
Entry: 0.4198 – 0.4238
SL: 0.4410
TP1: 0.4074
TP2: 0.3978
TP3: 0.3835
Why watch this structure?
- 4H timeframe: bearish control; 1D trend clearly bearish, with EMA lines aligned to the downside.
- RSI on 15m is only 48.61—weak bounce, not in the oversold zone, and downside room remains.
- Current price 0.4218, hovering right at the short entry zone. TP1 0.4074 (-3.4%), TP2 0.3978 (-5.7%), with SL at 0.4410 clearly defined.
- Why now? 1H ATR is only 0.007987; after volatility contraction, it often comes
WLD5.73%
View Original
post-image
post-image
  • Reward
  • Comment
  • Repost
  • Share
This pullback didn’t come out of nowhere—it wasn’t sudden enough to be truly surprising. What really caught my attention was that after consecutive pressure above, the rebound still never managed to show follow-through, and the market’s overall feel began to weaken.
My focus is on how price reacted around the entry price. $HOME probed lower all the way after 0.02591, and it’s now at 0.01421—the pace basically matches my earlier judgment.
In realizing this short position, +3204.09% wasn’t forced through by sheer emotion; it came from waiting for structure to give a response. During a selloff,
HOME-5.63%
BTC-0.34%
ETH0.91%
View Original
post-image
  • Reward
  • Comment
  • Repost
  • Share
Woke up and immediately felt sharp! 📉😎 This morning I opened the chart, and this drop in $OPEN finally got realized. Back when it bounced in the early-morning hours a few days ago, it looked pretty intimidating. But the reality was that buy support was clearly not strong enough—every time it tried to surge up, it felt like it ran out of breath.
I was watching around 0.1821. When I saw a low-volume surge and the heavy resistance overhead kept it pinned down hard, I reminded people not to get tricked into chasing that rebound. The short idea just felt more natural 👀📌 During the grinding in t
OPEN-2.17%
BTC-0.34%
ETH0.91%
View Original
post-image
  • Reward
  • Comment
  • Repost
  • Share
world cup prediction
gate liveLIVE
1,557
  • Reward
  • Comment
  • Repost
  • Share
CL/USDT 4H short trap or a real drop?

$CL /USDT - SHORT

Trading plan:
Entry: 73.45 – 73.67
SL: 74.63
TP1: 72.76
TP2: 72.23
TP3: 71.43

Why focus on this structure?
The current 4H cycle short signal has been activated. RSI on 15M is 43.34, not yet in the oversold zone. The key resistance is 73.56-73.67. If price breaks below 73.45, the short targets 72.76. The 1D trend is still range-bound, but the probability of a downside breakdown on 4H is slightly higher.

Discussion:
Will this short reach TP1 at 72.76 first, or is it a stop-out trap that bounces?
CL1.19%
View Original
post-image
post-image
  • Reward
  • Comment
  • Repost
  • Share
Don’t say—this move really gave face. During the intraday base-building, many people were still hesitating, and then $UB short positions directly broke out to lock in 📉🔥 from 0.21138 down to 0.07297, with a return rate of +1605.67%. This rhythm is so well controlled ✅

Looking back, the entry logic isn’t complicated. A few days ago, that spike at around midnight looked scary, but volume didn’t back it up—every time it surged, it just lacked that one breath. Once it went up, nobody was there to take it. I reminded people then not to get tricked into it by the superficial strength 👀🎯

Thi
UB8.81%
BTC-0.34%
ETH0.91%
View Original
post-image
  • Reward
  • Comment
  • Repost
  • Share
longing the 64.5k breakout
post-image
  • Reward
  • Comment
  • Repost
  • Share
#SKHynixADRIndicativePrice149
SK Hynix ADR Indicative Price Set at $149, A Major Milestone in the AI Semiconductor Industry
The global semiconductor industry continues to benefit from the rapid expansion of artificial intelligence, cloud computing, and high-performance data centers. One of the biggest recent developments is SK Hynix setting the indicative price of its American Depositary Receipts (ADRs) at $149 ahead of its Nasdaq debut. The offering attracted exceptional investor demand, highlighting growing confidence in companies that play a critical role in the AI supply chain. The ADR sa
SK Hynix-8.85%
SKHYV-0.98%
post-image
post-image
  • Reward
  • 1
  • Repost
  • Share
HighAmbition:
good information 👍👍👍👍👍
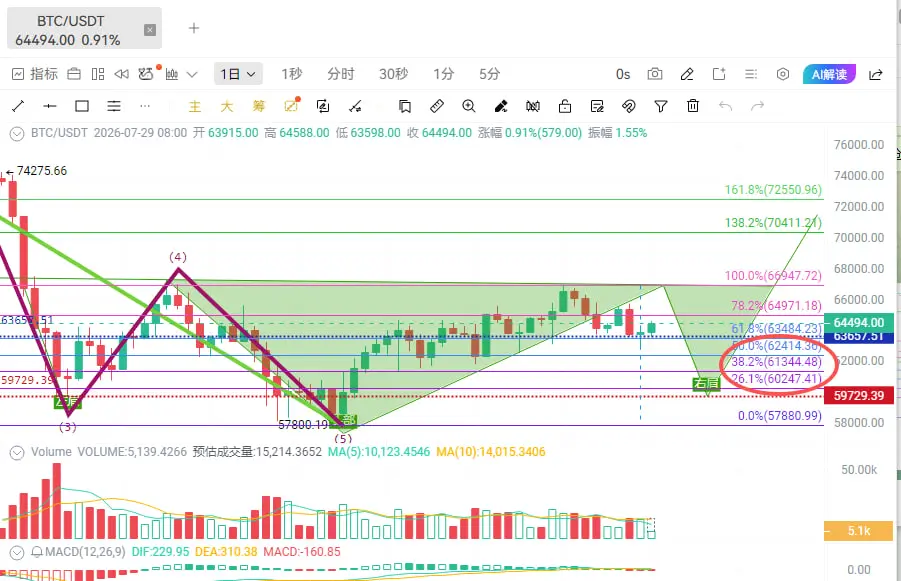
Last night’s market moved with a push higher followed by a quick pullback and rapid dip. At this stage, it has entered a weak rebound and a repair range. Although there has been a small uptick in the short term, overall it is still in the consolidation stage after a bearish market. There is strong pressure overhead, and bulls lack the substantive momentum needed to turn the situation around.
This rebound is a typical “pullback repair during a downtrend,” not a trend reversal. Combined with a large amount of trapped positioning stacked above, once the price reaches key resistance levels, it is
BTC-0.34%
View Original
post-image
  • Reward
  • 1
  • Repost
  • Share
YieldGardenKid:
The high-altitude idea is fine, but if the $64,300 pressure level is broken with a surge in volume, short positions need to be exited immediately—don’t stubbornly hold on.
$BILL Signal】Long + 1H Bollinger Upper Band breakout / deep imbalance correction
$BILL The 1H Bollinger Upper Band at 0.0529 was tested multiple times and then pulled back; the current price is 0.0496. The 4H Bollinger Bands have narrowed to 0.0327-0.0500. The MACD histogram has shrunk on both 1H and 4H; bullish momentum is fading, but the trend has not been broken. The order book buy ratio is 0.85. Deep imbalance -8.33% indicates that sell pressure is temporarily concentrated, while the funding rate 0.005% remains stable. Short-squeeze conditions are not met. Objectively assessing, the cu
BILL26.19%
LAB-19.83%
BTC-0.30%
ETH0.99%
SOL0.65%
View Original
post-image
  • Reward
  • Comment
  • Repost
  • Share
In the end, this position still gave the answer. $EWY looked pretty strong in the front, but I always felt that momentum didn’t feel quite natural—rising was lively, but the follow-through kept growing more hesitant. For a book like this, I generally won’t chase orders.
Back then, EWY hovered around 198.58. I didn’t rush in at first; I waited until the rebound weakened before going long. Honestly, I’d rather miss a bit than get on the bus and have my mindset blown up right away.
Later, it moved from 198.58 down to 182.46, and this short trade’s feedback came through—the profit showed +199.3%.
EWY-3.58%
BTC-0.34%
ETH0.91%
View Original
post-image
  • Reward
  • Comment
  • Repost
  • Share
Weekly candle close is complete.
Currently, the weekly candle has still not been able to break through 65,000.
Based on the weekly chart, it looks at the overall pattern of BTC/ETH.
Also, from the weekly MACD, the weekly bottom bullish divergence for BTC/ETH is valid.
Right now, it just depends on how long this rebound can last.
Currently, the resistance zone above BTC is between 65,000 and 70,500.
If this range breaks through, BTC can challenge the previous high and fully repair the weekly divergence.
Of course, there is another scenario: if the 65,000 to 70,500 range cannot be broken, then a
BTC-0.30%
ETH0.99%
View Original
post-image
  • Reward
  • Comment
  • Repost
  • Share
Load More

Join 40 M users in our growing community

⚡️ Join 40 M users in the crypto craze discussion
💬 Engage with your favorite top creators
👍 See what interests you
  • Pinned