Share crypto content and earn up to 60% commissions through content mining.
placeholder
gatefun
Yes, it blasted again??? Don’t panic—watch me find a way to bring the situation back👊 A few days ago, that afternoon $SKYAI bounced back—looked pretty strong, but the follow-through was weak. When it went up, there wasn’t anyone to catch it; every push higher was just missing one breath. I said right then: don’t let fake moves get you into the rhythm.

Good positions wait to appear, not chase as they run out.

I entered the short at 0.10974. Now the price has come to 0.03012, with profit up to +1779.13%📉🎉😎. This isn’t luck—it’s hitting the beat. Everyone on the bus should be laughing the
SKYAI-3.67%
BTC-0.05%
ETH1.99%
View Original
post-image
  • Reward
  • Comment
  • Repost
  • Share
Just a few days ago, it was still leisurely “fishing,” and suddenly it snapped into action—no time for you to react~👀📉

A few days ago, in the afternoon when everyone was still watching, I was staring at the $SUI rebound. The more I looked, the more something felt off: the pull was weak, the catch was weak, and when price got pressured from above it dropped back—too much “bait for longs” flavor. Back then, the prompt was to open longs; it wasn’t impulsive—it was because both the position and the timing lined up.

Now it’s pulled from 1.0776 down to 0.7575. The return rate of +1430.52% is
SUI-0.42%
BTC-0.05%
ETH1.99%
View Original
post-image
  • Reward
  • Comment
  • Repost
  • Share
This short finally carved out the space—$APT held on from the high and then quickly dropped; the price action looked very decisive. A lot of people were still watching for a rebound, thinking that as long as it didn’t break, it could grind back up. But what really caught my attention was that every time price probed higher, there was no sustained buy-side follow-through—push up and it gets shoved back down. Something is already off here.

I went long around 0.9197, not because I wanted to gamble on a big bearish candle, but because I saw APT’s structure start to loosen: the rebound strength
APT1.04%
BTC-0.05%
ETH1.99%
View Original
post-image
  • Reward
  • Comment
  • Repost
  • Share
I was still stalling a few days ago, but today I’ll just give the answer! When 🔥 was grinding up at the intraday top, $CTR looked like it wanted to surge higher, but nobody bought it once it moved up. The rebound was weak, and once the sell pressure eased, it became obvious—I was even more inclined to follow through with the short position closing/timing rhythm.
Rear-ending is easy to get hit. ⚠️
The short was entered at 0.02063. The current price is 0.00833. The return rate shows +1173.94%. This one wasn’t a wasted wait—once the market chooses a direction, the profit feedback is very straig
BTC-0.05%
ETH1.99%
View Original
post-image
  • Reward
  • Comment
  • Repost
  • Share
market update
gate liveLIVE
17
  • Reward
  • Comment
  • Repost
  • Share
The harshest part of this move isn’t that it dropped fast—it’s that it grinds down everyone who was hesitant first. $SHIB It had been consolidating at the high for a long time. A lot of people watched it not falling and wanted to chase more, but what I was watching then was that the rebounds kept getting shorter, the upward push kept getting more hollow, and the sell orders near the resistance level never really moved.
The key is right here: the chart didn’t suddenly weaken—it had already shown signs of fatigue early on. When SHIB was around 0.000005663, I followed the short-side rhythm and o
SHIB0.62%
BTC-0.05%
ETH1.99%
View Original
post-image
  • Reward
  • Comment
  • Repost
  • Share
I was already ready to shut down the software, but you went and pulled this on me: 😂
A few days ago, the last look before sleep—$XNO was still grinding at a high level. On the surface it looked like it was going to keep pushing higher, but in reality every time it tried to surge, it just lacked one breath; the follow-through was clearly insufficient. So I went long around 0.4404 as planned—no need to be showy, just focusing on the location.
This morning I opened the chart—price was already at 0.3245. This round of shorts paid out really comfortably; the ROI shows +258.31%. The earlier hesitat
XNO0.93%
BTC-0.05%
ETH1.99%
View Original
post-image
  • Reward
  • Comment
  • Repost
  • Share
Many people were still waiting for $IN to bounce back and repair, but the market first gave the answer with a selloff. The importance of this level is that the heavy pressure from the highs hasn’t been just one or two days—after repeated attempts fail to break through, the structure has clearly changed.

At the time, I was watching the consolidation around 0.09609. On the surface, there still seemed to be buy orders, but in reality, every rebound was pushed back down, indicating that the sell pressure above hadn’t eased. The real turning point came after it broke below a small key level—hesit
IN1.65%
BTC-0.05%
ETH1.99%
View Original
post-image
  • Reward
  • Comment
  • Repost
  • Share
$SOL
A genius community
A genius team
You’re one of them
Fast today
Faster tomorrow
Little Nezha, check this out quickly
SOL-0.19%
View Original
post-image
post-image
post-image
EGY
EGYEgypt
MC:$304.28KHolders:1198
100.00%
  • Reward
  • Comment
  • Repost
  • Share
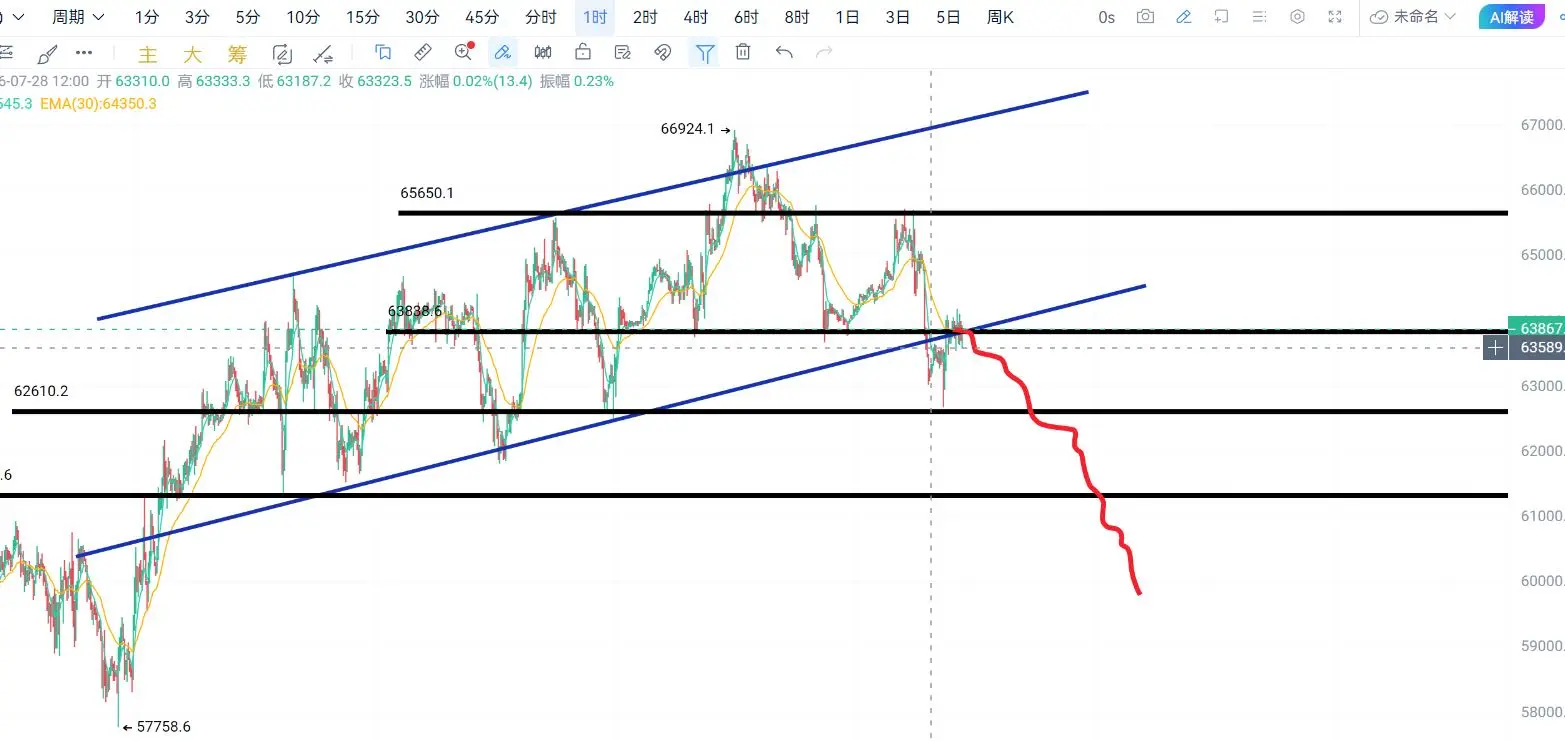
$BTC The Blue Rising Wedge Target Is Near!?
The downside move from the rising wedge should have been expected.
Especially since the U bottom or Eve bottom had not had it local double bottom.
Now we want to see price action get back above the yellow 1min 200MA.
Could be getting close...
Hitting these squeezes are a bit tricky but with practice its just another trade.
NFA, DYOR ⚠️
#Crypto #Trading #BTC
BTC-0.04%
post-image
  • Reward
  • Comment
  • Repost
  • Share
What are we aiming for? Isn’t it just this momentum of “pumping up and then dumping down”?! 📢😎
A few days ago, when I was watching the chart at dawn, that breakout was shaky—price pushed up, but the orders to take over didn’t follow through. It was clearly a lack of rebound strength. I saw that the overhead resistance was still there, so I signaled to open a long. Don’t join the excitement at a spot like this—just grab the take-profit.
From 0.8948 to 0.6764, the return is directly +1181.88%. This short wasn’t a waste of patience—the execution was decisive 🔥💰
Some money isn’t made by impuls
BTC-0.05%
ETH1.99%
View Original
post-image
  • Reward
  • Comment
  • Repost
  • Share
JUST IN: U.S. government transfers 19.615M USDT seized from Gotbit to Coinbase Prime, fully emptying the wallet. Implication: potential signal on asset custody/liquidity flows post-seizure. $USDT
COIN3.53%
post-image
  • Reward
  • Comment
  • Repost
  • Share
The $TA I was watching finally gave an answer. The long positions started from 0.06176, and the price has now been pushed to 0.07353—ROE is already showing +474.42%. This move isn’t a small fluctuation; it’s the real rhythm getting played out.

In the morning, many still thought the rebound lacked momentum, but the order-book details have already changed. The pullback isn’t deep, sell pressure is small, and at key levels the bids keep getting absorbed again and again. With these factors stacked together, I knew you can’t keep viewing this from a weak-minded perspective anymore.

Now the pos
TA-1.95%
BTC-0.05%
ETH1.99%
View Original
post-image
  • Reward
  • Comment
  • Repost
  • Share
$LAB Preparing to go short. This move feels like it has touched the ceiling—there’s clear sell pressure above, and sellers could potentially smash it back to the bottom at any moment.
You can watch the 0.2332 to 0.239 range to find an entry. For downside targets, first look at 0.223, then 0.213; the defense level is at 0.249.
But be mindful of the risk: before it drops, it may quickly wick up above 0.236 and sweep liquidity. Don’t go all-in—manage your position size based on your account and then play.
LAB-17.53%
View Original
post-image
  • Reward
  • Comment
  • Repost
  • Share
It looks like just a normal pullback, but the intraday details are actually quite clear—each rebound has less and less strength, and every time the price pushes up, it gets pushed back down.

My judgment isn’t based on a single candle line; instead, I look to see whether $SOXL continues to hold at key levels. This time, it started recording from around 226.10. To the current price of 163.24, the feedback the chart gives is pretty straightforward, and the characteristics of continued weakness are becoming more and more obvious.

Return of +547.5%—this one is more the result of patience. In a
SOXL-8.53%
BTC-0.05%
ETH1.99%
View Original
post-image
  • Reward
  • Comment
  • Repost
  • Share
After the follow-up results after 7.16 are posted, please help everyone follow and comment a lot—thank you, all you genius traders!
View Original
post-image
post-image
post-image
  • Reward
  • 2
  • Repost
  • Share
VaultKeeper:
Followed. I’ll wait for the next update.
View More
WORLD CUP PREDICTION
gate liveLIVE
1,523
  • Reward
  • Comment
  • Repost
  • Share
Haven't watched the game but apparently it's not coming home
My British friends my heart is with you, I shall consume a pint in your name, where ever you are
post-image
  • Reward
  • Comment
  • Repost
  • Share
This drop just basically punctured the illusion of stubbornly holding up at the prior high. When $MAV gave short opportunities around 0.01362, I wasn’t watching to see whether it could still pump—I was watching whether there was sustained buying once it went up. Now it’s at 0.0094, with a return of +1485.04%, and the move is clearly extending.
I’ve already been watching this area before. Repeated tests of the resistance above never managed to chew through it, and the rally didn’t come with any real volume. The longer the chart grinds, the more unstable it looks. A lot of people think ranging
MAV0.21%
BTC-0.05%
ETH1.99%
View Original
post-image
  • Reward
  • Comment
  • Repost
  • Share
2026.07.16 BTC/USDT Intraday Buy/Sell Levels
Current spot reference price: 64750 USDT
I. Long support zones (buy the dip)
1. Short-term shallow support: 64200-64400
Entry: pull back, find support, then go long; stop loss 63900; first target 65200, second target 65800
2. Solid strong support: 63400-63600
Entry: deeper pullback, buy in batches; stop loss 63000; targets 64800/65500
3. Trend watershed support: 62550. If it breaks down effectively, the short-term long structure is damaged
II. Short pressure zones (sell on rebounds from high points)
1. First short-term resistance: 65400-65600
BTC-0.04%
View Original
post-image
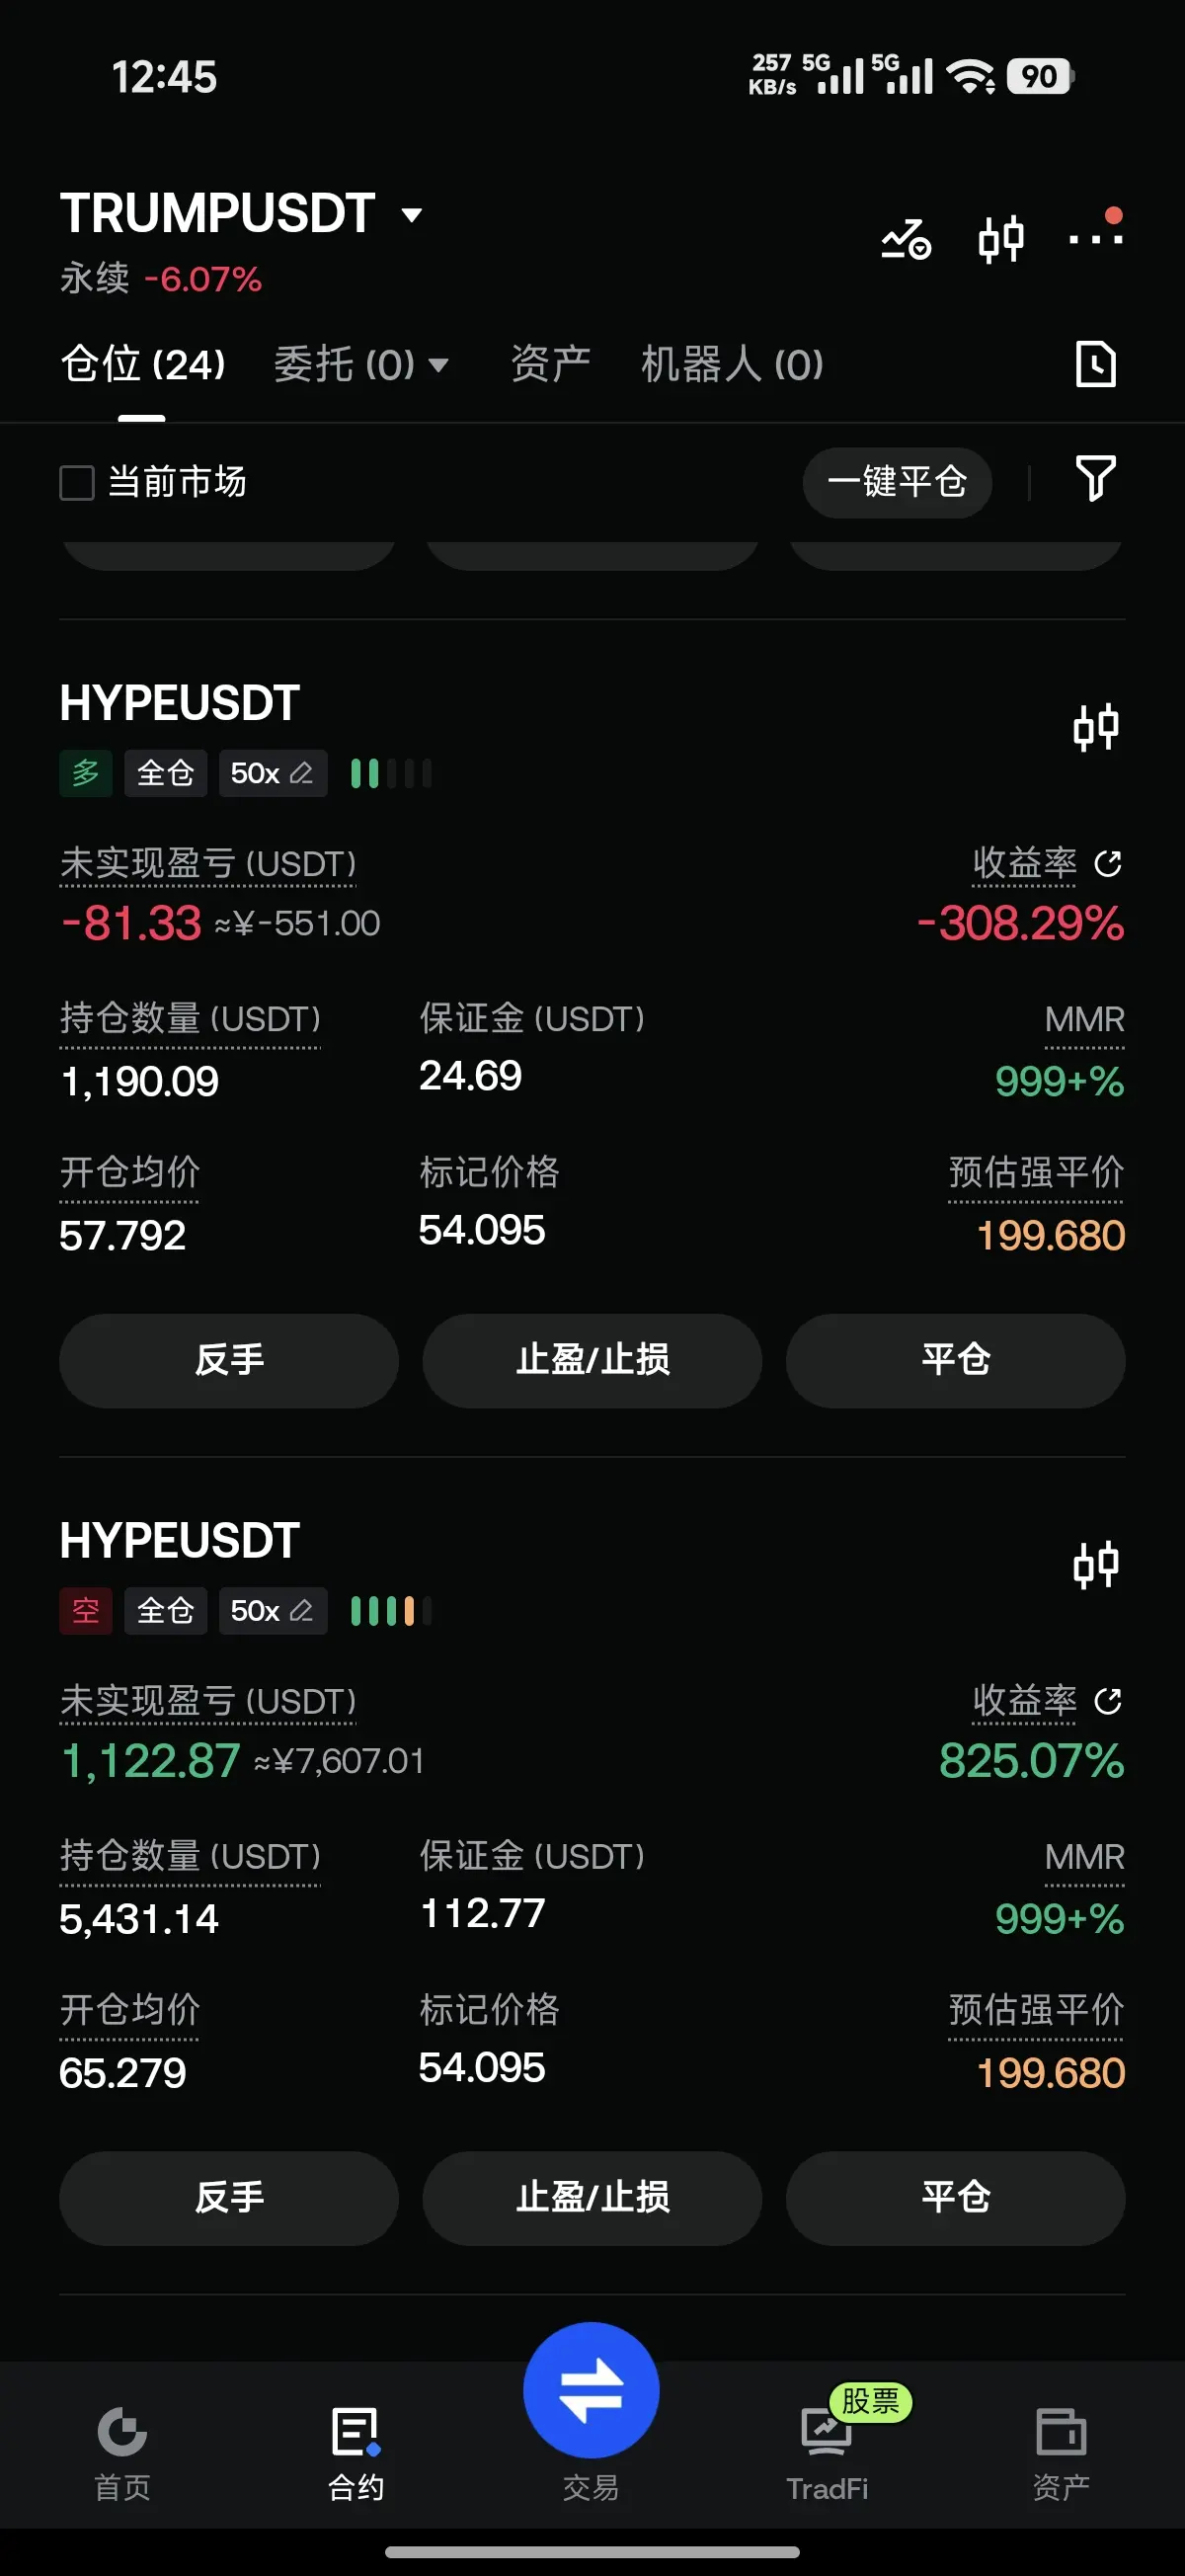
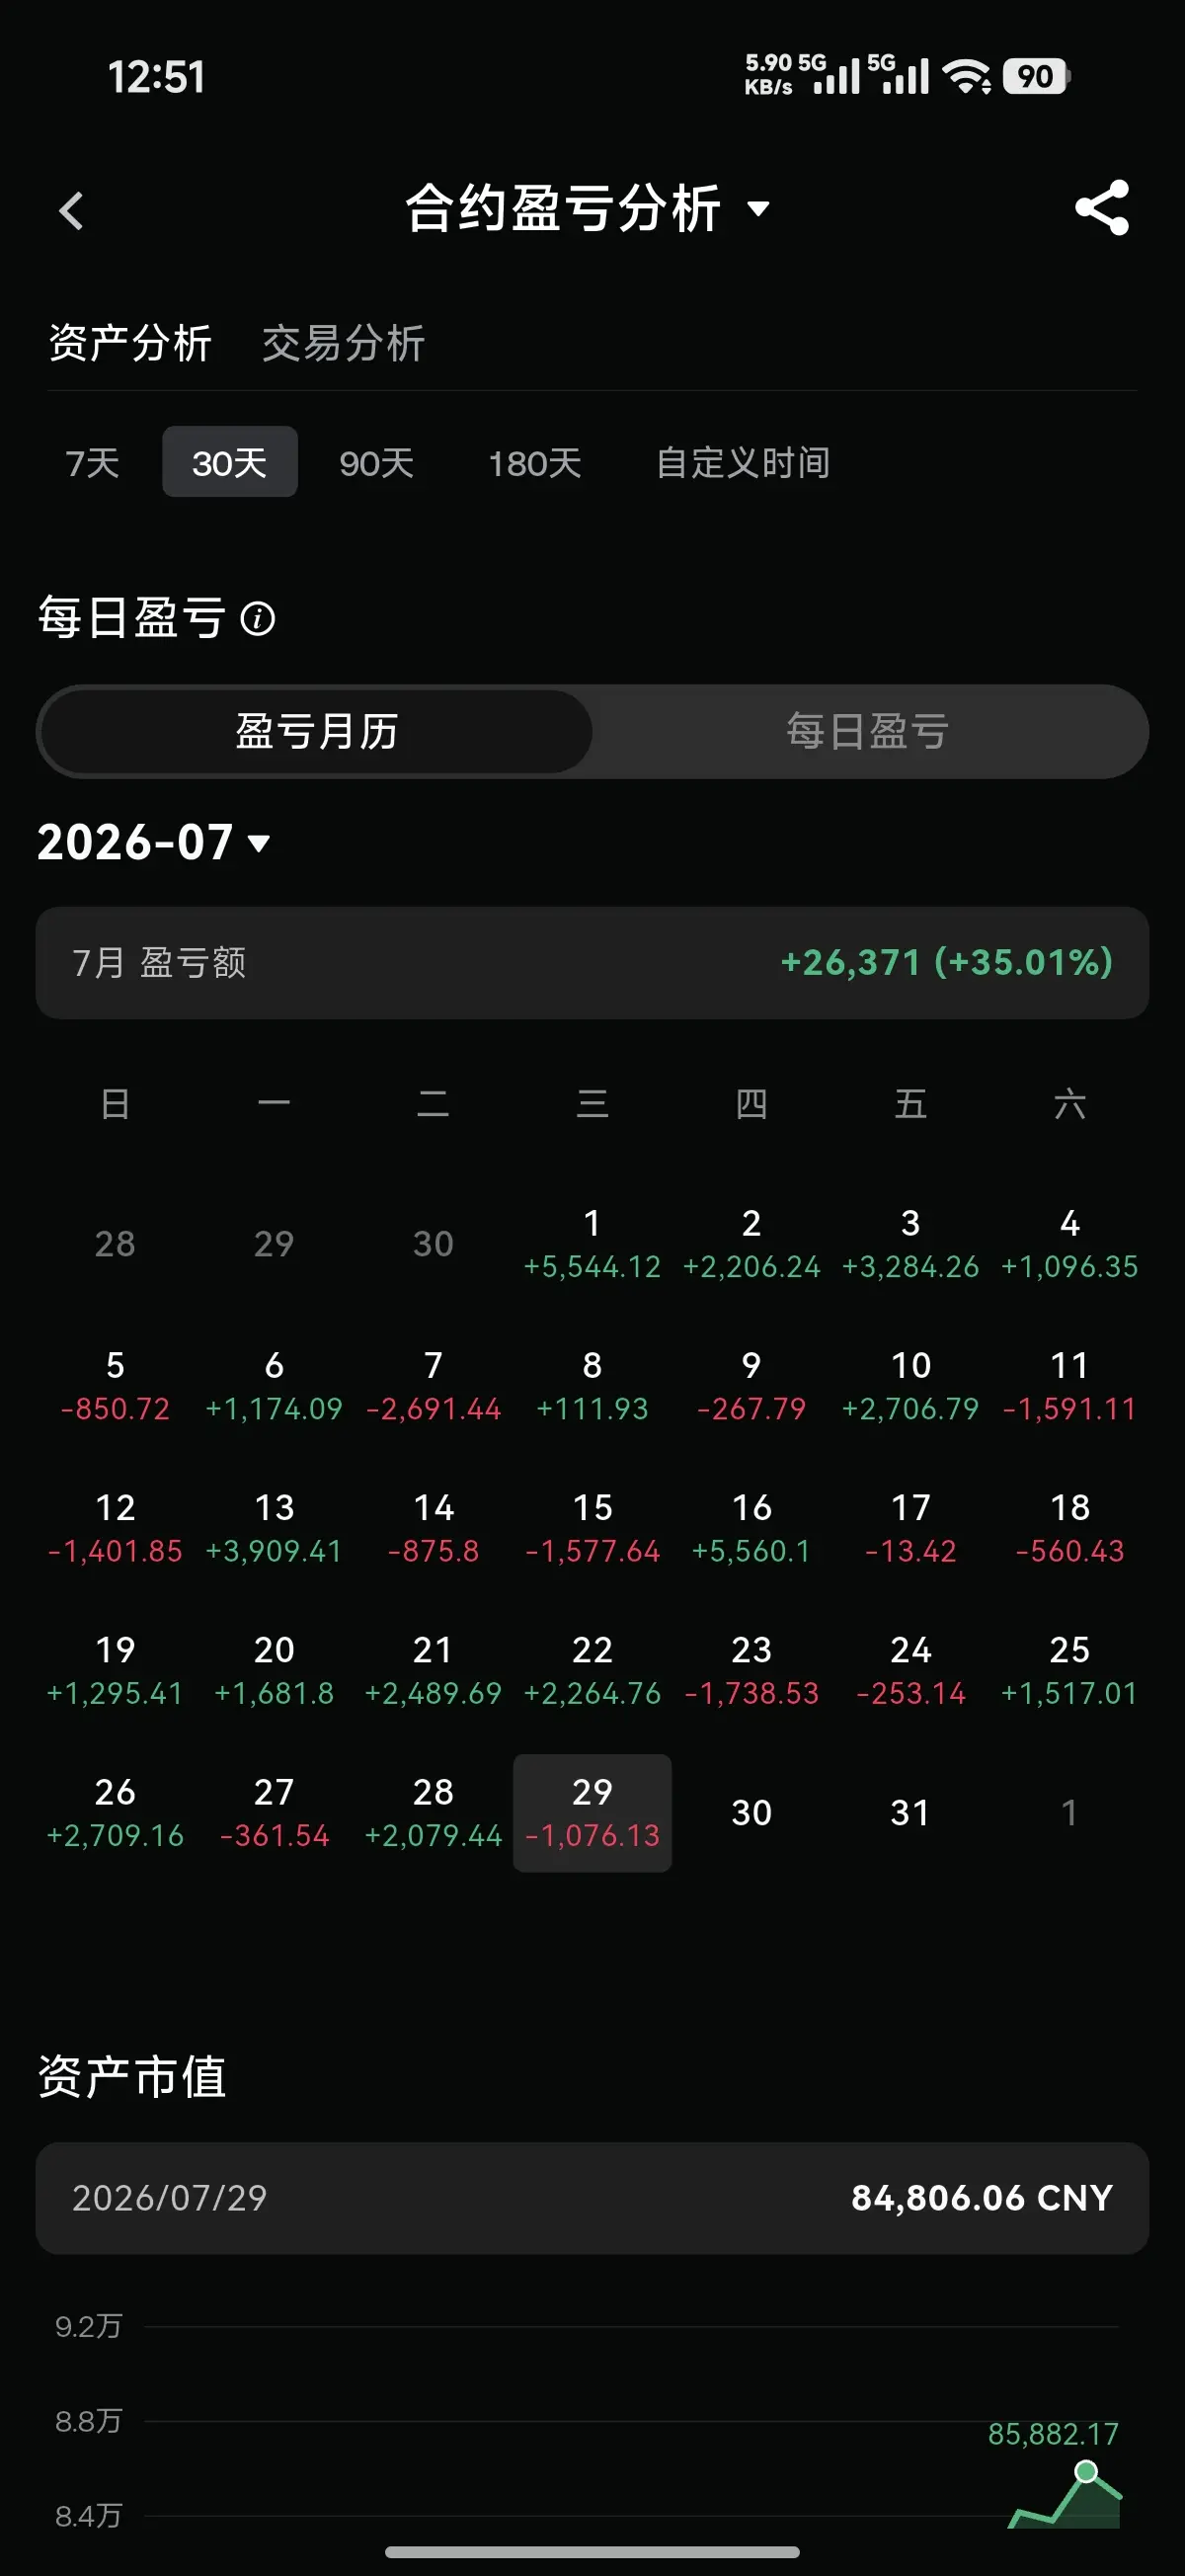
[The user has shared his/her trading data. Go to the App to view more.]
  • Reward
  • Comment
  • Repost
  • Share
Load More

Join 40 M users in our growing community

⚡️ Join 40 M users in the crypto craze discussion
💬 Engage with your favorite top creators
👍 See what interests you
  • Pinned