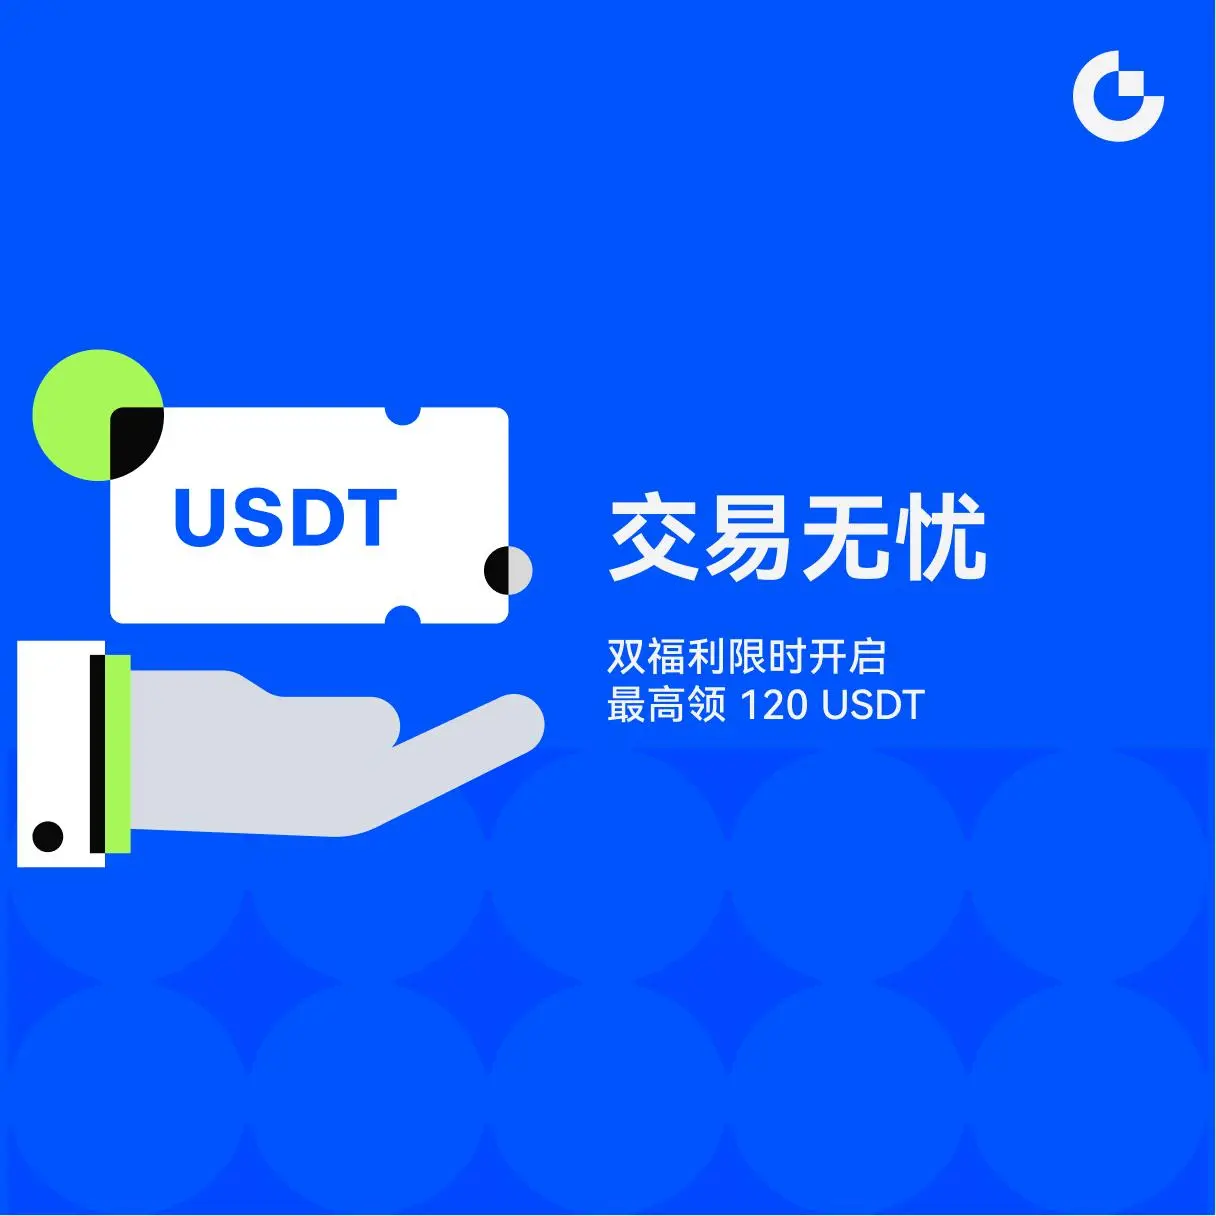
Share crypto content and earn up to 60% commissions through content mining.
placeholder
gatefun
#ShareYourUSStocksWinNvidia

🚀 NVIDIA: The AI King Still Controls the Battlefield
Most investors focus on headlines.
Professional traders focus on positioning.
That is why NVIDIA remains one of the most important stocks to watch in today's market.
While many semiconductor names recently experienced heavy volatility, NVIDIA continues to dominate the AI infrastructure race through its unmatched ecosystem, data center leadership, and growing enterprise adoption.
📊 Technical Structure Analysis
Current Market Character:
✅ Long-term uptrend remains intact
✅ Institutional demand remains visible
post-image
post-image
post-image
post-image
  • Reward
  • 1
  • Repost
  • Share
FenerliBaba:
LFG 🔥
Most traders are ignoring the hidden SHORT signal on $CL /USDT right now.

$CL /USDT - SHORT

Trade Plan:
Entry: 92.35 – 92.81
SL: 94.80
TP1: 90.91
TP2: 89.80
TP3: 88.13

Why this setup?
4H timeframe bias is SHORT (55% confidence). 1D trend is range-bound, but 1H price is rejecting at 92.58 with 1H ATR of 0.93—tight squeeze. RSI 15M at 51.08 is neutral, not overbought, giving room to drop. Entry zone: 92.35–92.81. Targets: 90.91 (TP1) then 89.80 (TP2). SL at 94.80 caps risk.

Debate:
Is the 92.58 rejection a fakeout trap or the start of a move to 89.80?
CL1.62%
post-image
post-image
  • Reward
  • Comment
  • Repost
  • Share
This morning, there was a strong upward surge, quickly rising from around 61,500 to a high near 64,250, then facing resistance and pulling back, currently oscillating around 62,950. In the short term, there is obvious selling pressure at high levels, and the bullish momentum has weakened after the surge, indicating a phase of pullback confirmation after the rally.
Currently, it is still declining after the rebound, and remains near the key support level after the breakout. Short-term resistance above is clear, and the sustainability of the rebound is doubtful. If it cannot re-establish above t
BTC2.85%
ETH6.04%
View Original
post-image
  • Reward
  • Comment
  • Repost
  • Share
New Market Update 🌹🌹
gate liveLIVE
896
  • Reward
  • Comment
  • Repost
  • Share
$SIREN Signal】Long position, 1H high-level consolidation and buildup, capital deep support
$SIREN RSI on 4H skyrocketed to 82.71, clear buy-side gap. 1H MACD histogram turned negative, price sideways consolidating without breaking EMA20. The order book depth is highly asymmetric, Bid/Ask depth ratio of 4.67, large orders fully exposing the support intent. Open interest remains stable, fee rate at 0.0698% not overheated, no large-scale short entry. Currently, around 1.30, bulls and bears are tugging, active buy orders continuously digest selling pressure.
🎯Direction: long
⚡Entry/Order: 1.29
SIREN49.66%
BTC2.85%
ETH6.04%
View Original
post-image
  • Reward
  • Comment
  • Repost
  • Share
Most traders think ZEC is coiling for a breakout—they’re about to get wrecked.

$ZEC /USDT - SHORT

Trade Plan:
Entry: 423.92 – 431.44
SL: 463.81
TP1: 400.59
TP2: 382.52
TP3: 355.43

Why this setup?
Why now? 4h bias is SHORT with 55% confidence, RSI on 15m sits at 47.77—no momentum. Price is stuck in a 1D range, but ATR on 1h is tight at 15.05, signaling a squeeze. Entry at 427.68 targets TP1 at 400.59, a 6.3% drop. The range isn’t support—it’s a trap before a breakdown.

Debate:
Are we fading 427.68 to 400 or is this a fakeout to 454?
ZEC13.48%
post-image
post-image
  • Reward
  • Comment
  • Repost
  • Share
GM fam — wake up, grab the phone, squint at Gate to see green or red. Same energy?
post-image
  • Reward
  • 9
  • Repost
  • Share
HighAmbition:
good morning 🌄
View More
Based on Dow Theory, Chan Theory, Elliott Wave Theory, volume-price relationship, order flow, and price action analysis of BTC short-term trends
$BTC ‌1. Dow Theory (Dow Theory)
Main trend (1-hour level): The mid-term downtrend from the high point of 82,448 on May 10 is experiencing a critical turning point. After panic sell-off to 59,095 on June 5, the market consolidated at a low in the entire day of June 6 (range 60,500–61,500), then rebounded strongly on June 7. The early session opened at 60,855 and steadily climbed, with volume breaking through 61,277 at 01:00, breaking 61,628 at 03:15,
BTC2.85%
View Original
post-image
post-image
  • Reward
  • Comment
  • Repost
  • Share
Brothers, 👀 $BASED This coin, I was already calling for a buy around 0.05933! I warned about this trade in advance, entry price was 0.05933, now it has reached 0.06955, with a profit and loss percentage of +830.15%. Now it’s directly surging to 0.06955, friends who followed along have all made gains! This position can probably be taken profit now, don’t be greedy for that last bit of profit, trading isn’t about catching the tail or the head, securing your profits is the way to go! The reason I dared to go long at that time was because after grinding sideways for a while, it started to push u
BASED2.95%
BTC2.85%
ETH6.01%
View Original
post-image
  • Reward
  • Comment
  • Repost
  • Share
$BAN Signal: Bullish breakout continuation, 1H momentum not exhausted
$BAN RSI 1H reaches 78.97, MACD histogram continues to expand, 4H Bollinger upper band at 0.0811 forms a resistance zone.
Buy depth ratio is 1.01, funding rate is only 0.005%, no selling pressure has accumulated.
🎯Direction: Bullish
⚡Entry/Order: 0.0763004 - 0.0765300
🛑Stop loss: 0.0757647
🚀Target 1: 0.0776779
🚀Target 2: 0.0782519
🛡️Trade management:
- Execution strategy: After reaching Target 1, reduce position by 50%, and move stop loss to break-even.
If the price falls back into the entry zone, au
BAN20.89%
BTC2.85%
ETH6.04%
View Original
post-image
  • Reward
  • Comment
  • Repost
  • Share
$XLM | 1h | Range Reversal Long
Bias: Long
Entry Zone: 0.2018 to 0.2032
Stop Loss: 0.1988
Targets:
TP1: 0.2066
TP2: 0.2098
TP3: 0.2142
Invalidation:
Close below 0.1988
Why This Setup:
I’m treating this as a mean-reversion long from the current range support after a sharp selloff and a controlled bounce. I want confirmation that price holds above the 0.2020 area and starts reclaiming the mid-range before pushing back into the recent swing highs.
#GateSquareMayTradingShare
XLM-4.72%
post-image
  • Reward
  • Comment
  • Repost
  • Share
#比特币回升5%
Dear HODL family, ten years of HODLing, 3,650 days
$BTC $XAUUSD ‌Today marks the 89th day of clocking in. Bitcoin has fallen to 59,100, and Ethereum dropped below 1,539 to refresh lows, followed by a short-term rebound in the market.

This rebound is mainly due to short sellers closing their positions, combined with technical indicators showing severe oversold conditions and a recovery trend. Institutional funds have not flowed back, and the core negative news has not eased, so the market remains in a downtrend.

The entire market has experienced heavy declines this week, but th
BTC2.85%
XAUUSD-0.45%
View Original
post-image
post-image
  • Reward
  • Comment
  • Repost
  • Share
#ShareYourUSStocksWinNvidia
Apple remains one of the most powerful and influential companies in the global financial market. Over the years the company has built a business model that combines technology innovation, premium branding, customer loyalty, and long term ecosystem growth. While many technology companies focus only on hardware sales, Apple successfully created an interconnected ecosystem that keeps users engaged across multiple devices and digital services. This strategy has allowed the company to maintain strong market value and investor confidence even during periods of economic u
post-image
post-image
post-image
post-image
  • Reward
  • Comment
  • Repost
  • Share
ETH Intraday Trading
Buy long at 1660-1645
Take profit: above 1700 Stop loss: 1625
BTC Intraday Trading
Buy long at 62700-62300
Take profit: 63800 Stop loss: 61700
SOL Intraday Trading
Short at 67-68 Stop loss: 69 Take profit: 62-64
Gold Intraday Trading
Short in the 4400-4420 range
Take profit: 4330 Stop loss: 4450
Live trading in the real account, welcome to verify together.
ETH6.04%
BTC2.85%
SOL4.62%
GLDX-2.45%
View Original
post-image
[The user has shared his/her trading data. Go to the App to view more.]
  • Reward
  • Comment
  • Repost
  • Share
$ID | 1h | Pullback Long
Bias: Long
Entry Zone: 0.02540 to 0.02575
Stop Loss: 0.02485
Targets:
TP1: 0.02620
TP2: 0.02685
TP3: 0.02760
Invalidation:
Close below 0.02485
Why This Setup:
I’m watching a 1h base after a sharp selloff, with price holding above the recent reclaim zone around 0.0255. I want a continuation push if buyers defend this higher low and retest the 0.0260 to 0.0263 liquidity area.
#GateSquareMayTradingShare
ID1.26%
post-image
  • Reward
  • Comment
  • Repost
  • Share
Most traders are still buying DOGE—but the 4H chart just screamed something they’re ignoring.

$DOGE /USDT - SHORT

Trade Plan:
Entry: 0.08544 – 0.08600
SL: 0.08845
TP1: 0.08368
TP2: 0.08231
TP3: 0.08027

Why this setup?
• 95% confidence SHORT signal on DOGE with 1D trend still bearish.
• RSI on 15m sits at 53.8—neutral, but no bullish momentum to flip the 4H.
• Entry at 0.08572 with tight SL at 0.08845; TP1 at 0.08368 is only -2.4% away.
• Why now? The 4H bias is confirmed, and ATR shows low volatility—breakdown likely imminent.

Debate:
Are you shorting DOGE here, or waiting for a
DOGE3.06%
post-image
post-image
  • Reward
  • Comment
  • Repost
  • Share
#ShareYourUSStocksWinNvidia
The global race for Artificial Intelligence leadership is becoming increasingly competitive. Countries, corporations, universities, and startups are investing billions of dollars to secure advantages in AI research and development. This competition is creating unprecedented demand for advanced computing infrastructure.
NVIDIA occupies a strategic position within this environment. The company supplies technologies that support AI training, machine learning deployment, scientific simulations, cloud services, and advanced analytics.
One important trend often overlooke
post-image
post-image
  • Reward
  • Comment
  • Repost
  • Share
$SOL Signal】Long + 4H Bullish Continuation, 1H Pullback for Low Buy
RSI 1H reports 60.7, 4H MACD histogram still expanding. Selling pressure is slightly dominant (Bid/Ask Ratio 0.93), but there is dense order accumulation below, with strong support in the 65.96-66.16 range. Negative fee rate of -0.023% combined with sideways price movement suggests short-term short squeeze potential. Stop loss is only 0.7% from entry, with a risk-reward ratio of about 1:1.5, making it feasible among popular coins.
🎯 Direction: Long
⚡ Entry/Order: 65.9615 - 66.1600
🛑 Stop Loss: 65.4984
🚀 Target 1: 67.1524
SOL4.51%
BTC2.85%
ETH6.04%
View Original
post-image
  • Reward
  • Comment
  • Repost
  • Share
Why XLM is about to get crushed when everyone expects a breakout.

$XLM /USDT - SHORT

Trade Plan:
Entry: 0.2016 – 0.2038
SL: 0.2134
TP1: 0.1947
TP2: 0.1894
TP3: 0.1814

Why this setup?
4h timeframe just armed a SHORT signal with 55% confidence. RSI on 15m sits at 44.51—still room to drop. Entry zone at 0.2027 with TP1 at 0.1947. Daily trend is range, not bullish. The real move is down before up.

Debate:
Is this a fakeout trap or the start of a 5% slide to TP1?
XLM-4.72%
post-image
post-image
  • Reward
  • Comment
  • Repost
  • Share
Do you want to know where the bottom zone of #BTC is?
Do you want to know which #tokens could grow several times / dozens of times / hundreds of times?
If you want to, then dream a beautiful dream.
One day you’ll see my post
You’ll understand!
Wishing you peace and happiness.
Wishing you joy.
Wishing you plenty.
Sending hearts...pang...pang
Warning: this is a personal opinion, not financial advice. I do not encourage any individual or organization to invest.
Be cautious with your decisions in the market.
You can ask yourself questions by clicking the link I pinned on my p
BTC2.85%
TOKEN1.43%
View Original
post-image
  • Reward
  • Comment
  • Repost
  • Share
Load More