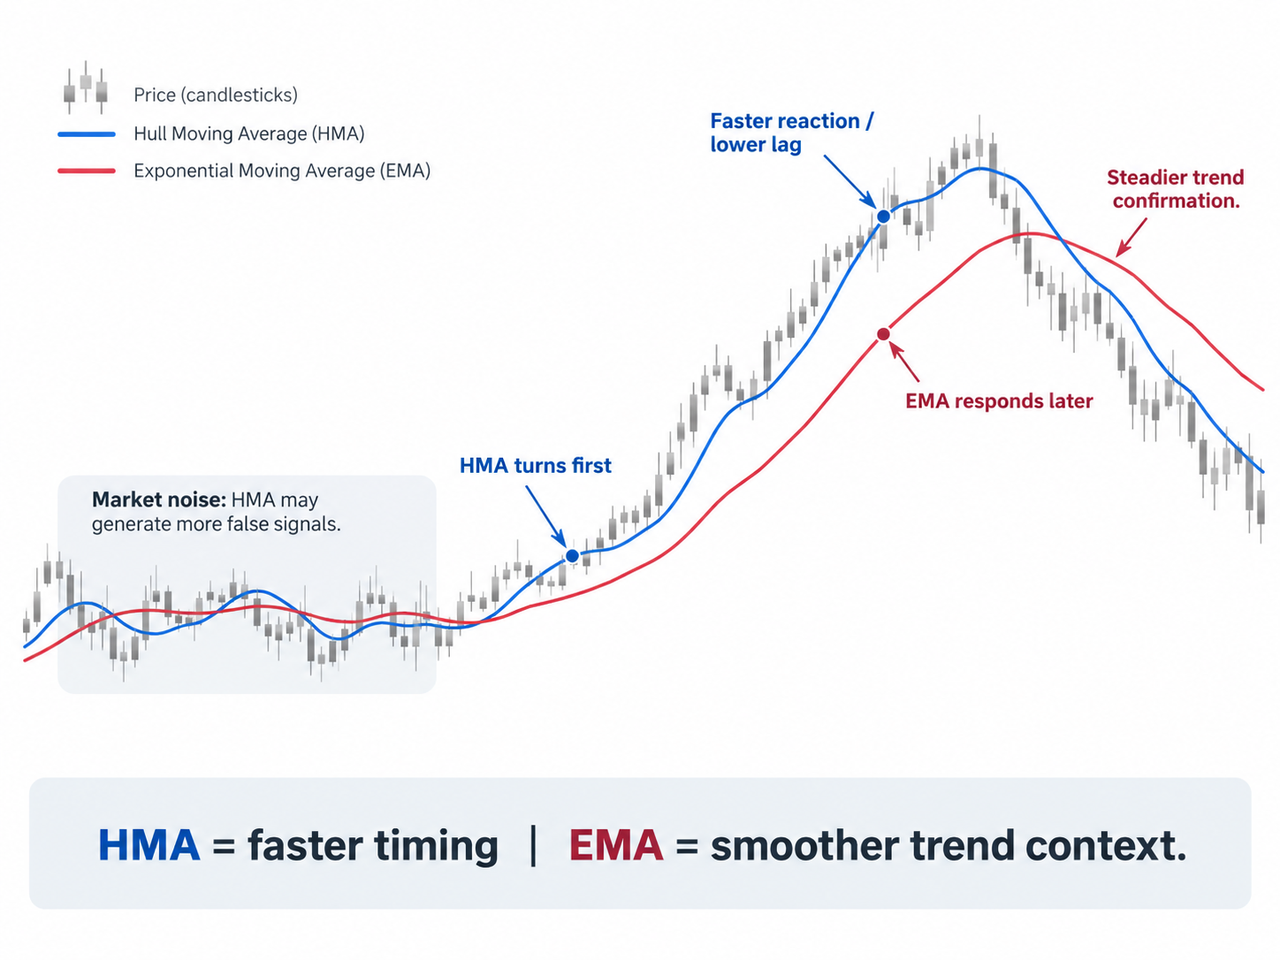
For scalping, the Hull Moving Average vs. EMA question comes down to speed versus consistency. HMA generally reacts faster to sharp price movements and can flag early turning points sooner, while EMA tends to give a steadier view of short-term trend direction. Neither is inherently more profitable.
For scalpers working on one-, three-, or five-minute charts, that difference matters. A signal arriving one or two candles earlier can improve timing, but greater sensitivity also means more exposure to market noise and false signals. The practical choice depends on whether the trading style prioritizes rapid momentum shifts or more dependable trend confirmation.
Key Takeaways
The Hull Moving Average (HMA) is designed to reduce the built-in lag found in traditional moving averages while keeping the average line relatively smooth.
EMA gives more weight to recent prices and reacts faster than a simple moving average, but HMA can respond even sooner to changing price direction.
Short HMA settings can improve scalp entries and exits in trending markets, though their sensitivity creates more false signals in sideways markets.
EMA often works well as a broader trend or dynamic support and resistance reference, while HMA can handle entry timing.
Combining HMA and EMA with price action, volume, or market-participation indicators can provide more context than using either indicator alone.
Hull Moving Average vs. EMA: What Is the Main Difference?
Both indicators smooth price data, but they achieve that goal differently.
The exponential moving average (EMA) applies progressively more weight to recent price data and less weight to older observations. As CME Group explains in its moving-average methodology, the standard EMA multiplier is:
Multiplier = 2 ÷ (Period + 1)
That weighting makes EMA more responsive than a simple moving average, which gives equal weight to every observation in its period.
The Hull Moving Average takes lag reduction further. Developed by Alan Hull in 2005, HMA combines several weighted moving averages (WMAs) and then applies additional smoothing based on the square root of the chosen period. Alan Hull describes the objective as maintaining curve smoothness while reducing the delay between the average and current price activity.
Feature
Hull Moving Average HMA
Exponential Moving Average EMA
Main objective
Minimal lag with smoothing
Responsive trend smoothing
Weighting
Multiple weighted averages
Exponentially declining weights
Reaction speed
Usually faster
Fast, but typically slower than HMA
Noise sensitivity
Higher at short settings
Moderate depending on period
Scalping use
Rapid momentum shifts and turns
Trend direction and pullbacks
Sideways markets
More prone to whipsaws
Can also whipsaw, usually less aggressively
The difference becomes especially visible during sudden price changes. HMA may turn before EMA, but an earlier signal isn't automatically a better signal.
How the Hull Moving Average HMA Reduces Lag
The HMA calculation uses three steps:
Calculate a WMA using half the period and multiply it by two.
Subtract the full-period WMA.
Apply another WMA using the square root of the original period.
In simplified form:
HMA = WMA 2×WMA(n/2)−WMA(n),√n
This combination deliberately emphasizes recent price movements before smoothing the result again. Fidelity's HMA methodology describes the indicator as a fast, smooth moving average designed to substantially reduce lag.
The calculation also explains why HMA behaves differently from the Weighted Moving Average. A standard WMA simply gives more weight to recent prices. HMA combines multiple weighted averages specifically to offset lag.
For scalping, that responsiveness can help reveal early turning points after a short pullback or acceleration. The catch is that minor fluctuations can also make a short HMA change direction when no meaningful trend reversal follows.
How the Exponential Moving Average EMA Works for Scalping
EMA is less complex. It combines the latest price with the previous EMA value using an exponential weighting factor.
Short-period averages such as the EMA 9 react closely to short-term price movements, while the EMA 20 provides more smoothing. An EMA 50 moves more slowly and can serve as a broader trend filter.
That hierarchy is useful for scalpers. The relationship between EMA 9, EMA 20 and EMA 50 can show whether short-term momentum and the broader intraday trend are moving in the same direction.
EMA can also act as a dynamic support or resistance reference. In an established uptrend, price may repeatedly pull back toward a rising EMA before continuing higher. The line doesn't create support by itself; it simply helps identify an area where price has repeatedly interacted with its recent average.
Which Moving Average Works Better for Scalping?
HMA generally has the advantage when the goal is detecting rapid momentum changes with minimal lag. EMA may be preferable when a scalper wants fewer reactions to very small price movements and a more stable representation of the underlying trend.
Consider a fast BTC move. The HMA line may turn upward quickly after price rebounds from intraday support, giving an early bullish signal. The EMA may require another candle or two before its slope changes meaningfully.
That earlier HMA signal can be useful when the move continues. If price immediately returns to its range, however, the same sensitivity may produce an unnecessary entry.
A practical approach is to avoid treating the choice as HMA or EMA. HMA can provide timing while EMA defines context.
The opposite structure can be used to identify bearish conditions.
A trader testing the setup can display both indicators against a live BTC/USDT chart on Gate.com and compare how quickly each line reacts around the same turning points. The exercise is more useful than judging the indicators from isolated historical screenshots because volatility and market structure change over time.
Best HMA Setting for Scalping
There is no universal best HMA setting. Shorter periods react faster but also track market noise more closely.
Settings around 9 to 21 periods are commonly used for fast intraday analysis, while longer HMA periods such as 50 or above can function as trend filters. These are conventions rather than proven optimal values. Timeframe, asset volatility, liquidity, and trading rules all affect performance.
A two-HMA structure can also separate momentum from trend:
HMA 20: faster price direction and potential entry timing
HMA 50: slower trend identification
When HMA 20 rises above HMA 50, short-term momentum has strengthened relative to the slower average. A downward cross suggests the opposite. Still, Alan Hull's original description emphasizes HMA turning points rather than treating moving-average crossovers as inherently reliable signals.
Backtesting several settings against historical data is more defensible than assuming one period works across every crypto asset.
Using HMA Signals With Other Indicators
HMA signals become more useful when price direction has independent confirmation.
Suppose HMA turns upward after a pullback. A scalper might check whether price is also above an intraday support level and whether Net Volume shows stronger participation during upward price movements.
Open Interest can add another layer when derivatives positioning matters. Rising open interest alongside a directional move indicates expanding positioning, although it doesn't reveal by itself whether new positions are bullish or bearish.
Momentum tools such as the Relative Strength Index or Moving Average Convergence Divergence (MACD) can also help distinguish a genuine directional move from a brief fluctuation. The objective isn't to stack indicators until every signal agrees. It is to use tools that answer different questions.
HMA and EMA in Sideways and Volatile Markets
Neither moving average fixes the core problem of a sideways market.
When price repeatedly changes direction within a narrow range, a fast HMA can produce several bullish and bearish turns without a sustained follow-through. Shorter settings amplify this problem because every small price change has more influence.
EMA suffers from whipsaws too, but its slower response may filter some minor fluctuations. The tradeoff is delayed recognition when a real breakout finally develops.
Sharp volatility creates a different problem. Both moving averages rely on historical price data, so neither predicts the next candle. A sudden liquidation, news event, or liquidity shock can make an apparently dependable trading signal obsolete almost immediately.
Price structure still matters. Intraday levels such as Daily High and Low and Session High and Low can help show whether an HMA or EMA signal is occurring near a meaningful breakout, rejection, or support area.
Conclusion
For ultra-short scalping where rapid momentum detection matters, the Hull Moving Average generally responds faster than EMA and can reveal directional shifts earlier. EMA sacrifices some speed for a steadier view of short-term and broader trend structure.
That makes the two indicators complementary rather than direct substitutes. A fast HMA can help with entries and exit points, while an EMA can filter those HMA signals against the broader trend.
Neither HMA nor EMA is inherently more profitable. Market conditions, period settings, execution costs, timeframe, and risk controls can matter more than the moving-average formula itself. Both are historical technical indicators, so their signals should be interpreted alongside price action and other market information rather than used as standalone predictions.
FAQ
Is HMA better than EMA for scalping?
HMA can be better when a scalper values very fast responses to recent price changes. EMA may be more useful when trend stability matters more than getting the earliest possible signal.
Does HMA provide earlier signals than EMA?
Usually, yes. HMA's combination of weighted averages is designed to reduce lag, so its line can turn sooner than an EMA using a comparable period. Earlier signals can also increase false signals.
What is a good HMA setting for scalping?
Periods between roughly 9 and 21 are commonly used for fast intraday charts, but there is no universally optimal setting. Traders should test the period against the asset, chart timeframe, volatility, and specific trading rules.
Can HMA and EMA be used together?
Yes. One approach is to use EMA for broader trend direction and HMA for faster entry or exit timing. For example, a rising HMA within a market already trading above a rising EMA can provide more context than an HMA turn alone.
Does HMA work in sideways markets?
HMA can struggle in sideways markets because its responsiveness makes it sensitive to minor price changes. Frequent changes in HMA direction may generate false or short-lived signals when price lacks a sustained trend.
Is HMA suitable only for scalping?
No. HMA can also be applied to day trading and swing trading by increasing the period or using higher chart timeframes. Longer periods create a slower HMA that emphasizes broader price trends instead of very short-term movements.
Disclaimer:Technical indicators use historical data and cannot guarantee future price movements or trading results.
Author: Jared
Disclaimer
* The information is not intended to be and does not constitute financial advice or any other recommendation of any sort offered or endorsed by Gate.
* This article may not be reproduced, transmitted or copied without referencing Gate. Contravention is an infringement of Copyright Act and may be subject to legal action.
DEX aggregators integrate order data, price information, and liquidity pools from multiple decentralized exchanges, helping users find the optimal trading path in the shortest time. This article delves into 8 commonly used DEX aggregators, highlighting their unique features and routing algorithms.
The report shows that in Q1 2026, the crypto market will reach a stage of structural maturity, with Derivative trading making up more than 90% of total trading volume, exceeding $20 trillion. As Spot demand weakens, liquidity will become even more concentrated in top exchanges, reflecting a more cautious market sentiment and a shift toward leveraged and institutional trading.