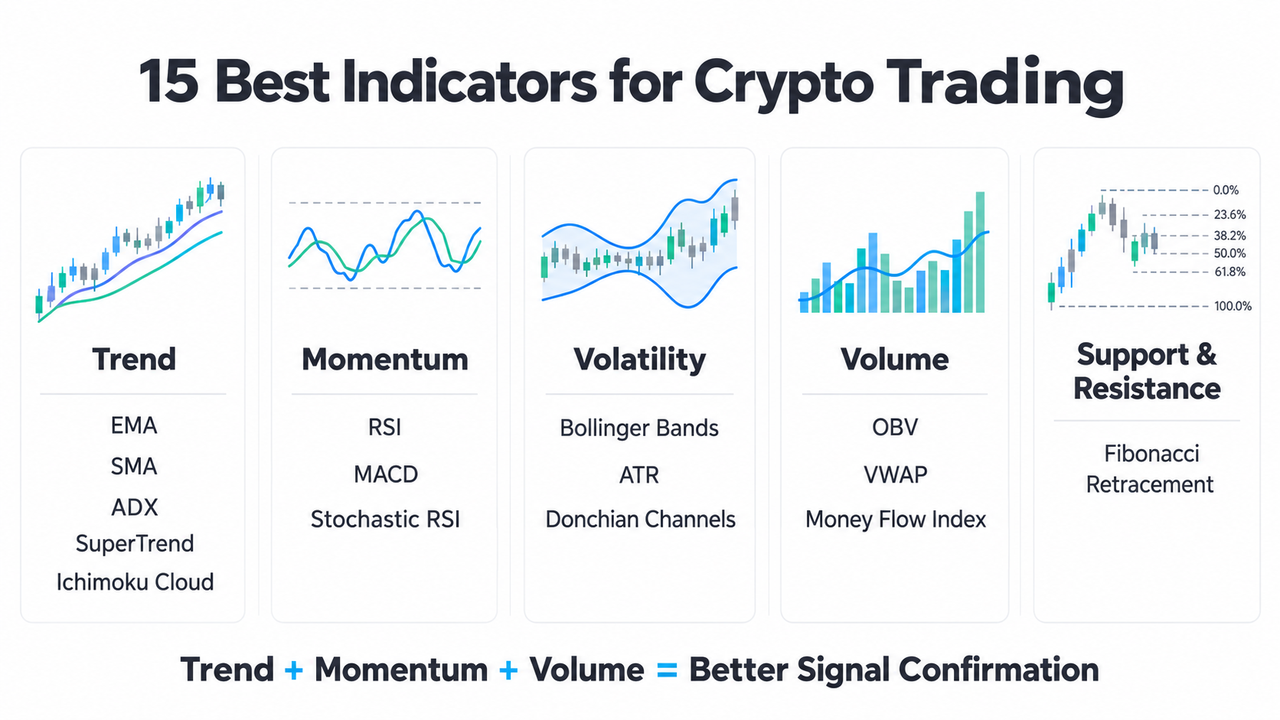
Each measures a different part of market behavior: trend direction, momentum, volatility, trading volume, or potential support and resistance levels.
For crypto traders learning technical analysis or refining existing trading strategies, choosing complementary indicators matters more than stacking multiple signals. Cryptocurrency markets can move sharply, and even familiar indicators produce false signals during changing market conditions.
Here's how these 15 tools work, where they're useful, and how to combine them without overcrowding a chart.
Key Takeaways
-
RSI, MACD, and Stochastic RSI help identify momentum changes and overbought or oversold conditions.
-
EMA, SMA, SuperTrend, and Ichimoku Cloud help traders assess market trends and direction.
-
Bollinger Bands, ATR, and Donchian Channels measure volatility or identify potential price breakouts.
-
OBV, VWAP, and MFI add trading-volume context to price movements.
-
Combining one trend indicator, one momentum indicator, and one volume tool can improve signal interpretation, but cannot eliminate trading risk.
What Makes an Indicator Useful for Crypto Trading?
Technical indicators process historical price data, closing prices, and sometimes trading volume into signals.
Some are lagging indicators, confirming movements after they develop. Others are described as leading indicators because they may highlight weakening momentum before a price trend reverses. Neither predicts future prices reliably.
Traders familiar with technical indicators for beginners generally start with three questions: Is the market trending? Is momentum strengthening? Does volume support the move?
The answers help distinguish a genuine trading setup from ordinary price noise.
15 Best Indicators for Crypto Trading Explained
-
Relative Strength Index (RSI): Identify Overbought Conditions
The Relative Strength Index (RSI) is a momentum indicator ranging from 0 to 100.
Readings above 70 traditionally indicate overbought conditions, while readings below 30 suggest oversold conditions.
However, RSI can remain elevated throughout a strong bull market or depressed during a bear market. These thresholds aren't automatic buy or sell signals.
-
Moving Average Convergence Divergence (MACD)
The Moving Average Convergence Divergence (MACD) measures changes in trend momentum.
Its standard calculation subtracts the 26-period exponential moving average from the 12-period EMA. A nine-period EMA of the MACD line forms the signal line.
A bullish crossover may indicate strengthening momentum; a bearish crossover suggests weakening momentum. Crosses around the zero line also provide context.
The CME Group's oscillator education explains how MACD and RSI interpret momentum differently.
-
Exponential Moving Average (EMA): A Responsive Moving Average
An EMA assigns greater weight to recent prices, making it more responsive than a simple moving average.
The 9, 20, and 50-period EMAs are commonly used to evaluate short-term and intermediate market trends.
When the EMA 9, EMA 20, and EMA 50 align upward, traders may interpret the arrangement as bullish trend structure.
The catch is that repeated crossovers become unreliable in sideways markets.
-
Simple Moving Average (SMA)
The SMA calculates the average closing price across a fixed number of periods.
A 50-period SMA helps identify intermediate trends, while a 200-period SMA often represents broader market direction.
Because SMA and EMA react differently to recent price changes, the SMA generally provides smoother but slower signals.
-
Bollinger Bands: Market Volatility and Price Extremes
Bollinger Bands contain three lines: a middle SMA, an upper band, and a lower band.
The standard setup places the outer bands two standard deviations from a 20-period SMA.
Bands expand during high volatility and contract during low volatility.
A price touching the upper band isn't automatically bearish. During strong trending markets, prices can repeatedly track an outer band.
-
Average True Range (ATR)
ATR measures market volatility rather than trend direction.
A rising ATR indicates expanding price ranges, while a declining ATR suggests quieter trading conditions.
Traders frequently use ATR to plan stop-loss distances. For example, a stop placed two ATR units below an entry accommodates more price movement than a fixed percentage stop, although neither guarantees protection.
-
Volume-Weighted Average Price (VWAP)
VWAP calculates the average price weighted by trading volume, typically resetting each trading session.
When price remains above VWAP, intraday market positioning may appear bullish.
The VWAP versus EMA distinction matters because VWAP incorporates trading activity, while EMA measures smoothed price history.
-
On-Balance Volume (OBV): Buying and Selling Pressure
On-Balance Volume (OBV) tracks cumulative volume.
It adds volume when the current closing price exceeds the previous close and subtracts volume when it falls below.
Rising OBV alongside rising prices suggests participation supports the trend. Falling OBV during a rally may indicate weakening confirmation.
Importantly, OBV approximates buying and selling pressure; it doesn't directly measure aggressive buy orders against sell orders.
-
Average Directional Index (ADX)
ADX measures trend strength on a 0–100 scale without identifying direction.
Readings above 25 commonly suggest stronger trending conditions, while readings below 20 often indicate weak or range-bound markets.
ADX can help distinguish a strong trend from a short-lived price movement, especially when interpreted with directional indicators.
-
SuperTrend: Trend Direction and Exit Points
SuperTrend combines ATR with price calculations to display a trailing trend line.
A change in line position can generate potential entry or exit signals.
It can be useful during sustained market movements, although frequent reversals create whipsaws. The SuperTrend and VWAP approach combines trend-following information with intraday average price.
-
Ichimoku Cloud
Ichimoku Cloud combines trend, momentum, and potential support or resistance information.
Its components include the conversion line, base line, leading spans, and lagging span.
Price above the cloud commonly indicates bullish market structure. A thick cloud may represent a wider potential support or resistance region, though it doesn't guarantee a bounce.
-
Stochastic RSI
Stochastic RSI applies the stochastic formula to RSI values instead of directly analyzing price.
Its 0–1 scale, sometimes displayed as 0–100, highlights momentum extremes more frequently than conventional RSI.
This responsiveness can help short-term traders but also increases false signals during choppy market conditions.
-
Fibonacci Retracement Levels
Fibonacci Retracement identifies potential support and resistance using proportions of a previous price movement.
Common levels include 23.6%, 38.2%, 50%, and 61.8%, although 50% isn't a Fibonacci ratio.
Traders often watch these Fibonacci retracement levels for pullbacks within an established trend.
Their effectiveness depends partly on selecting meaningful swing highs and lows.
-
Money Flow Index (MFI)
The Money Flow Index combines price and trading volume to assess momentum.
Like RSI, MFI ranges from 0 to 100, with 80 and 20 commonly used as overbought and oversold thresholds.
Differences between price direction and MFI may highlight weakening participation, although divergence can persist before any reversal develops.
-
Donchian Channels
Donchian Channels display the highest high and lowest low over a selected lookback period, alongside a midpoint.
A breakout above the upper channel may signal bullish continuation. A move below the lower channel suggests bearish pressure.
Still, low trading volume or rapid price rejection can turn an apparent breakout into a false signal.
Which Crypto Indicators Work Best Together?
Combining indicators from different categories is generally more informative than using several tools measuring the same thing.
| Trading objective |
Indicator combination |
| Trend continuation |
EMA + RSI + OBV |
| Momentum reversal |
MACD + RSI + MFI |
| Intraday trading |
VWAP + SuperTrend + Volume |
| Volatility breakout |
Bollinger Bands + ADX + OBV |
| Swing trading |
SMA + Fibonacci + ATR |
For example, a trader examining the BTC/USDT spot market on Gate.com notices price moving above the 50-period EMA.
RSI rises above 50, while OBV increases alongside the breakout. These observations provide three different forms of supporting evidence: trend, momentum, and volume.
However, an apparent breakout can still fail if market sentiment changes or liquidity disappears.
Risk Management When Trading Crypto Indicators
Even well-aligned indicators cannot prevent losses in volatile markets.
Consider allocating only a small, predefined portion of trading capital to each position. Define invalidation levels before entering, and use ATR or established support levels to inform stop placement.
Stop-loss execution deserves attention. FINRA's explanation of stop orders notes that execution prices can differ significantly from stop prices during volatile conditions.
The SEC's Investor.gov day-trading guidance also emphasizes the possibility of substantial losses over short periods.
With leveraged cryptocurrencies, liquidation risk and funding costs introduce additional considerations.
Conclusion
The best indicators for crypto trading depend on the trading style and market conditions.
RSI and MACD are useful for momentum, EMA and SuperTrend for direction, ATR and Bollinger Bands for volatility, and OBV for volume confirmation.
Start with two or three complementary tools, verify signals against price structure, and assess risks before making trading decisions. More indicators don't automatically produce better results.
FAQs
What are the three best indicators for crypto trading beginners?
EMA, RSI, and OBV form a practical starting combination. They assess trend direction, momentum, and volume confirmation without excessively complicating the chart.
Is RSI or MACD better for crypto trading?
RSI is useful for identifying momentum extremes, while MACD highlights changes in trend momentum. RSI may respond more quickly to short-term conditions, whereas MACD often provides smoother confirmation.
Which indicators are best for crypto day trading?
VWAP, EMA, SuperTrend, and ATR are commonly used for intraday trading. Traders usually select a small combination rather than applying all four simultaneously.
Can technical indicators predict crypto prices?
No. Technical indicators analyze historical data and current market conditions. They can identify patterns and possible scenarios but cannot reliably predict future prices.
How many indicators should a crypto trader use?
Two or three complementary indicators are often sufficient. A trend filter, momentum oscillator, and volume indicator can provide useful confirmation without excessive chart complexity.
Disclaimer: This content is for educational purposes only and does not constitute financial or investment advice. Cryptocurrency trading involves substantial risk, and past indicator performance does not guarantee future results. Trading products and restrictions may vary by jurisdiction.







