For traders comparing SuperTrend vs. VWAP, the practical choice depends on what they’re trying to confirm. VWAP provides intraday value and directional context. SuperTrend can help determine whether an existing move remains intact. Used together, the indicators can more comprehensively capture market trends, but neither replaces position sizing, stop-loss rules, or other ways to control risk.
Key Takeaways
-
VWAP measures average intraday price weighted by volume, making it useful for market bias, value, and possible support or resistance.
-
SuperTrend uses Average True Range (ATR) to identify prevailing trend direction and potential turning points.
-
SuperTrend is effective in trending markets but can lag and generate false signals when price oscillates sideways.
-
VWAP normally resets each trading session and is primarily designed for intraday analysis.
-
A strategy that combines VWAP and SuperTrend can filter some weak signals, but traders still need to incorporate risk management and money management strategies.
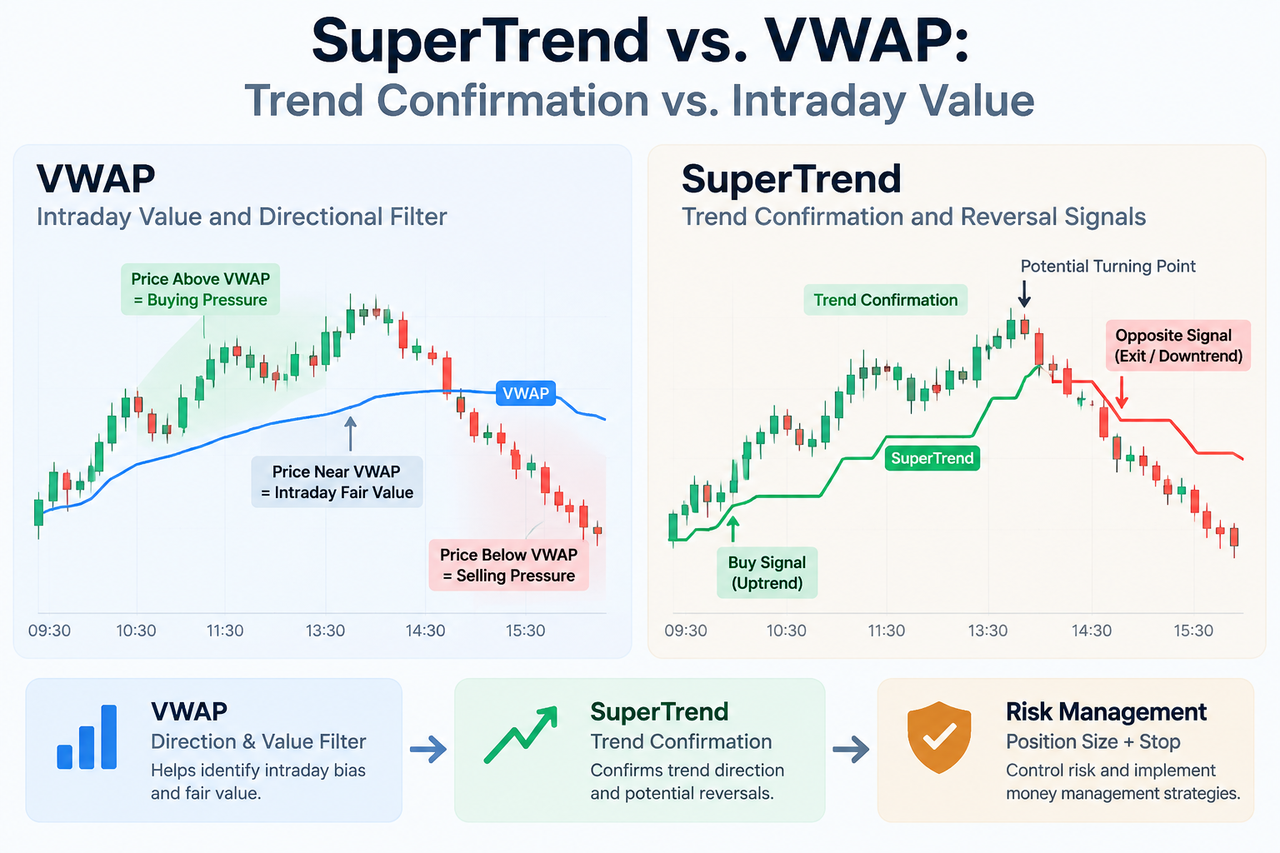
SuperTrend vs. VWAP at a Glance
| Feature |
SuperTrend |
VWAP |
| Main purpose |
Trend confirmation and reversal signals |
Intraday value and directional bias |
| Main inputs |
Price and ATR |
Price and volume |
| Volume included? |
No |
Yes |
| Volatility included? |
Yes |
Not directly |
| Typical signal |
Trend-state change |
Price above/below VWAP |
| Strongest environment |
Directional markets |
Liquid intraday markets |
| Main weakness |
Lag and range-bound false signals |
Repeated crosses in choppy conditions |
| Session reset |
No fixed daily reset |
Usually daily |
| Risk use |
Possible trailing-stop reference |
Usually needs separate stop logic |
The VWAP indicator measures volume-weighted intraday value, whereas the SuperTrend indicator tracks volatility-adjusted trend direction. Their different calculation principles explain why they often work better together than as substitutes.
How VWAP Works in Intraday Trading
The basic strategy principle behind VWAP is to calculate the cumulative value of price multiplied by volume and divide it by cumulative volume:
VWAP = Cumulative (Typical Price × Volume) / Cumulative Volume
Because the VWAP indicator considers volume, high-volume periods influence the result more heavily than quieter periods. The calculation usually restarts at the beginning of each trading session.
Price above VWAP is commonly interpreted as buying pressure or bullish intraday bias. Price below VWAP can indicate selling pressure. The line may also act as dynamic support or resistance when market participants repeatedly respond near the average price.
A basic signal rule could define a buy condition when price crosses and holds above VWAP and determine a sell condition when price crosses and remains below it. In practice, a simple crossover rule is vulnerable to market noise. During unclear trends, price may cross VWAP several times without developing a meaningful move.
That is one reason the VWAP vs. EMA comparison for day trading matters: VWAP incorporates volume, while an EMA responds only to price and gives more weight to recent observations.
How the SuperTrend Indicator Works
SuperTrend uses price together with Average True Range, a volatility measure. A common calculation starts with:
Upper Band = (High + Low) / 2 + Multiplier × ATR
Lower Band = (High + Low) / 2 − Multiplier × ATR
An ATR period of 10 and multiplier of 3 are widely used starting parameters, although traders can optimize parameter selection for different assets, timeframes, and volatility conditions.
The strategy principle is straightforward. When price remains above the active SuperTrend line, the indicator generally represents an uptrend. When price falls below the line and the current signal differs from the previous trend state, the indicator can switch to a bearish condition.
This signal-state design has useful oscillation filtering characteristics because it avoids generating a completely new signal on every small price move. Many strategies also avoid consecutive signals in the same direction until an opposite signal appears.
Still, SuperTrend reacts after price has moved. That lag can help filter minor fluctuations but may delay entries around potential turning points. Sideways markets are another problem because repeated reversals can generate false signals.
When SuperTrend Can Be More Useful
SuperTrend is generally more useful when a trader wants to know whether an established directional move is still intact.
Suppose BTC breaks higher, remains above a key intraday level, and continues forming higher highs and higher lows. SuperTrend can provide a visible trend-confirmation mechanism and a possible volatility-adjusted trailing reference.
That makes it useful for capturing major trends rather than reacting to every fluctuation. The EMA 9, EMA 20, and EMA 50 comparison provides another way to assess short-, intermediate-, and broader intraday direction using moving averages rather than ATR.
The strategy risks are clearest in range-bound conditions. Price can repeatedly move through the SuperTrend threshold, creating several losing or low-quality signals before a sustained direction emerges.
When VWAP Can Be More Useful
VWAP is better suited to questions about intraday value, market bias, and price's position relative to session activity.
Imagine ETH staying above VWAP for most of the trading session. Pullbacks approach the line, but buyers repeatedly defend the area. That structure may indicate persistent buying pressure even when no new SuperTrend signal is appearing.
VWAP can therefore help traders judge whether a potential entry aligns with the broader session. It is frequently used on short intraday timeframes such as 1-, 5-, or 15-minute charts, although liquidity and trading style matter.
For example, a trader using the BTC/USDT spot market on Gate.com can compare live price action, volume, VWAP behavior, and other technical indicators on the same market rather than relying on a static historical example.
Strategy That Combines VWAP and SuperTrend
A strategy that combines VWAP and SuperTrend separates market context from trend confirmation.
For a bullish setup, the strategy principle could require:
-
Price to remain above VWAP.
-
SuperTrend to show a bullish state.
-
No new buy signal to be generated if the previous signal state is already bullish.
-
A new trade decision only when the current signal differs from the stored state or the setup resets.
The bearish logic reverses those conditions. Price remains below VWAP, while SuperTrend confirms a downtrend. The strategy can then determine the sell condition based on both direction and signal state rather than a single crossover.
The main strategy advantage is that it combines VWAP’s volume-weighted market context with SuperTrend’s ATR-based trend confirmation. This may further filter signals that conflict with the broader session.
For example, a bullish SuperTrend change occurring while price remains clearly below VWAP may be treated more cautiously than a bullish signal appearing above VWAP. The strategy combines two independent pieces of information instead of relying on one indicator to do everything.
Still, the combination cannot eliminate false signals. In highly choppy conditions, both indicators can respond poorly because neither can know in advance whether the next move will become a sustained trend.
Risk Management and Strategy Optimization
Any usable setup should implement risk management measures separately from its signal logic. Neither VWAP nor SuperTrend determines an appropriate position size, maximum acceptable loss, leverage level, or total portfolio exposure.
SuperTrend can provide a possible dynamic stop reference because its bands respond to ATR, but traders still need to incorporate risk management rules such as fixed trade risk, stop placement, and exposure limits. Incorporating money management strategies is especially important when repeated false signals increase trading frequency.
Several strategy optimization directions can be considered:
-
Adjust the SuperTrend ATR period and multiplier.
-
Test different VWAP and SuperTrend parameters.
-
Require minimum distance from VWAP before accepting a signal.
-
Add price structure or other technical indicators to further filter signals.
-
Test different stop-loss and exit rules.
-
Compare results across trending, volatile, and sideways conditions.
These optimization directions introduce tradeoffs. A tighter SuperTrend can react sooner but may create more false signals. Wider settings reduce signal frequency but may increase lag. Stronger filtering may improve selectivity while causing the strategy to miss early portions of a move.
Backtesting historical data is one way to evaluate further optimization. Traders can compare signal frequency, drawdown, transaction costs, win/loss distribution, and performance under different market conditions. Parameter optimization should use more than one short historical sample because a setting fitted to one period may not behave similarly later.
A more complete framework should also assess whether the strategy’s performance depends heavily on one market regime. If results only look strong during prolonged trends, the strategy risks deteriorating when volatility falls or price moves sideways.
Using Other Technical Indicators for Confirmation
VWAP and SuperTrend don't have to operate alone. Other technical indicators can provide information they don't directly measure.
For example, the EMA 50 can help identify broader intraday trends, while ATR measures market volatility. Momentum indicators such as RSI can add information about the strength and speed of a move.
The goal isn't to stack indicators until every signal agrees. Too many closely related indicators can duplicate information. Further optimization should focus on whether each tool measures something different enough to improve the decision.
SuperTrend vs. VWAP: Which Is Better?
There is no universal winner in SuperTrend vs. VWAP for day trading.
VWAP is generally more useful for intraday value, directional bias, and assessing whether price is trading above or below a volume-weighted benchmark. SuperTrend is more useful for identifying the prevailing trend, following major moves, and signaling when trend conditions may have changed.
A strategy that combines both can more comprehensively capture market trends by using VWAP as a value and direction filter and SuperTrend as a trend-confirmation mechanism. The combination may reduce some low-quality signals, but it still requires traders to control individual trade risk, incorporate money management strategies, and test how the setup behaves across different market conditions.
FAQ
Is SuperTrend better than VWAP for day trading?
Not universally. SuperTrend is better suited to trend confirmation and potential reversal signals, while VWAP is better for assessing intraday value, trading-volume context, and directional bias.
Can SuperTrend and VWAP be used together?
Yes. A strategy can use VWAP to establish intraday direction and SuperTrend to confirm whether the trend is moving in the same direction. This may filter some conflicting signals but doesn't eliminate false signals.
What are common SuperTrend settings?
An ATR period of 10 and multiplier of 3 are commonly used starting settings. Traders may optimize parameter selection depending on timeframe, volatility, asset liquidity, and trading strategy.
Does VWAP provide buy and sell signals?
A price move above VWAP may be interpreted as bullish, while a move below VWAP may be interpreted as bearish. Raw VWAP crosses can produce false signals in oscillating markets, so traders often combine them with trend, momentum, or price-structure confirmation.
How can traders control risk with SuperTrend and VWAP?
They can implement risk management measures such as predetermined stop-loss levels, position sizing, maximum loss per trade, and exposure limits. Neither indicator calculates these controls automatically.
Can other technical indicators improve the strategy?
Potentially. ATR, moving averages, RSI, price structure, or volume tools may add different information and further filter signals. Extra indicators should be tested carefully because overlapping tools can add complexity without improving results.
Disclaimer: This content is for educational purposes only and does not constitute financial, investment, or trading advice. Technical indicators and backtested strategies can produce false signals, and historical performance does not guarantee future results.







