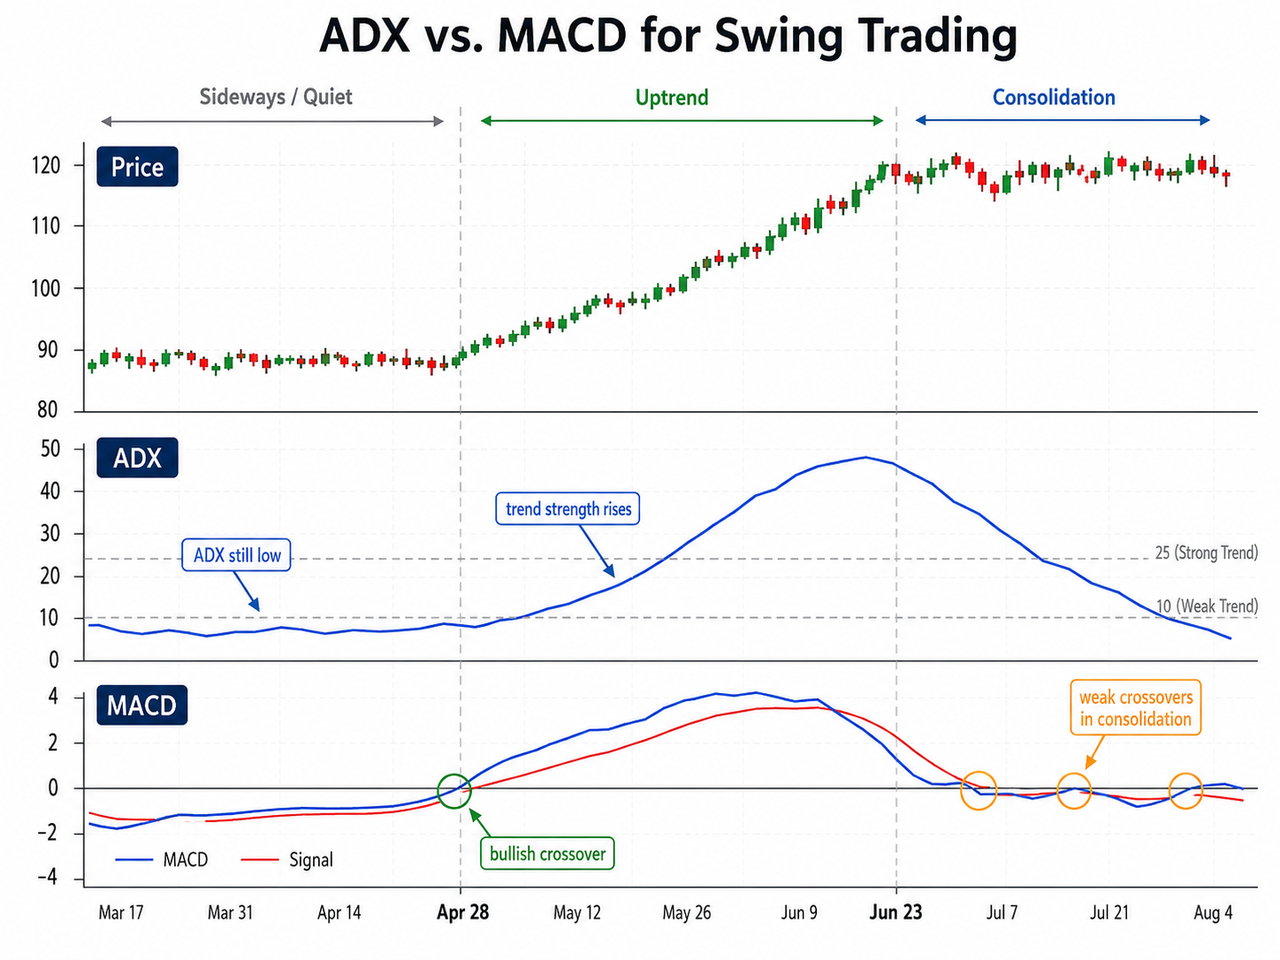
MACD is generally more useful for timing swing-trading entries and exits, while ADX is better for confirming whether a market trend is strong enough to support a directional strategy. In an adx vs macd indicator comparison, the better choice depends on whether the trader needs momentum signals or trend-strength confirmation.
For swing traders and crypto or broader financial market traders trying to improve trade timing and decision-making, that distinction affects which signals to trust and when to avoid weak setups. This comparison focuses on how ADX and MACD differ, where each indicator works best, their strengths and weaknesses, how they behave in sideways markets, how reliable they are for exits, and how to combine them in swing-trading strategies without overlooking their risks and limitations.
MACD supports swing-trade timing through momentum shifts, crossovers, and potential entry or exit signals, whereas ADX evaluates whether directional price movement has developed enough strength to sustain a trend-following setup. Used correctly, the two indicators can help traders confirm trends, reduce false signals, and build more effective strategies in volatile markets such as crypto.
TL;DR
ADX measures trend strength, helping traders distinguish directional markets from weak or sideways conditions.
MACD measures direction and momentum, making it more practical for crossovers, momentum shifts, and trade timing.
MACD usually reacts earlier, but it can generate repeated false signals during consolidation.
ADX works best as a filter, because the ADX line alone does not identify whether the trend is bullish or bearish.
Using both indicators can improve context, with MACD providing the setup and ADX confirming trend quality.
Comparison factor
ADX
MACD
Full name
Average Directional Index
Moving Average Convergence Divergence
Main purpose
Measures trend strength
Measures direction and momentum
Main signals
ADX slope, thresholds, +DI and -DI
Crossovers, zero line, histogram, divergence
Best use
Filtering market conditions
Timing potential entries and exits
Main weakness
Often confirms after a trend begins
Can produce whipsaws in sideways markets
Typical role
Trend-quality filter
Momentum signal indicator
The main difference is straightforward: ADX evaluates the strength of directional movement, while MACD evaluates how direction and momentum are changing.
What Is the ADX Indicator?
The Average Directional Index measures how strong a price trend has become without independently identifying whether the trend is bullish or bearish. Using default settings, the standard ADX period is 14, and its main line usually ranges from 0 to 100, with higher readings indicating stronger directional movement rather than direction itself.
The standard ADX system includes:
+DI, which represents positive directional movement
-DI, which represents negative directional movement
ADX, which measures the strength of that movement
Together, these three lines show both directional pressure and whether that pressure is becoming more meaningful.
When +DI remains above -DI, bullish directional pressure has greater influence. When -DI is above +DI, bearish pressure is stronger. The ADX line then indicates whether the prevailing movement is strengthening or weakening, and many traders also watch adx signals from +DI and -DI crossovers as added context rather than standalone triggers.
Readings below approximately 20 often correspond with weak or range-bound conditions. A move above 20 or 25 may indicate that a more structured trend is forming. To read adx indicator levels, traders often note when the indicator reaches 20, 25, or 30 to judge whether momentum is emerging or already strong, and adx crosses of those levels are usually treated as strength references rather than hard signals. These levels are reference points rather than universal signals because different assets and timeframes can behave differently.
The full ADX indicator explanation covers its construction, directional movement lines, and common thresholds.
For swing traders, ADX is primarily a market-condition filter. A rising ADX can support a breakout or trend-continuation setup, while a falling ADX can indicate that an established move is losing strength. ADX does not provide a complete entry direction, so traders still need price structure, +DI and -DI, or another directional tool, because its main aim is trend-strength assessment rather than timing or direction by itself.
What Is the MACD Indicator?
The Moving Average Convergence Divergence indicator measures the relationship between two exponential moving averages to show trend direction, momentum, and changes in momentum. It was developed by Gerald Appel in the 1970s.
A standard MACD setup contains:
MACD line: The difference between two moving averages, calculated by subtracting the 26-period EMA from the 12-period EMA
Signal line: Usually a nine-period EMA of the MACD line
Histogram: The distance between the MACD line and signal line
The MACD indicator reacts to changes in the relationship between faster and slower moving averages. This makes it more responsive than ADX when momentum begins shifting, which is one reason many traders use it to track momentum.
A bullish crossover occurs when the MACD lines move above the signal line, while a move below it creates a bearish signal and one type of buy or sell signals. Movement above the zero line indicates that a positive MACD value means the 12-period EMA is above the 26-period EMA, while movement below zero reflects a bearish momentum structure.
The histogram helps show acceleration and deceleration. Expanding bars suggest momentum is increasing, while contracting bars indicate that momentum is weakening.
MACD can also show divergence. Bullish divergence occurs when price forms a lower low while MACD forms a higher low. Bearish divergence appears when price reaches a higher high while MACD forms a lower high. Divergence can suggest a possible reversal or broader trend reversals, but it does not confirm when a reversal will occur.
ADX vs. MACD: What Is the Main Difference?
ADX focuses on trend strength, while MACD focuses on direction and momentum. In practice, MACD and ADX are often compared as timing versus confirmation.
When price breaks above resistance, MACD may produce a bullish crossover as momentum begins improving, though both are a lagging indicator type built from historical price data. The histogram may expand as the move accelerates. ADX may remain low at first because the breakout has not lasted long enough to register as a strong trend.
If price continues rising, ADX may eventually turn upward and cross a trend-strength threshold. A confirmed crossover may suggest a likely continuation only if trend strength builds afterward. MACD therefore provides the earlier signal, while ADX provides later confirmation that the movement has developed into a more established trend.
Trading question
More useful indicator
Reason
Is the market trending strongly?
ADX
Directly measures directional strength
Is momentum turning bullish or bearish?
MACD
Tracks changes between fast and slow EMAs
Is a breakout gaining strength?
ADX
A rising reading supports trend development
Is momentum weakening?
MACD
Histogram contraction may appear earlier
Should trend signals be filtered out?
ADX
Low readings identify weak conditions
Where might an entry or exit form?
MACD
Crossovers offer clearer timing signals
ADX vs. MACD Indicator: Which Indicator Gives Better Entry Signals?
MACD generally provides clearer entry signals and entry points because its crossovers, histogram changes, and zero-line position show when momentum may be shifting. ADX is less suitable for precise timing because it normally confirms a trend after directional movement has already increased.
A bullish MACD crossover below the zero line can signal an early recovery, but the broader trend may still be bearish. A crossover above zero can better support trade entries, although the broader context still matters and it often arrives later.
ADX can improve the quality of these signals. A bullish crossover while ADX remains below 15 may occur inside an indecisive range. The same crossover accompanied by a rising ADX above 20 or 25 may have stronger trend-following support, especially when price action also confirms the move rather than relying on the crossover alone.
This does not make the signal reliable by default. It only helps distinguish a crossover occurring in weak conditions from one appearing as directional strength expands. Traders use these filters to enter trades only when momentum and trend context align.
ADX vs. MACD Indicator: Which Indicator Works Better in Sideways Markets?
ADX is more useful for recognizing sideways conditions, although neither indicator is designed to produce consistently reliable directional signals inside a narrow range.
When ADX remains low or continues falling, the market lacks sustained directional strength. MACD may repeatedly cross above and below its signal line because small price changes keep altering the relationship between its moving averages, and those repeated crossovers are less useful when underlying price trends are weak or absent.
These frequent crossovers can create whipsaws. Swing traders may therefore reduce the importance of MACD signals until ADX begins rising or price breaks beyond a clear support or resistance boundary.
Low ADX can help traders avoid forcing a trend-following trading strategy in ranging conditions, which also makes it easier to focus on markets or currency pairs that actually show directional strength.
The Aroon indicator provides a different view by measuring how recently price reached a period high or low. ADX remains more directly focused on the strength of directional movement.
ADX vs. MACD Indicator: Which Indicator Is Better for Exits?
MACD is generally better for momentum-based exits, while ADX is more useful for identifying broader trend deterioration. MACD exit signals can point to a possible reversal, but they should not be treated as proof on their own.
A trader holding a long position may watch for:
A contracting positive MACD histogram
A bearish MACD crossover
Bearish divergence near resistance
A move toward or below the zero line
These developments suggest that bullish momentum is weakening. However, a bearish crossover can also occur during a temporary pullback within a continuing uptrend.
A declining ADX indicates weakening trend strength, but it does not automatically signal a reversal. Price may consolidate before resuming the same direction. Traders seeking a chart-based trailing exit may find the Parabolic SAR or SuperTrend indicator more direct, while broader risk management can also include a stop loss below the closest swing low and a take profit near the relevant swing high.
How Can Swing Traders Combine ADX and MACD in a Trading Strategy?
ADX and MACD work well together when MACD identifies the setup and ADX filters the market environment, though many traders pair them with other technical indicators instead of relying on either tool alone.
A bullish framework may include:
Price breaks resistance or forms a higher low.
MACD crosses above its signal line.
The histogram begins expanding.
+DI remains above -DI as an additional signal.
ADX turns upward and moves above the selected threshold.
A bearish setup reverses these conditions. Price breaks support or forms a lower high, MACD turns downward, -DI leads +DI, and ADX begins rising. The relative strength index can also help flag overbought and oversold conditions before committing to either setup.
The indicators do not need to confirm on the same candle. MACD usually reacts earlier, while ADX confirms later. Requiring simultaneous signals can delay entry and reduce the available part of the swing.
A practical sequence is to use price structure first, MACD second, and ADX as confirmation. This avoids treating either indicator as a complete trading system. Traders can then adjust thresholds and confirmation rules to fit their trading needs through testing, while keeping MACD and ADX as the core filter-and-trigger pair.
ADX vs. MACD: Which Should Swing Traders Choose?
MACD is the stronger standalone option for traders who need visible direction, momentum changes, and potential timing signals. ADX is more suitable for traders who already have a directional setup and want to evaluate whether the trend has enough strength to continue.
Choose MACD when the priority is:
Detecting momentum shifts
Evaluating bullish and bearish crossovers
Monitoring histogram expansion
Identifying possible divergence
Timing potential entries and exits
Choose ADX when the priority is:
Measuring trend strength
Filtering sideways conditions
Confirming breakouts
Evaluating directional pressure
Deciding whether a trend-following strategy fits the market
Use both when the strategy requires momentum timing and trend-strength confirmation.
ADX vs. MACD Indicator: Risks and Limitations
ADX and MACD are lagging indicators calculated from historical price data. Neither predicts future direction with certainty, and past performance does not guarantee future results.
Their main limitations include:
MACD can produce false crossovers during consolidation.
ADX may confirm a trend after much of the move has occurred.
Divergence can persist without a reversal.
Fixed thresholds may behave differently across assets and timeframes.
Sudden news or liquidity changes can invalidate technical setups.
Multiple indicators using similar price data can create false confidence.
Swing traders should also define position size, stop placement, invalidation levels, liquidity requirements, and trading costs before entering a position, and match backtesting and parameter changes to their specific trading needs rather than assuming one setup works universally.
Conclusion
MACD offers clearer momentum direction and more practical entry or exit signals, while ADX shows whether directional movement is becoming strong enough to support a trend-following setup. MACD is generally the better standalone choice for swing trading, but ADX can improve signal quality by filtering weak conditions. The most balanced approach combines both indicators with price structure and defined risk controls.
Technical indicators do not guarantee profitable trades or accurately predict every reversal. Cryptocurrency and financial markets can be highly volatile, and this material is provided for educational purposes rather than financial advice.
FAQ
Is ADX better than MACD for swing trading?
ADX is better for measuring trend strength, while MACD is better for identifying momentum direction and potential timing. The better choice depends on whether the trader needs filtering or actionable signals.
Can ADX and MACD be used together?
ADX and MACD can be combined because they are often used with other indicators and measure different aspects of price behaviour. MACD can identify a directional setup, while ADX can confirm whether the associated trend is strengthening.
What ADX reading indicates a strong trend?
Readings above approximately 20 or 25 are commonly associated with developing or established trends. The most useful threshold depends on the asset, timeframe, volatility, and strategy.
What are the standard MACD settings?
The standard MACD settings are 12, 26, and 9. Its faster calculation gives more weight to recent price data than a simple moving average, which is why it responds relatively quickly. Faster settings react sooner but can produce more false signals, while slower settings provide smoother but later signals.
Does a falling ADX mean the trend is reversing?
A falling ADX means trend strength is weakening, not necessarily that price is reversing. The market may reverse, consolidate, or continue in the same direction after a pause.
Author: Jared
Translator: Chanya
Disclaimer
* The information is not intended to be and does not constitute financial advice or any other recommendation of any sort offered or endorsed by Gate.
* This article may not be reproduced, transmitted or copied without referencing Gate. Contravention is an infringement of Copyright Act and may be subject to legal action.
DEX aggregators integrate order data, price information, and liquidity pools from multiple decentralized exchanges, helping users find the optimal trading path in the shortest time. This article delves into 8 commonly used DEX aggregators, highlighting their unique features and routing algorithms.
The report shows that in Q1 2026, the crypto market will reach a stage of structural maturity, with Derivative trading making up more than 90% of total trading volume, exceeding $20 trillion. As Spot demand weakens, liquidity will become even more concentrated in top exchanges, reflecting a more cautious market sentiment and a shift toward leveraged and institutional trading.