That makes A/D useful when traders want to detect subtle changes in buying and selling pressure, while OBV is often easier to interpret for trend confirmation and breakout analysis. For traders comparing volume-based technical indicators, the important question isn't which indicator produces the “better” line. It's which form of volume flow matters for the current market setup.
Both can generate false signals, especially in noisy or thin markets, so neither should be treated as a standalone indicator for entries or price reversals.
Key Takeaways
-
OBV is usually simpler for trend confirmation. It adds the period's volume when price closes higher and subtracts it when price closes lower.
-
Accumulation Distribution adds intraperiod context. Its money flow multiplier measures where the closing price sits within the period's high-low range before weighting the period's total volume.
-
A/D can detect buying or selling pressure that OBV overlooks. A/D may rise even when the current closing price is below the previous close.
-
Divergence signals matter for both indicators. Price and the volume indicator moving in opposite directions can warn that the current trend is losing confirmation.
-
Using both together can strengthen volume analysis, but agreement between two indicators still doesn't guarantee the next price movement.
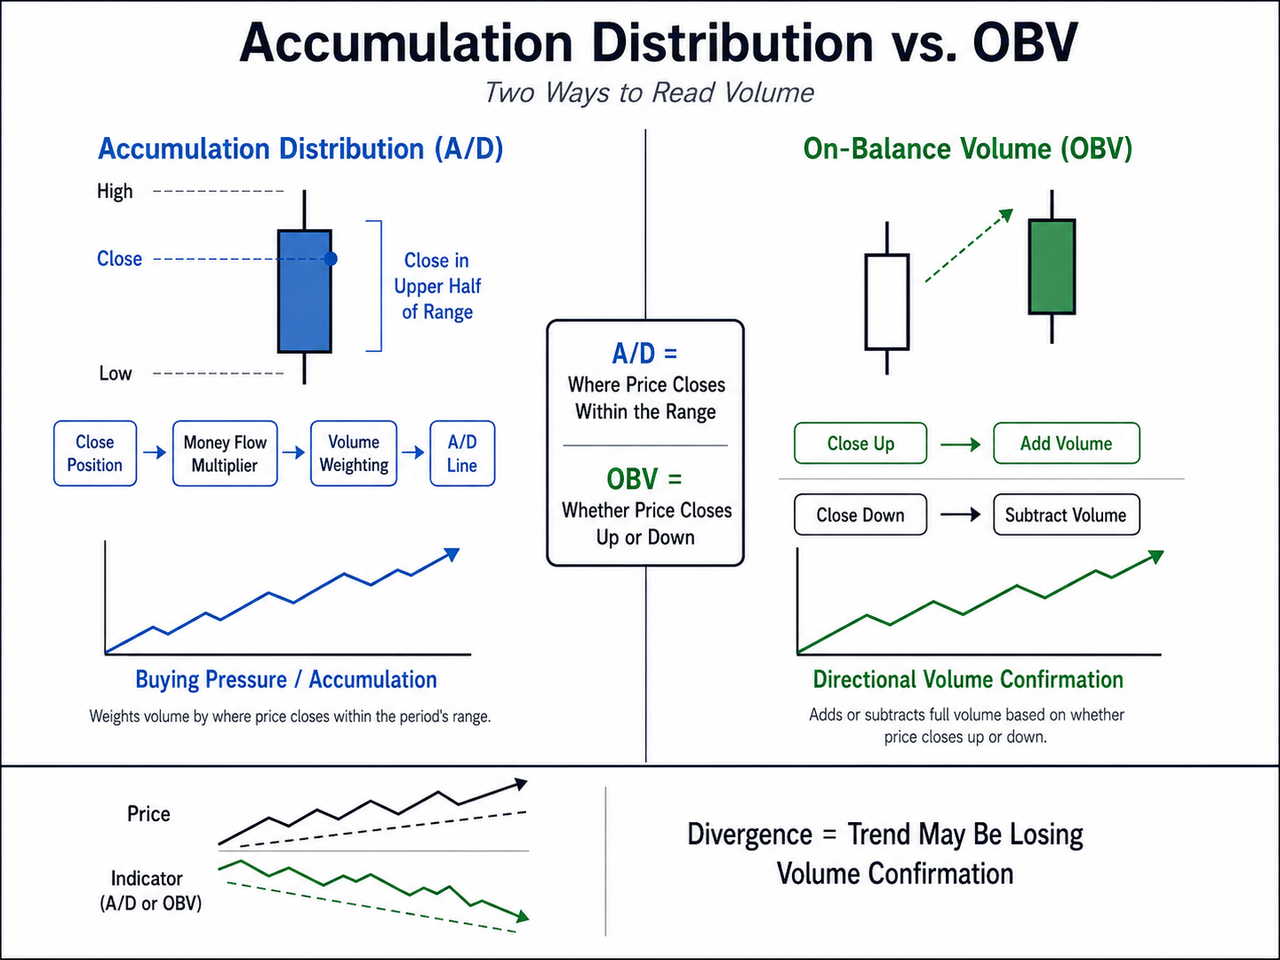
Accumulation Distribution vs. OBV: The Key Differences
Both the Accumulation Distribution Line and balance volume OBV create a cumulative measure of volume flow, but their calculations answer different questions.
| Feature |
Accumulation Distribution |
On-Balance Volume |
| Main input |
Price range, closing price, volume |
Closing-price direction, volume |
| Volume treatment |
Weighted from -1 to +1 |
Entire volume added or subtracted |
| Price comparison |
Close within current high-low range |
Current close vs. previous close |
| Main purpose |
Buying/selling pressure and cumulative money flow |
Directional volume and trend confirmation |
| Useful for |
Intraperiod pressure, divergence |
Trend participation, breakouts, divergence |
| Main weakness |
Can misread price gaps |
Binary treatment can oversimplify price action |
The difference becomes clearer during an unusual trading period. Suppose an asset closes below its previous closing price but finishes near the upper end of today's trading range. OBV treats the period as negative because price closed lower than the previous period. A/D can record positive money flow because buyers pushed the closing price toward the upper half of the current range.
Neither calculation is necessarily wrong. They are measuring different aspects of market dynamics.
The OBV indicator focuses on whether directional trading volume is expanding with a price trend, while the Accumulation Distribution indicator asks where the market closed inside each period's range before assigning volume.
How the Accumulation Distribution Indicator Works
Accumulation Distribution is a volume-based indicator designed to estimate cumulative money flow into and out of an asset.
Its calculation starts with the Money Flow Multiplier:
Money Flow Multiplier = [(Close − Low) − (High − Close)] / (High − Low)
The multiplier generally ranges between -1 and +1.
A closing price near the period's high produces a strongly positive value, indicating stronger buying pressure. A close near the period's low produces a negative value associated with selling pressure. A closing price near the middle of the period's range creates a value close to zero.
The next step is:
Money Flow Volume = Money Flow Multiplier × Period's Volume
Finally:
A/D Line = Previous A/D Line + Current Money Flow Volume
This Accumulation Distribution formula creates a running total rather than a bounded oscillator.
For example, if an asset repeatedly closes in the upper half of its range on high volume, positive money flow volume accumulates and the A/D Line tends to rise. In practical terms, that suggests the price action is experiencing sustained buying pressure.
The relationship between closing location and volume is also used by Chaikin Money Flow, although CMF measures money flow over a defined lookback window rather than maintaining the same type of cumulative flow line.
How Balance Volume OBV Works
On-Balance Volume takes a much more binary approach.
If today's closing price is higher than the previous period's closing price:
OBV = Previous OBV + Current Volume
If today's closing price is lower:
OBV = Previous OBV − Current Volume
If the closing price is unchanged, OBV normally remains unchanged.
OBV doesn't care whether price closed slightly higher or dramatically higher. If price closed up, all of that period's volume is added. A tiny decline and a major decline also receive the same directional treatment: the entire period's volume is subtracted.
That simplicity is the indicator's strength and its limitation.
The OBV concept is commonly linked to the principle that volume precedes price. A rising OBV line while price remains inside a trading range can suggest that positive volume flow is strengthening before an obvious breakout appears. Conversely, falling OBV while price continues making higher highs can indicate weakening volume confirmation.
OBV shouldn't be confused with the Money Flow Index. MFI combines price and volume into a bounded momentum oscillator, whereas OBV is a cumulative directional volume measure. In an OBV vs. Money Flow Index comparison, OBV is generally more directly suited to trend-volume confirmation, while MFI is useful for examining buying and selling pressure alongside momentum extremes.
Accumulation Distribution Line and Money Flow: When A/D Is Better
A/D becomes particularly useful when the position of the closing price within the period's range matters.
Consider a volatile intraday candle with a wide high-low range. Price initially falls sharply but buyers recover most of the decline before the period closes near its high. OBV only compares the final closing price with the previous close. A/D captures the strong recovery inside the period by assigning a positive money flow multiplier.
This can make A/D more sensitive to subtle accumulation or distribution taking place beneath relatively modest price movements.
A rising A/D Line during sideways price action may indicate that periods are increasingly closing toward the upper part of their ranges. A falling line suggests the opposite. The indicator doesn't reveal whether “smart money” or any specific market participant is responsible; it only derives buying and selling pressure from price and trading volume.
For traders interested in how easily price responds to volume, Ease of Movement approaches the problem differently by comparing price displacement with volume rather than constructing a cumulative money flow line.
When OBV Is Better for Trend Confirmation
OBV is often more practical when the main question is simply: Does trading volume support the current price trend?
Suppose a cryptocurrency establishes an upward trend and both price and the OBV line continue making higher highs. The two moving in the same direction indicate that rising periods are carrying enough volume to keep the cumulative balance volume moving upward.
The opposite applies in a downtrend. Falling price combined with declining OBV shows that negative volume flow broadly agrees with the downward price action.
OBV can also be useful around chart patterns and breakouts. Price breaking above resistance while OBV also breaks above a prior high provides stronger volume confirmation than price moving higher while the OBV line remains flat or declines.
A Volume Oscillator can add another perspective here because it measures whether recent trading volume is expanding or contracting relative to its longer-term average rather than determining whether that volume is positive or negative.
For a live crypto example, a trader using Gate.com can compare an OBV or A/D signal with the price structure and trading volume shown on the BTC/USDT spot market. The goal isn't to trade simply because an indicator turns upward, but to check whether price action, volume flow and the current trend tell a consistent story.
Divergence Signals: Bullish Divergence and Bearish Divergence
Divergence is one of the most useful applications shared by both indicators.
A bullish divergence occurs when price makes lower lows while the A/D or OBV line forms higher lows or begins trending upward. The indicator is effectively saying that negative price movements are no longer receiving the same volume confirmation.
With A/D, a downtrend in price combined with an upward trend in the cumulative money flow line can mean periods are increasingly closing toward the upper part of their ranges. Buying pressure may be strengthening even though the stock price or crypto price continues falling.
A bearish divergence is the reverse. Price reaches a new high while A/D or OBV fails to confirm it or moves downward. That negative divergence suggests the upward trend may have weakening participation.
Divergences aren't automatic reversal signals. A strong price trend can continue for a considerable period while an indicator moves in the opposite direction. Price structure, support and resistance, volatility and momentum indicators still matter.
For example, ATR measures absolute volatility, while Donchian Channels identify price-range breakouts. Pairing those tools with volume analysis avoids asking one indicator to answer several unrelated questions.
Accumulation Distribution vs. OBV: Which Indicator Works Better in Different Markets?
| Trading situation |
Usually more useful |
Why |
| Confirming an established trend |
OBV |
Simple directional volume confirmation |
| Studying intraperiod buying/selling pressure |
A/D |
Uses close position inside the high-low range |
| Sideways trading range |
Both |
Divergence or accumulation may emerge before price breaks |
| Breakout confirmation |
OBV |
Easy comparison between price and cumulative directional volume |
| Wide intraday ranges |
A/D |
Captures where the period actually closed within the range |
| Markets with frequent gaps |
OBV may be easier to interpret |
A/D doesn't directly account for the previous close |
| Divergence analysis |
Both |
Each can reveal weakening price-volume confirmation |
Timeframe also changes how the indicator works. Shorter intervals produce more frequent changes in price and volume flow, which can increase noise. Longer timeframes generally smooth some of those fluctuations but respond more slowly to changing market conditions.
Asset liquidity matters too. Low-volume volatility in thinly traded markets can produce abrupt OBV changes based on relatively poor participation. A/D isn't immune to this problem because unreliable or irregular volume can distort its cumulative money flow calculation as well.
False Signals and Other Limitations
OBV's biggest weakness is its binary treatment of price changes. A close one cent above the previous closing price can add the same period's total volume as a much larger bullish move. One unusually high-volume period can therefore create a large OBV step that remains embedded in the cumulative line.
A/D has a different blind spot: price gaps. Because the money flow multiplier focuses on the current period's high-low range, it doesn't directly measure how far price moved from the previous closing price. A security might gap sharply lower and then close near the upper end of its new range, generating positive A/D money flow despite a substantial overall price decline.
Neither indicator directly measures momentum, volatility or trend strength. Tools such as Money Flow Index, Chaikin Money Flow, moving averages or price action analysis can provide complementary evidence.
Using more indicators doesn't automatically improve accuracy either. Combining several tools that measure essentially the same form of volume flow can simply repeat the same information.
Can Accumulation Distribution and OBV Be Used Together?
Yes. Using A/D and OBV together can be useful precisely because their calculations treat volume differently.
Suppose price is rising, OBV is rising and the A/D Line is also rising. OBV says positive periods are carrying sufficient trading volume, while A/D indicates that price is regularly closing toward the upper portion of its trading range. The two signals support the same broad interpretation through different calculations.
Disagreement can be even more informative.
If OBV rises but A/D falls, positive closes may still dominate the OBV calculation while the asset repeatedly finishes near the lower end of each period's range. That doesn't prove a reversal is approaching, but it gives the trader a reason to inspect price action more carefully.
The goal is confirmation, not certainty.
Accumulation Distribution vs. OBV: Which Is Better?
For straightforward volume confirmation of price trends, OBV is usually the simpler choice. Its cumulative addition and subtraction of volume makes trend agreement, breakouts and divergence signals easy to compare against a price chart.
Accumulation Distribution is better when the location of the closing price inside each period's range matters. Its money flow multiplier gives volume analysis more nuance and can expose changes in buying or selling pressure that aren't visible in OBV.
Neither wins every situation. OBV simplifies volume direction; A/D adds range-based context. Using them alongside price structure and other technical indicators can provide stronger evidence, but indicators based on historical price and volume cannot guarantee future price movements.
FAQs
Is Accumulation Distribution better than OBV?
Not universally. Accumulation Distribution may be more useful for analyzing buying and selling pressure within each period because it considers the closing price relative to the high-low range. OBV is generally simpler when the main objective is confirming whether directional trading volume supports a price trend.
What is the main difference between Accumulation Distribution and balance volume OBV?
A/D weights each period's volume using a money flow multiplier between approximately -1 and +1. OBV instead adds the entire period's volume when price closes higher than the previous period and subtracts it when price closes lower.
Can the Accumulation Distribution Line predict price reversals?
The A/D Line can reveal bullish or bearish divergence that sometimes develops before price reversals, but it cannot reliably predict when a reversal will occur. Divergence may persist while the current trend continues.
Why can A/D rise when price falls?
A/D evaluates where the closing price sits within the current period's high-low range, not whether it is above the previous period's close. Price can therefore decline from the prior close while finishing near the top of the current range, producing positive money flow volume.
Is OBV a leading indicator?
OBV is often described as a leading volume indicator because changes in its cumulative volume trend can appear before an obvious price breakout or reversal. That doesn't make OBV predictive in every case, and low-volume volatility, abnormal volume spikes and changing market conditions can create false signals.
Should traders use OBV and A/D together?
They can be complementary. Agreement between price, OBV and A/D can strengthen trend confirmation, while disagreement can highlight a market worth examining more closely. Traders still need price action, market structure and risk management because neither volume indicator guarantees future results.
Disclaimer: This content is for educational purposes only and does not constitute financial advice. Technical indicators use historical market data and can generate false or conflicting signals. Past market behavior does not guarantee future results.







