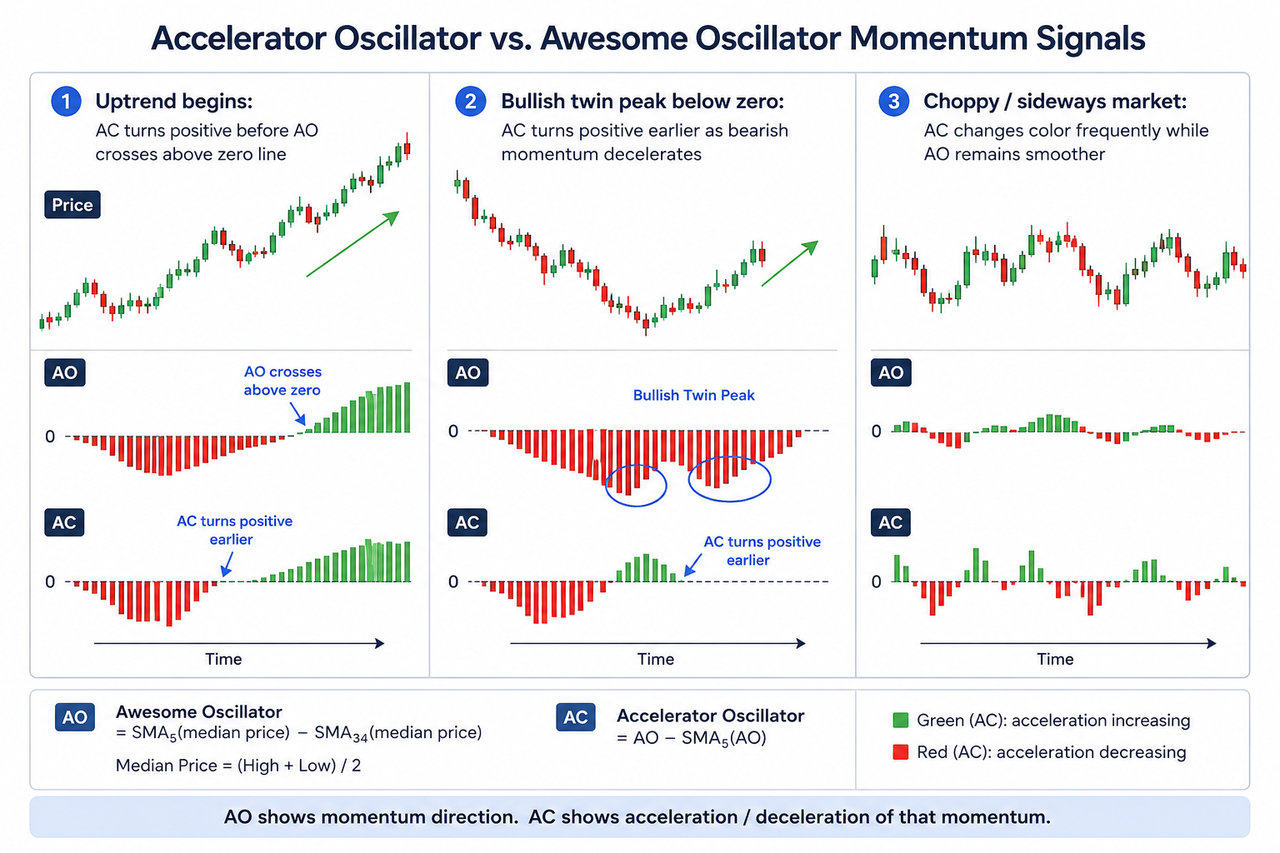
The Accelerator Oscillator vs. Awesome Oscillator: which is better for momentum trading question depends on whether a trader wants broader momentum confirmation or an earlier warning of acceleration and deceleration. The Awesome Oscillator belongs to the momentum-indicator family and calculates indicator values from short- and long-term averages of median price, with one average of median price subtracted from the other. Traders often use the Awesome Oscillator to identify bullish or bearish market momentum, possible trend reversals, and signals within an Awesome Oscillator trading strategy built around zero-line crossovers, twin peaks, saucers, and trend-line confirmation.
For most momentum traders, the Awesome Oscillator is the stronger primary indicator for defining market momentum and trend direction, while the Accelerator Oscillator is more useful for detecting earlier acceleration or deceleration within that momentum. AO generally produces cleaner conventional signals; AC reacts faster but can create more noise. The choice matters most to traders balancing early signals against confirmation and false-signal risk.
In practical Awesome Oscillator trading, AO and AC can be used across crypto, futures, stocks, and trading currency pairs in the forex market. Many trading platforms support both indicators, while other indicators such as the MACD indicator and Alligator indicator can help confirm direction, entries, and exit points. A reliable Awesome Oscillator strategy should still account for market conditions, especially in a bearish market or choppy periods where false signals are more common, before traders start trading from oscillator signals alone.
Key Takeaways
Awesome Oscillator (AO) measures broader price momentum by comparing a 5-period SMA with a 34-period SMA of median price.
Accelerator Oscillator (AC) is derived from AO using AC = AO − SMA(AO, 5) and measures acceleration or deceleration in market momentum.
AO is generally better for identifying overall bullish momentum, bearish momentum, zero-line shifts, twin peaks, and saucer patterns.
AC reacts faster and can warn that momentum is weakening before AO changes direction, but its higher sensitivity can also produce more false signals in choppy markets.
A practical trading strategy can use AO for trend and momentum context, then AC to refine entries, exits, or confirmation rather than treating either oscillator as a standalone buy or sell system.
Accelerator Oscillator vs. Awesome Oscillator: Key Differences
The central difference is momentum versus momentum acceleration. Bill Williams' Awesome Oscillator compares faster and slower moving averages of median price. The Accelerator Oscillator takes that AO value and compares it with AO's own five-period simple moving average. AC therefore measures a change in the momentum measure itself rather than directly comparing two price averages.
Feature
Awesome Oscillator
Accelerator Oscillator
Main purpose
Measures broader market momentum
Measures acceleration/deceleration of momentum
Core input
Median price
Awesome Oscillator
Formula
SMA5 median price − SMA34 median price
AO − SMA5(AO)
AO - SMA5(AO)
Relative speed
Slower, smoother
Faster, more sensitive
Zero-line crossover
Traditional AO signal
Not a standalone Williams signal
Typical signals
Zero cross, twin peaks, saucer
Consecutive green/red bars
Best role
Momentum/trend context
Earlier warning and timing
Noise risk
Lower relative to AC
Higher in choppy conditions
Practical pairing
Primary momentum view
Confirmation or entry refinement
The distinction resembles the broader problem faced with many momentum indicators: responsiveness can reveal a momentum shift earlier, but smoothing can reduce reactions to minor fluctuations. Neither characteristic is universally better.
What Is the Awesome Oscillator Indicator?
The Awesome Oscillator is a Bill Williams momentum indicator designed to compare short-term and longer-term market driving force. It uses the midpoint of each price bar rather than the closing price alone, meaning its underlying input is the median price:
Median Price = (High + Low) / 2
The standard Awesome Oscillator formula is:
AO = SMA(Median Price, 5) − SMA(Median Price, 34)
The 5-period simple moving average represents the faster component, while the 34-period simple moving average acts as the slow moving average. Understanding how a simple moving average works makes the calculation easier to interpret: AO rises when shorter-term median prices gain relative strength against their longer-term average and falls when that relationship weakens.
Positive values place the Awesome Oscillator above the zero line and indicate that its faster average is above the slower average, which is commonly interpreted as stronger bullish market momentum. Negative values place AO below zero and point to weaker short-term momentum relative to the longer-term measure. These conditions describe momentum rather than guaranteeing that price rises or falls next.
The Awesome Oscillator indicator is therefore particularly useful when the trader needs a broad visual answer to whether upward momentum or bearish momentum is strengthening, fading, or transitioning.
What Is the Accelerator Oscillator?
The Accelerator Oscillator, also called the Acceleration/Deceleration indicator or acceleration oscillator, measures whether the driving force represented by AO is itself speeding up or slowing down.
Its standard calculation is:
AC = AO − SMA(AO, 5)
AC = AO - SMA (AO, 5)
This relationship makes AC a derivative of the Awesome Oscillator. Instead of asking whether short-term market momentum is stronger than long-term momentum, AC asks whether the current AO value is stronger or weaker than its recent five-period average.
That extra calculation changes the timing. The Accelerator Oscillator can reverse direction before the Awesome Oscillator because acceleration must weaken before the broader driving force itself changes direction under Williams' framework. AC can consequently detect early momentum exhaustion, but an early warning is not the same as a confirmed potential trend reversal.
Green bars indicate that the current AC value has increased from the previous bar, while a red bar indicates that it has declined. Bar color describes the direction of acceleration change; a green bar can still appear below zero, and a red bar can appear above zero.
Awesome Oscillator Signals and the Zero Line
AO has a more structured set of traditional trading signals than AC. Three of the best-known Awesome Oscillator signals are the zero-line crossover, twin peaks, and saucer.
A zero-line crossover occurs when the Awesome Oscillator crosses from negative values to positive values or vice versa. A move above zero can indicate a shift toward bullish momentum, while a cross below zero can suggest bearish momentum is becoming dominant. The crossover reflects a change in the position of the 5-period SMA relative to the 34-period SMA.
The bullish twin peak pattern forms below the zero line. It requires a lower negative trough followed by another trough closer to zero while AO remains below zero between the two peaks. The traditional bearish version is reversed: a bearish twin peak forms above the zero line.
The saucer pattern uses at least three consecutive histogram bars and identifies a short change in histogram direction. In the traditional bullish setup, AO remains above zero while a falling bar sequence turns upward; the bearish version occurs below zero. These patterns can produce buy and sell signals, but sideways conditions can still produce false signals.
How Accelerator Oscillator Signals Differ
The Accelerator Oscillator's zero line has a different role. Under Bill Williams' traditional methodology, crossing the AC zero line is not treated as an independent trading signal. The trader instead watches the position relative to zero and changes in histogram color.
When a position agrees with the current driving force, the traditional AC oscillator strategy uses two confirming bars. Two consecutive green bars above zero may support a buy signal, while two consecutive red bars below zero may support a sell signal.
When the proposed position opposes the current driving force, stronger confirmation is required. Three consecutive green bars below zero may support a long setup, whereas three consecutive red bars above zero may support a short setup. Williams' rules also state that traders should not buy while the current AC column is red or sell while it is green.
These rules explain why AC can detect early changes without automatically becoming the primary trend signal. AC may begin rising below zero while broader bearish momentum remains intact. It is warning that downside acceleration is weakening; it is not yet proving that the trend direction has reversed.
Which Indicator Gives Earlier Momentum Signals?
The Accelerator Oscillator generally reacts earlier than the Awesome Oscillator because it measures changes in AO relative to AO's recent average. That sensitivity is its principal advantage.
Suppose price is falling and AO remains below zero. If bearish momentum begins losing force, AC may start printing green bars while AO itself is still negative. The trader receives information that momentum deceleration has started before AO reaches its own zero line.
However, faster does not automatically mean better. AC can react to relatively small momentum shifts that never develop into meaningful price reversals. In a range, alternating green and red bars can produce repeated early signals without sustained follow-through. AO's broader 5/34 SMA structure makes it less susceptible to some minor fluctuations, although AO can also produce false signals around its zero line.
This is similar to the trade-off between speed and stability found in ROC vs. RSI, where a faster momentum measure can respond earlier while a smoother indicator may offer more stable interpretation.
Which Is Better for Identifying Trend Direction?
Awesome Oscillator is generally better suited to defining the broader momentum direction. Its positive and negative values directly show the relationship between short-term and longer-term median-price moving averages, and the AO trading framework includes formal zero-line signals.
AC's value is more specific: it describes whether that underlying momentum is accelerating or decelerating. An AC green bar does not necessarily mean the trend is bullish, just as a red bar does not necessarily mean the market is bearish.
For stronger trend confirmation, traders can combine the momentum reading with a directional tool. A rising EMA 20 can indicate short-term trend direction, while an ADX indicator can assess whether a trend has meaningful strength. Momentum and trend indicators answer related but different questions.
Awesome Oscillator vs. Accelerator Oscillator Trading Strategy
A useful way to combine the indicators is to assign each one a different responsibility: AO establishes momentum context; AC looks for a change in the speed of that momentum.
Consider a trader analyzing the live BTC/USDT chart. Price is above a rising moving average, and AO remains above zero, suggesting that shorter-term momentum is stronger than longer-term momentum. AC then changes from red to consecutive green bars after a pullback.
The combined reading is more informative than either signal alone. AO indicates that the wider bullish momentum structure remains intact, while AC suggests that momentum acceleration may be rebuilding. The trader can then examine support, resistance, volume, candle structure, and risk before treating it as a possible entry.
The opposite sequence can warn of weakening bullish momentum. If AO remains positive but AC prints consecutive red bars, acceleration is slowing even though the broader AO trend signal has not changed. If AO later forms bearish structure or crosses below zero alongside a price breakdown, the combined evidence becomes stronger.
This layered approach also avoids duplicating indicators with identical functions. MACD uses moving average convergence divergence, a signal line, and histogram relationships to assess momentum differently, while RSI emphasizes the magnitude of recent gains and losses.
AO or AC: Which Is Better in Different Market Conditions?
The better oscillator depends partly on the market regime.
Market condition
More useful starting point
Reason
Strong directional trend
AO
Cleaner view of broader momentum
Early momentum exhaustion
AC
Faster response to deceleration
Breakout confirmation
AO
Zero-line and broader momentum context
Pullback entry timing
AC with AO
AC can detect renewed acceleration
Choppy sideways market
Neither alone
Both can produce false signals
Potential reversal
AC warning, AO confirmation
Balances speed with reliability
Traders prioritizing reliability and clearer trend signals will usually favor AO. Traders prioritizing early detection of momentum shifts may find AC more useful, provided they accept greater noise.
Using both can resolve much of this trade-off because AC can detect early while AO determines whether the broader driving force eventually supports the signal.
Risks and Limitations
Neither oscillator predicts future prices. Both are calculated from historical high and low data, so their signals reflect changes already occurring in price behavior rather than knowledge of what the market will do next.
False signals are especially important with AC. Because the indicator responds to changes in AO rather than waiting for broader momentum to turn, consecutive green bars or consecutive red bars may appear during short-lived fluctuations. Volatile and range-bound financial markets can therefore create repeated signal changes.
AO is smoother, but it can still whipsaw around the zero line. A zero-line crossover indicates a momentum shift in the indicator's moving-average relationship; it does not automatically confirm a trend reversal.
Settings and timeframe also matter. The traditional Awesome Oscillator settings use 5 and 34 periods, while AC adds a five-period SMA of AO. Changing those inputs alters sensitivity and makes historical interpretations less directly comparable with the standard Williams formulas.
Finally, no oscillator provides complete information about liquidity, support and resistance, volatility, market structure, news, leverage, or position sizing. Momentum should therefore act as one component of technical analysis rather than a complete trading system.
Conclusion
For Accelerator Oscillator vs. Awesome Oscillator, AO is usually the better primary momentum indicator, while AC is the faster secondary tool. Awesome Oscillator shows whether short-term market momentum is stronger or weaker than its longer-term reference and provides recognizable signals through zero-line crossovers, twin peaks, and saucer formations.
Accelerator Oscillator goes one step further by measuring whether AO's driving force is accelerating or decelerating. That can reveal momentum exhaustion sooner, making AC useful for early warnings and entry timing, but its sensitivity also increases noise and false-signal risk.
The strongest practical use is therefore complementary: use AO to establish broader momentum direction and AC to judge whether that momentum is gaining or losing speed. Price structure, trend confirmation, volatility, and risk management remain necessary because neither indicator should be used as a standalone trading signal.
FAQ
Is Accelerator Oscillator better than Awesome Oscillator?
Not universally. Awesome Oscillator is generally more useful as the primary momentum and trend signal, while Accelerator Oscillator reacts faster to acceleration changes. AC can therefore provide earlier signals but also tends to be more sensitive to market noise.
Does the Accelerator Oscillator cross the zero line like AO?
Yes, AC can move above and below zero, but Bill Williams' traditional interpretation does not treat the AC zero-line crossover as a standalone trading signal. Bar color, sequence, and the indicator's position relative to zero are more important in the traditional AC methodology.
What does a bullish twin peak mean on Awesome Oscillator?
A bullish twin peak forms below the zero line when a negative trough is followed by another trough that is closer to zero, with the histogram remaining negative between the two peaks. It can signal improving momentum but does not guarantee that price will reverse upward.
What is the Awesome Oscillator saucer pattern?
A traditional saucer consists of at least three histogram bars showing a short reversal in AO's direction. The bullish version occurs above zero, while the bearish version is reversed below zero. It is a momentum signal rather than certainty about future price direction.
Can AO and AC be used together?
Yes. AO can define broader momentum while AC tracks whether that momentum is accelerating or decelerating. Agreement between price structure, AO, and AC can provide more context than relying on either oscillator alone.
Do AO and AC work on different timeframes?
Their formulas can be applied across chart timeframes because they use each chart's high and low price data. Signal behavior still varies with timeframe, volatility, liquidity, and market conditions, so the same pattern can produce different outcomes across assets.
Disclaimer
This content is for educational purposes only and does not constitute investment advice. Technical indicators can produce false signals, and historical price or indicator behavior does not guarantee future performance. Trading decisions should consider market conditions, personal risk tolerance, position sizing, and independent research.
Author: Jared
Disclaimer
* The information is not intended to be and does not constitute financial advice or any other recommendation of any sort offered or endorsed by Gate.
* This article may not be reproduced, transmitted or copied without referencing Gate. Contravention is an infringement of Copyright Act and may be subject to legal action.
DEX aggregators integrate order data, price information, and liquidity pools from multiple decentralized exchanges, helping users find the optimal trading path in the shortest time. This article delves into 8 commonly used DEX aggregators, highlighting their unique features and routing algorithms.
The report shows that in Q1 2026, the crypto market will reach a stage of structural maturity, with Derivative trading making up more than 90% of total trading volume, exceeding $20 trillion. As Spot demand weakens, liquidity will become even more concentrated in top exchanges, reflecting a more cautious market sentiment and a shift toward leveraged and institutional trading.