Square
Following
Hot
News
Notifications
Profile
Share your thoughts
placeholder
Article
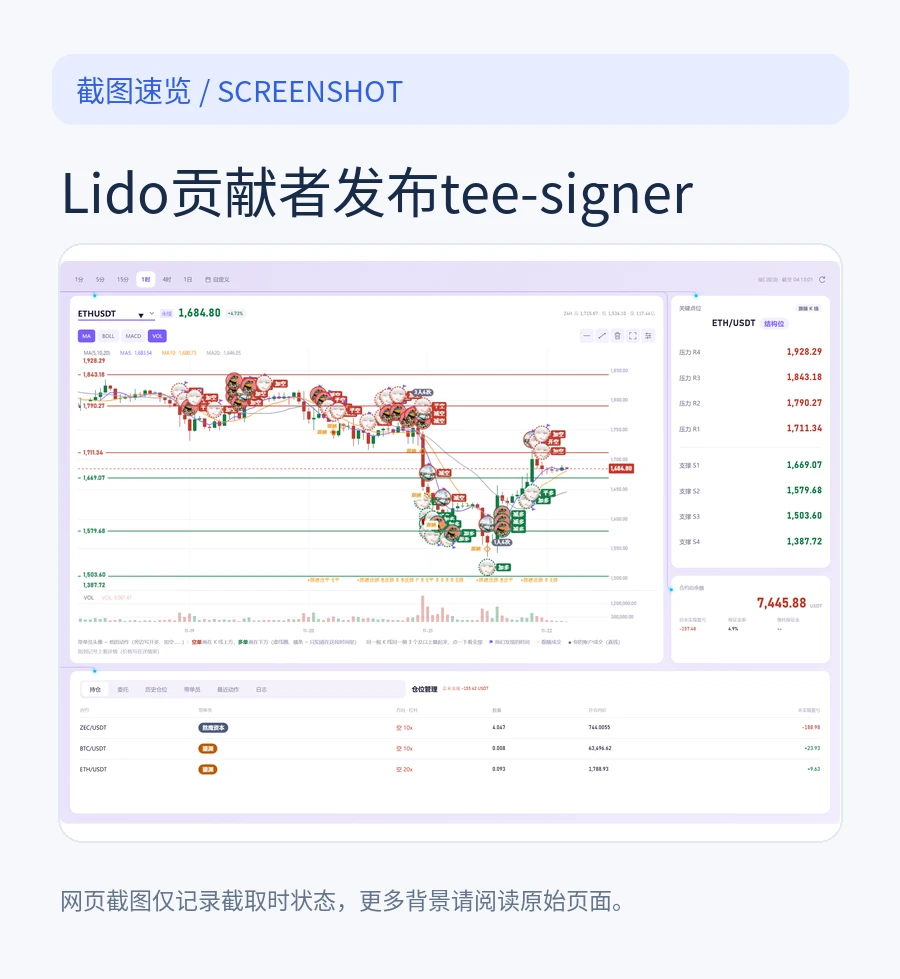
$ETH The private-key defenses for staking nodes are getting a major hardware-level security upgrade. Lido engineering lead gusakov revealed a key development: the team has officially released tee-signer, a TEE-native signer. The solution runs BLS signing directly inside a trusted hardware environment. It is designed to guard against private-key theft and node slashing risks during malicious attacks. The system supports mainstream cloud confidential computing environments and uses immutable logs to block double-signing. The biggest fear for stakers is hackers breaking through, so strengthening
post-image
ETH-1.26%
Go long at 4-hour support $QNT . Hold 141, next target 150. If it breaks below 136, I’ll abandon this idea. Rationale: - On the 4-hour timeframe, price is at 142; buyers need to defend this level to push the price higher. - The daily chart is above EMA200 (124), strengthening confidence in this trade setup. Long 141.3–142.0 Take profit 144.8 / 147.0 / 150.2 Stop loss 136.3 This is not investment advice; manage your position size yourself.
post-image
QNT+4.79%
Trenches
IDOL
I
bade
b
IDOL
0x3b...ab07
Market Cap
$.
Change
.
24h Vol
$.
Holders
.
PIEVERSE
P
bade
b
PIEVERSE
0x0e...25a9
Market Cap
$.
Change
.
24h Vol
$.
Holders
.
FIONA
F
bade
b
FIONA
B34n...pump
Market Cap
$.
Change
.
24h Vol
$.
Holders
.
Singularity
S
bade
b
Singularity
7R4M...pump
Market Cap
$.
Change
.
24h Vol
$.
Holders
.
CLAUDIA
C
bade
b
CLAUDIA
2j5S...W2ZM
Market Cap
$
Change
.
24h Vol
$.
Holders
.
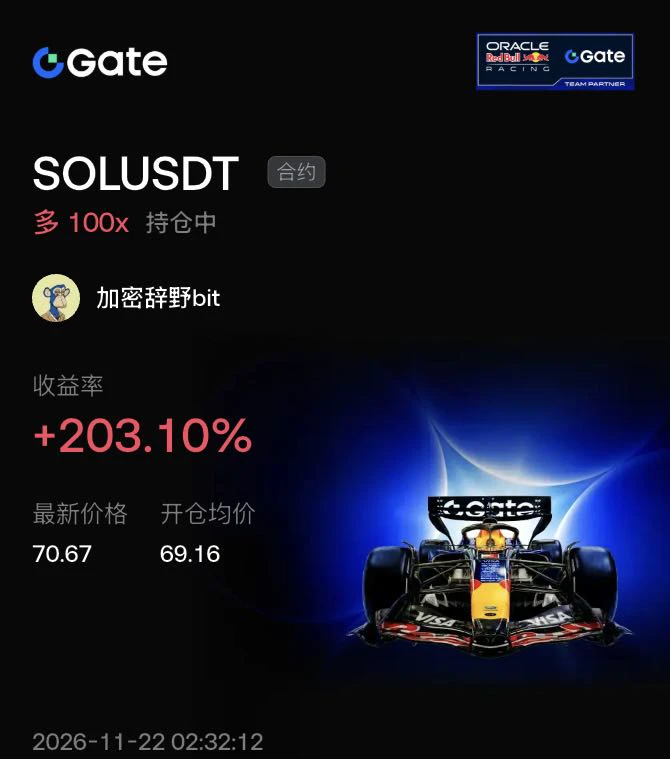
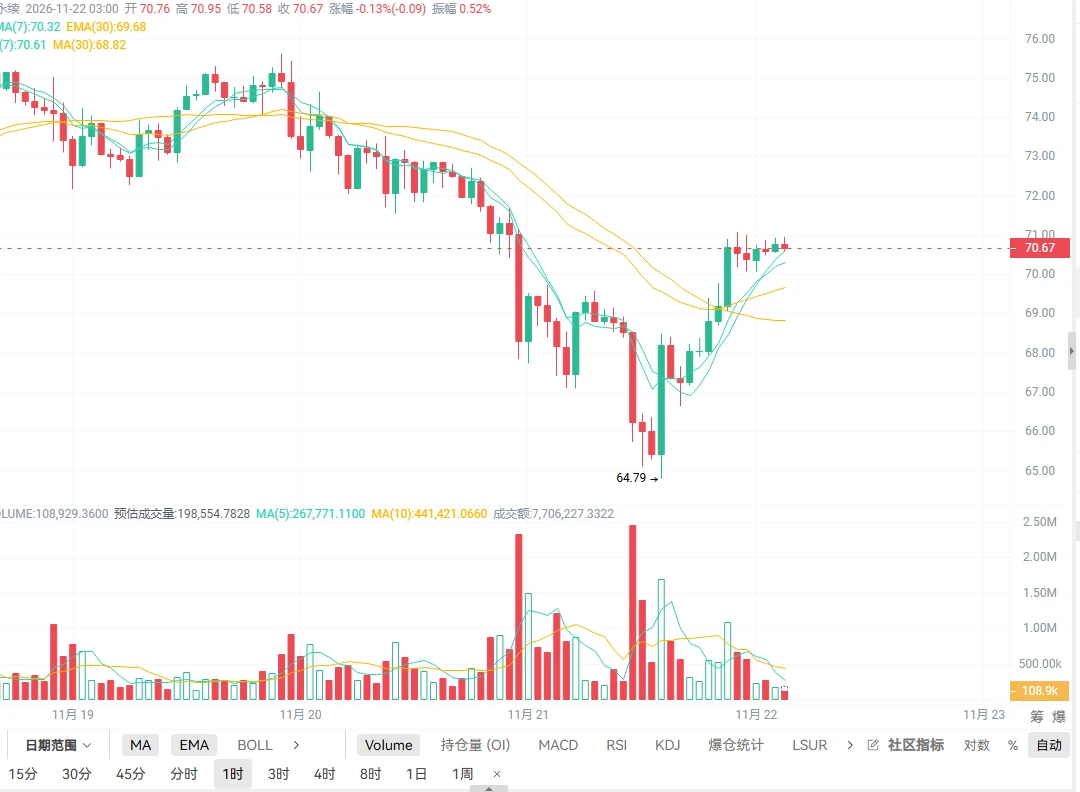
$SOL When trading, you must clearly understand the difference between higher and lower timeframes. The current rally in major coins after this sharp crash is basically just a brief recovery, so don’t mistake it for a reversal.

Look at this 1-hour chart: SOL plunged from 75 to 64.8—a brutal drop. After stabilizing at the bottom, it made a V-shaped rebound. I entered at 69, the right-side confirmation point, and went long with 100x leverage. I caught the profits from this sentiment-driven recovery, which pushed straight up to 70.67, netting 203%!

Why emphasize “brief recovery”? Because there’s
post-image
SOL-0.77%
BTC-0.65%
ETH-1.23%
  • 1
$BR has already met all my expectations for this setup. That's it for today. Taking profits. Looking at $VVV and $XRP .
post-image
BR+6.00%
VVV+0.37%
XRP-1.15%
The futures market is clearly heating up, with $IDOL surging ahead with a gain of +52.09%, $SKYAI close behind with a +32.25% rise, and $PIEVERSE steadily posting +22.71%. Overall market sentiment is strong, and capital is searching everywhere for a breakout opportunity—who will be the next asset to take the baton in this wave? Risk warning: Futures leverage magnifies both gains and losses, so be sure to manage your position size when chasing highs. (The above content represents personal opinions only and does not constitute investment advice. Please view market risks rationally.)
post-image
IDOL-6.71%
SKYAI-7.58%
PIEVERSE+0.58%
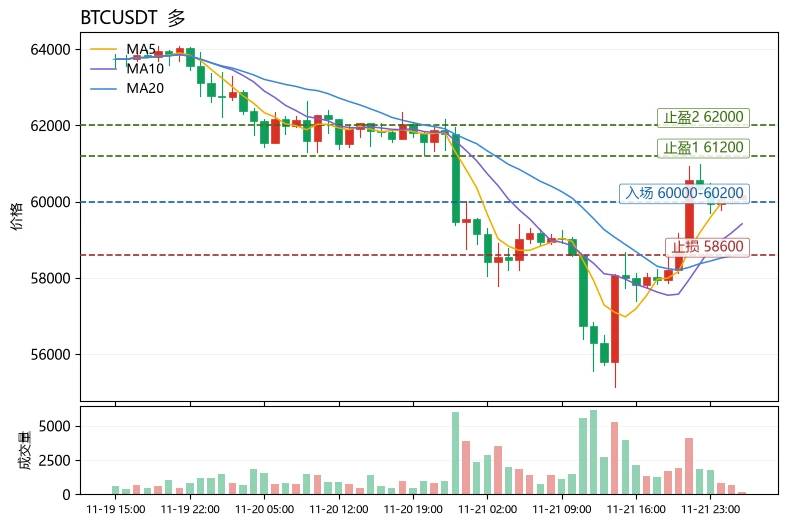
$BTC Bottom line: Short-term outlook is bullish, but only buy on pullbacks—don’t chase highs. The moving averages remain in a bullish alignment (MA5=60121.2 above MA20=58625.5), and the MACD histogram at +387 remains positive, so the trend is intact. However, RSI at 57.1 is merely neutral-to-strong, not overbought, while the upper Bollinger Band at 61266.7 is immediate resistance. With the current price of 60190 leaving limited room to the upper band, chasing longs offers an unfavorable risk-reward ratio.
Structurally, the price is trading between the middle and upper Bollinger Bands, placing
post-image
ZEC+1.16%
GRAM-0.97%
$XRP Heavy short: XRP is nearing a key resistance zone after a sharp rebound. If it fails to break higher, it could fall again and test lower support levels—the sellers may take control. Short $XRPEntry: $0.9360–$0.9450Stop loss: $0.9600Take profit 1: $0.9169Take profit 2: $0.9000Take profit 3: $0.8843Take profit 4: $0.8700Trade here $XRP : 👇
post-image
XRP-1.15%
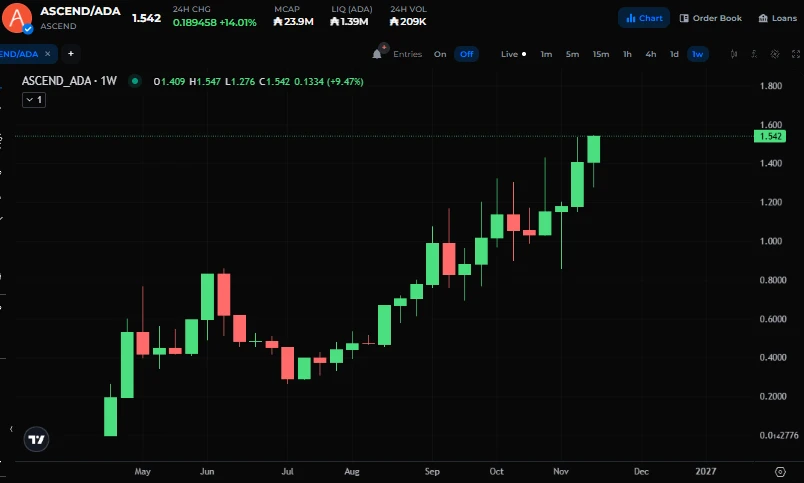
Midnight's perpetuals platform $ASCEND hits a new ATH🚀
post-image
NIGHT-3.07%
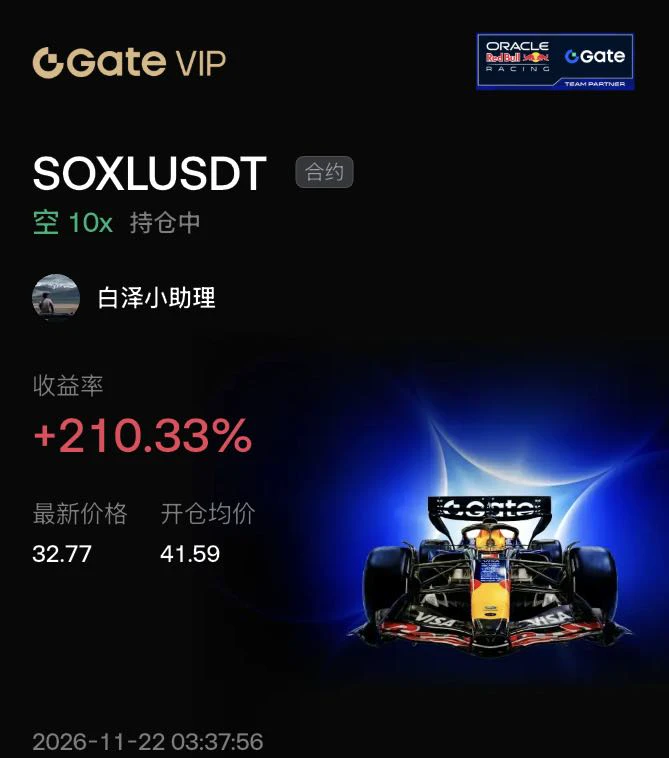
Have you checked $SOXL overhead supply?

In-depth analysis: Dense supply below 41.59 loosened, and after the neckline broke, buying collapsed, driving the price down to 32.77. I made 210% by trading the breakdown in supply. Fail to hold below the peak and it’s a guaranteed wipeout. Do you watch the lower edge of the vacuum when you trade? $ETH #BTC跌破6万美元关口 $BTC
post-image
SOXL-1.16%
ETH-1.23%
BTC-0.65%
  • 1
I just opened a quick short trade at $O and am entering now, with a sell price of 0.6200 or 0.6350. First target: 0.6000; second target: 0.5800; third target: 0.5600; final target: 0.5400++; stop-loss above 0.6750
post-image
Ether has also bounced from the lows, but to be clear: this rebound is a corrective bounce following the decline, not a signal of a trend reversal.

Looking at the cycle structure: 4-hour chart: Consecutive bearish candles previously broke through multiple support levels. The broader bearish structure remains intact, with moving averages still exerting downward pressure. Although the price has recovered from the lows and indicators are moving up from oversold territory, volume has not been strong enough to follow through during the rebound, and the layers of resistance above will not be easy t
post-image
ETH-1.23%
Stablecoins Move Billions. So Why Aren't We Using Them to Buy Everyday Things?
🧵 1/5
Stablecoins have already demonstrated that moving money on a blockchain is possible at an enormous scale. Yet, walk into an ordinary shop or visit an online store, and you'll still find that traditional payment methods are much easier to use.
That's an interesting contradiction.
If stablecoins can move billions across blockchain networks, why haven't they become a normal way to pay for groceries, subscriptions, clothes or other everyday purchases?
The problem isn't simply whether the money can move. It's eve
post-image
Yang Guang bit | November 22 $SOL Oversold rebound nearing mid-term resistance; short with the trend amid whale selling pressure
【Today's Outlook】
Entry timing: Price rebounds to the 71.5–73.5 range
Stop-loss: 75.0
Take-profit targets:
First target: 68.5–67.5
Second target: 66.0–64.8
【Key Takeaway】
On the geopolitical front, in sync with BTC and ETH, the geopolitical premium faded after Black Friday. A recovery in market risk appetite has driven an oversold rebound across the crypto sector, but the agreement has yet to be finalized, so volatility may continue. Expectations of Fed rate hikes re
post-image
SOL-0.74%
🔹 NVIDIA Interim CEO Colette Kress Faces a “Glass Cliff” as She Must Deal With Jensen Huang’s Legac
live-cover
LIVE81
BTC-0.67%
XAUUSD-2.40%
XAU+0.38%
ETH-1.23%
NVDA-0.35%
$IDOL This rally is pretty intense—up 52.3% in 24 hours, with futures trading volume surging to 123.7 million USDT. The current price is 0.032374, just 1.3% below the 24-hour high of 0.032785.
Looking at the chart, for bulls to push higher, they first need to break through 0.032785 and hold above it to open up room for further gains; 0.020182 remains the key support to watch closely. On the 1-hour chart, the price is above the 21 EMA, and the RSI is nearing 80, signaling overheated short-term sentiment.
The question is: can buyers keep stepping in and push the price to new highs? $IDOL $MMT
post-image
IDOL-6.71%
MMT-2.35%
ENSO-3.03%
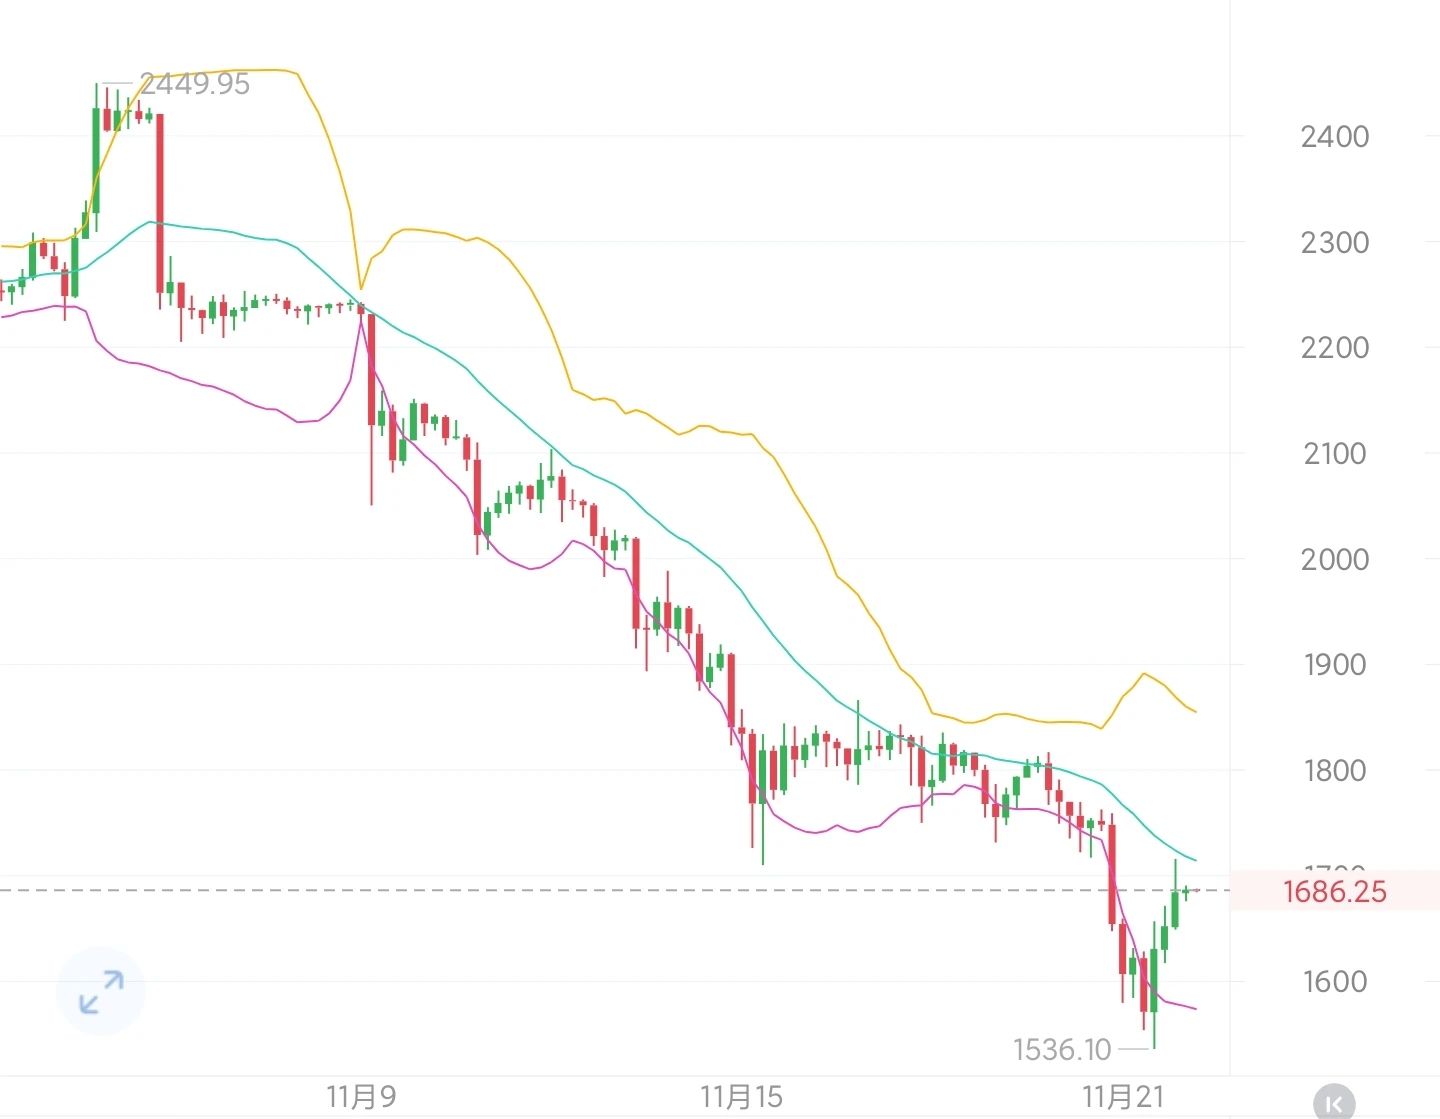
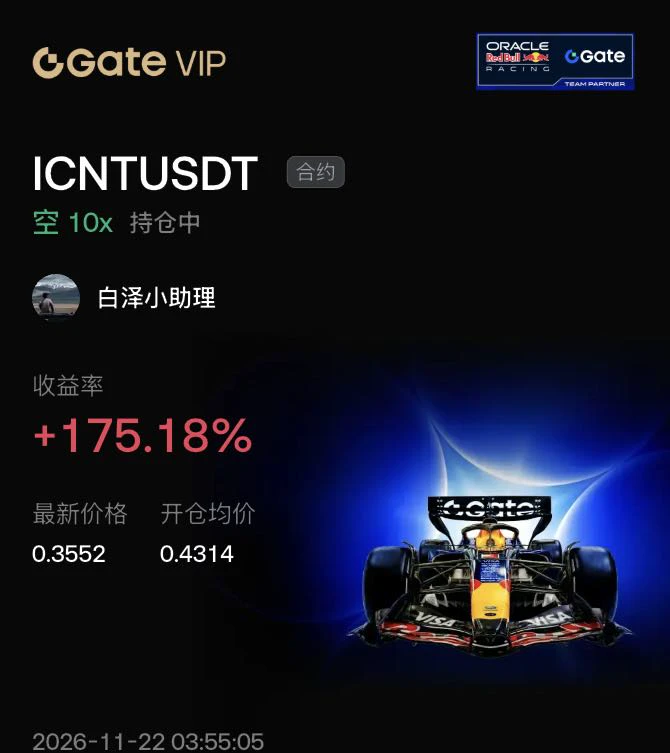
From November 20 to 21, Bitcoin fell below 62000, hitting a four-month low, and the Fear Index was just 12. Coins in the decentralized cloud and AI agent sectors, which had been rising against the market in the days before, began retreating together over those two days.

$ICNT had no new developments of its own and simply followed the market down. It had risen more than 50% over 30 days, and the gains it had made during that run were also the first to be sold off when prices fell.

These projects share a common problem: the new users brought in by a launch are one-time users. Once the hype fa
post-image
ICNT-10.47%
AKE+6.39%
  • 1
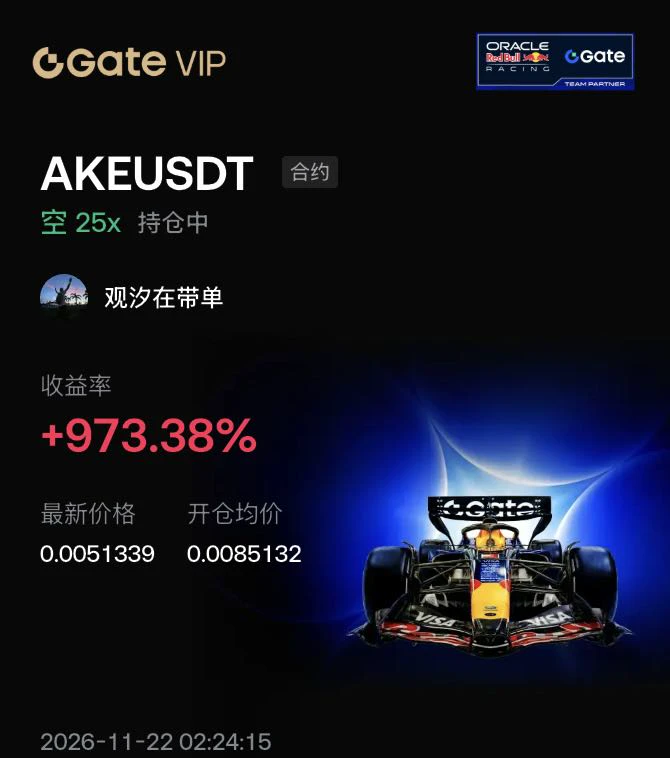
At 2 a.m., the price plunged to 0.0051339, with the short position up +973%—these “wake up and make money” trades are actually the result of staying up and grinding it out.

AKE is a token for an AI game-generation platform on BNB Chain, with a total supply of 100 billion. Only about 23% is currently circulating, and unlocks will continue through 2029. Early on, the “AI + gaming” narrative sent it sprinting from 0.00017 to 0.1467. It has now fallen more than 96% from its peak and dropped over 50% in the past 7 days—a classic major downtrend following a parabolic peak.
$BTC
Entry: On the 4-hou
post-image
BTC-0.65%
ETH-1.23%
UAI-7.51%
Laying out the November candlesticks, the entry price for this move, $CYBER , was exactly the high on November 12.

Here’s how that stretch played out: On November 5, the exchange resumed withdrawals, and it rose 51% in a single day. On the 6th, it surged again, reaching around 0.40 intraday, then headed steadily downward. It fell 18.4% on the 7th, 9% on the 8th, and 11.6% on the 11th. On the 12th, it surged to 0.2637 but couldn’t hold. From the 13th to the 19th, it closed lower every day, grinding down from 0.24 to 0.20.

On the 20th, it hit an intraday low of 0.2001, a new all-time low. On t
post-image
CYBER-5.14%
BTC-0.65%
AKE+6.39%
  • 1
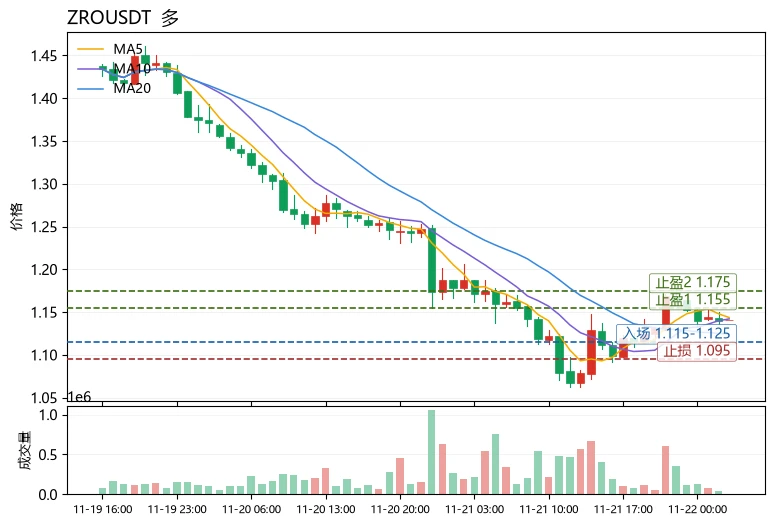
$ZRO Key levels: 1.178 above is resistance at the upper Bollinger Band, while 1.071 below is the support zone at the lower Bollinger Band and below MA20; 1.10 is the short-term dividing line between bulls and bears. The current price is 1.141, down 3.96% over 24h, with trading volume of only 8.4M USDT, indicating thin liquidity. The 30-candle range is 16.74%, placing volatility in the elevated range. Under this structure, position size should be cut to less than half the usual amount.
Technical analysis: MA5=1.1436 remains above MA20=1.1243, and the MACD histogram at +0.008688 remains bullish
post-image
ZRO-2.59%
RENDER+0.47%
ICP-1.14%
Market Update
live-cover
LIVE1,913
BTC-0.67%
Load More

Join 40 M users in our growing community

⚡️ Join 40 M users in the crypto craze discussion

💬 Engage with your favorite top creators

👍 See what interests you

Trending Topics

BTCBreaksBelow60K

2.1M Views29.9K Discussing

BTC fell below $60,000 on November 20 for the first time since July, alongside a tech stock selloff and broader pressure on risk assets. Will $60K become resistance, or can BTC quickly reclaim it? What price or volume signals would convince you that selling pressure is easing?

GateDirectIPOPhase3ANTAllocates92100Shares

786K Views4.9K Discussing

NvidiaDropsNearly14Percent

329.2K Views7.6K Discussing

View More