Square
Following
Hot
News
Profile
Share your thoughts
placeholder
Article
#GateRanksTop2AcrossMultipleCategories Gate Ranks Top 2 Across Multiple Categories — A Strong Milestone!
Earning a top-two position across multiple categories is a meaningful achievement for Gate. It reflects the platform’s growing presence, consistent development, and efforts to provide a better experience for its global community.
In a competitive crypto industry, progress comes from innovation, reliability, and continuous improvement. Recognition across different categories also highlights the importance of building a platform that serves diverse user needs.
Congratulations to the Gate team
post-image
DevilQueen
#GateRanksTop2AcrossMultipleCategories Gate Ranks Top 2 Across Multiple Categories — A Strong Milestone!
Earning a top-two position across multiple categories is a meaningful achievement for Gate. It reflects the platform’s growing presence, consistent development, and efforts to provide a better experience for its global community.
In a competitive crypto industry, progress comes from innovation, reliability, and continuous improvement. Recognition across different categories also highlights the importance of building a platform that serves diverse user needs.
Congratulations to the Gate team and community on this milestone! Looking forward to seeing what comes next.
#Gateio #CryptoCommunity #CryptoNews #Blockchain
🔹 Anthropic rakes in $33.2 billion in revenue in just nine months! Growth is astonishing, yet losse
live-cover
LIVE2,329
Trenches
ZIG
Z
bade
b
ZIG
0x8c...1145
Market Cap
$.
Change
.
24h Vol
$.
Holders
.
STONK
S
bade
b
STONK
6GmA...UNgx
Market Cap
$.
Change
.
24h Vol
$.
Holders
.
AGT
A
bade
b
AGT
0x5d...e274
Market Cap
$.
Change
.
24h Vol
$.
Holders
.
CAPY
C
bade
b
CAPY
5DnW...vg2g
Market Cap
$.
Change
.
24h Vol
$.
Holders
.
MAMESUKE
M
bade
b
MAMESUKE
SCGB...STNK
Market Cap
$.
Change
.
24h Vol
$.
Holders
.
Bulls vs bears at peak intensity! Key 4H decisive levels for [BTC/ETH]
live-cover
LIVE2,451
The Clearing House's strategy chief says US banks asked for "a party in the center that clears and settles each bank's tokenized deposits."
Quant is building it.
TCH's CHIPS network averaged $2.014 trillion a day in 2025.
@quantnetwork
#MercadoBitcoinHitBy46MHack
Mercado Bitcoin Hit By 46M Hack - Clear And Verified Read
Brazil's largest crypto venue Mercado Bitcoin lost about 46 million USD on Monday, in a week that is now seen as worst ever for crypto security.
What Happened
Venue confirmed a security incident on Monday Nov 2. Blockchain trackers estimated drain at 40 to 46 million USD, with Arkham putting figure at 46.3 million USD. Attack spread across at least 10 blockchain networks, including Ethereum, Bitcoin, Solana, Arbitrum, Avalanche and BNB Chain.
Method was not a smart contract bug. Attackers used valid signing
SOL-0.77%
ARB+1.17%
AVAX-0.10%
ETH-1.26%
BTC-0.67%
  • 38
  • 1
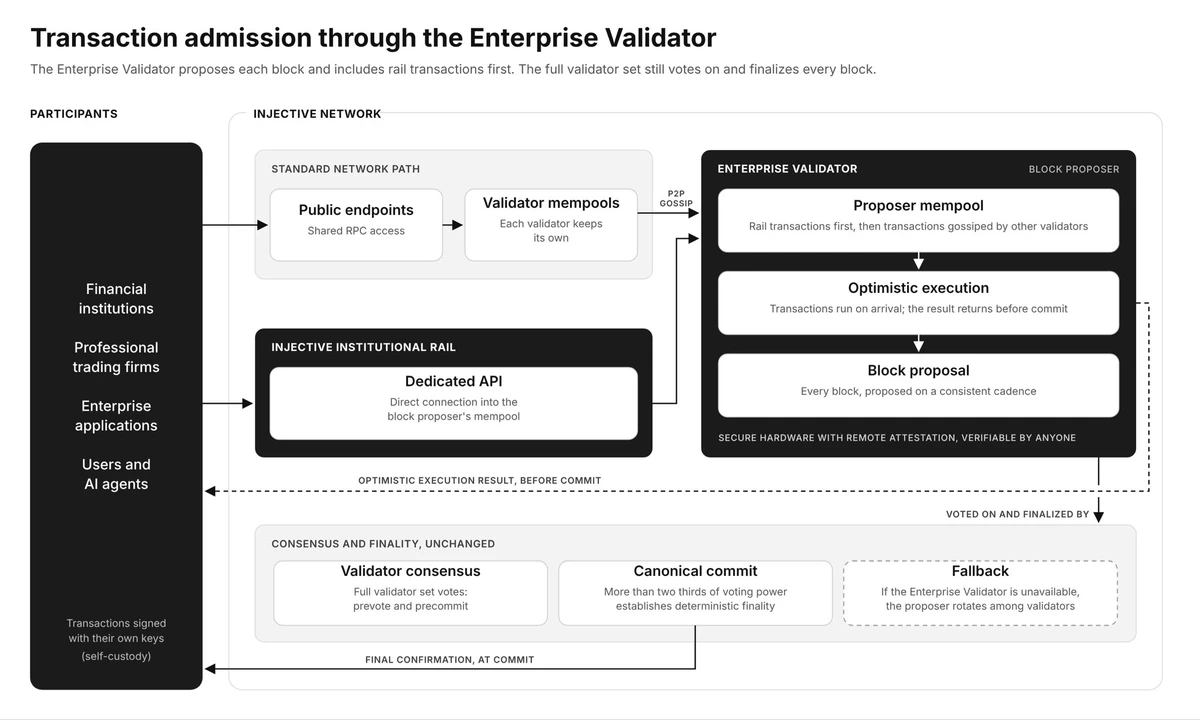
$INJ is one of those rare projects that actually translate their ideas into real work.
They just unveiled the Institutional Rail, a dedicated gateway for banks, funds, and enterprises to connect straight into the network.
The rest of the chain stays the same.
But institutions are getting their own direct connection.
Good to see something real come out of this.
post-image
INJ-1.67%
Keep your keys on your VPS for full control over execution & risk paths—unlike cloud vendors. Own your bot's infrastructure completely. 🔑 See the difference: #DeFi #Automation
This rogue coin just doesn’t play by the rules. The number of people liquidated worldwide is still under 1,000, and the market maker has kicked off the AGT redemption season$AGT
post-image
AGT-26.77%
  • 1
#WCTCS9 BTC Market Analysis
Bitcoin Price Nears $75.6k Danger Zone as ETF Investors Withdraw $398 Million
On Tuesday (November 3), BTC, the leading cryptocurrency, traded at around $76,585 as investors assessed the market impact of declining inflows into spot Bitcoin exchange-traded funds (ETFs) and the potential movement of stolen assets between blockchain networks. Technical indicators also show that Bitcoin’s rebound remains fragile, with analysts closely watching support at $75,597 for signs of a deeper correction.
Bitcoin ETF Outflows Signal Waning Institutional Investment Interest
Instit
post-image
ThisIsTranslateContent:
#WCTCS9 BTC Market Analysis
Bitcoin Price Nears $75.6k Danger Zone as ETF Investors Pull $398 Million
On Tuesday (November 3), the leading cryptocurrency BTC was trading at around $76,585 as investors assessed the decline in inflows into spot Bitcoin exchange-traded funds (ETFs) and the potential market impact of stolen assets moving between blockchain networks. Technical indicators also show that Bitcoin's rebound remains fragile, with analysts closely watching support at $75,597 for signs of a deeper correction.
Bitcoin ETF outflows signal weakening institutional investor interest
Institutional demand for Bitcoin appears to be losing momentum as investors continue to reduce their exposure to crypto investment products. According to SoSoValue, U.S. spot Bitcoin ETFs recorded net outflows of about $202.59 million in the final week of October. Outflows continued this week, with $398.26 million leaving the funds on Monday, reflecting cautious positioning by institutional investors. The outflows come as overall ETF demand deteriorated this month. October ended with net outflows of $515.03 million, breaking a three-month streak of monthly inflows. This reversal suggests institutional investors are becoming less willing to accumulate Bitcoin amid rising market uncertainty.
For Bitcoin, weakening institutional demand and uncertainty around stolen assets are creating an unfavorable environment for a sustained rebound.
Bitcoin weekly chart shows $75,597 as key support. After four consecutive weeks of declines, Bitcoin's technical outlook remains cautious. Bitcoin fell about 2.25% last week, and the decline continued into Tuesday's session, with the price currently trading around $76,500.
On the weekly chart, the next major downside target is near $75,597, corresponding to the 50-week simple moving average (SMA). A sustained break below this level, especially a weekly close below it, could accelerate bearish momentum and put the 200-week SMA (around $67,776) at risk.
Momentum indicators also show buyers are weakening. The weekly Relative Strength Index (RSI) is near 49, slightly below the neutral threshold of 50. While this reading does not confirm strong bearish momentum, it indicates that the previous bullish advantage has substantially diminished.
Meanwhile, the Moving Average Convergence Divergence (MACD) histogram remains in positive territory, but its bars are shrinking, indicating that upward momentum is fading.
Overall, these indicators show that buying momentum is weakening, rather than confirming a long-term bearish reversal. On the positive side, Bitcoin must first reclaim the 61.8% Fibonacci retracement level at around $78,661. A sustained recovery above this resistance could pave the way toward the 50% Fibonacci retracement level at $87,823, followed by the 100-week simple moving average near $89,134. However, buyers may need stronger institutional participation and improved market sentiment to support such a move. Bitcoin's daily chart presents a relatively more balanced outlook, although bearish momentum remains evident.
Bitcoin is currently priced around $76,587, slightly above its 200-day exponential moving average (EMA) of about $76,466. This moving average provides significant support and could prevent a deeper correction.
In addition, Bitcoin remains below the 100-day exponential moving average (EMA) at $77,821 and the 50-day EMA at around $80,287, indicating that sellers continue to dominate the short-term trading range. The daily RSI is near 34, reflecting weak buying momentum and intensifying bearish pressure.
Likewise, the MACD histogram remains below zero, indicating that downward momentum has not fully faded. For a meaningful rebound, Bitcoin needs to reclaim the $80,287 resistance level. A successful break above it could encourage bulls to target the psychological $85,000 level.
Bitcoin's current price has fallen below the 100-day EMA at $77,821, making the 200-day EMA (around $76,466) the next key support. A break below the 200-day EMA would further weaken Bitcoin's medium-term technical structure and increase the likelihood of a broader correction. A recovery above $78,661 could provide an initial sign that buyers are returning; but reclaiming $80,287 would be stronger evidence that momentum is improving. On the other hand, continued ETF outflows, further escalation in market uncertainty, or a break below $76,466 could prompt sellers to target weekly support near $75,597.#广场交易达人 $BTC ‌
repost-content-media
BTC-0.67%
  • 2
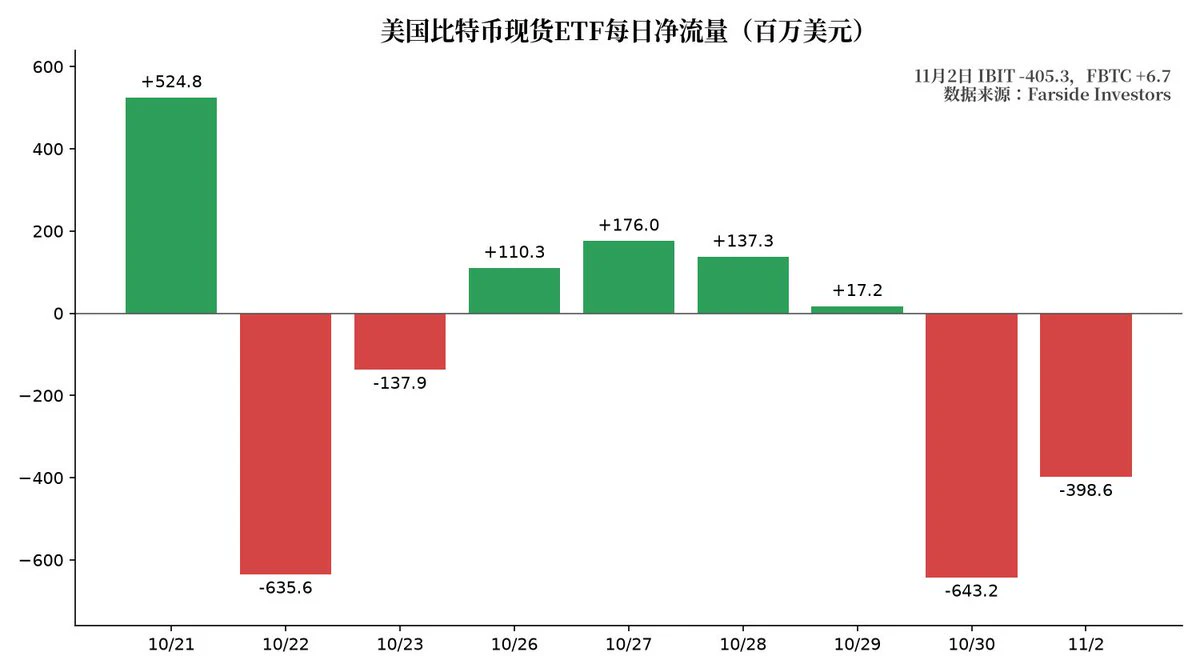
BlackRock's IBIT saw its largest outflow in more than four months on the eve of the election.
On November 2, IBIT recorded a single-day net outflow of $405.3 million, its largest since June 26
U.S. spot Bitcoin ETFs saw combined net outflows of $398.6 million
Only Fidelity's FBTC saw a modest net inflow of $6.7 million
Including the $643.2 million outflow on October 30, outflows exceeded $1 billion over two trading days
BTC is currently hovering around $77k
Big money is stepping to the sidelines to await the election results; short-term buying support will have to come from within the market.
post-image
BTC-0.67%
#PalantirRevenueJumps96%ButStockFalls
$PLTR Revenue Jumps 96% But Stock Falls - Info Heavy Read
$PLTR posted its highest growth rate ever, yet stock fell, a clear case of beat versus high bar.
Verified Prints - Current
• Revenue: 2.313 billion USD, up 96% year over year, highest growth rate in firm history, up 20% quarter over quarter, vs Street call 2.18 billion USD and 2.17 to 2.2 billion range. Beat near 130 million USD. • Adjusted EPS: 44 cents, up 95% year over year, vs 40 cents and 41 cents consensus per FactSet, vs 0.44 USD reported. Profit 1.13 billion USD, or 44 cents per share, up f
post-image
PLTR-2.97%
  • 9
  • 3
#StorageStocks48Hour
𝗧𝗵𝗲 𝟰𝟴-𝗛𝗼𝘂𝗿 𝗦𝘁𝗼𝗿𝗮𝗴𝗲 𝗦𝘁𝗼𝗰𝗸𝘀 𝗖𝗵𝗮𝗹𝗹𝗲𝗻𝗴𝗲: 𝗔 𝗠𝗮𝗿𝗸𝗲𝘁 𝗣𝘂𝗹𝗹𝗯𝗮𝗰𝗸 𝗖𝗿𝗲𝗮𝘁𝗲𝘀 𝗮 𝗡𝗲𝘄 𝗧𝗿𝗮𝗱𝗶𝗻𝗴 𝗢𝗽𝗽𝗼𝗿𝘁𝘂𝗻𝗶𝘁𝘆
🔍 𝗔 𝗣𝘂𝗹𝗹𝗯𝗮𝗰𝗸 𝗗𝗼𝗲𝘀 𝗡𝗼𝘁 𝗔𝘂𝘁𝗼𝗺𝗮𝘁𝗶𝗰𝗮𝗹𝗹𝘆 𝗠𝗲𝗮𝗻 𝗮 𝗕𝗮𝗿𝗴𝗮𝗶𝗻
Many traders believe that when a stock falls sharply, the best move is to buy immediately before the price recovers. That is one of the most common mistakes in trading.
A falling price does not always mean a stock has become cheap. Sometimes it signals temporary market pressure. Other times, it reflects deeper concerns
post-image
SNDKG-0.36%
INTCG-0.18%
TQQQG+0.13%
📌 Gold Medal Finance | U.S. October Manufacturing PMI 59, highest since 2021
1️⃣ Data: Actual 59, market forecast 54.6, manufacturing expansion accelerated significantly
2️⃣ Meaning: Production is recovering, economic resilience is exceeding expectations, and market expectations for the pace of rate cuts will be pushed back
3️⃣ Impact: The dollar and U.S. Treasury yields are likely to strengthen, risk assets may face short-term pressure, watch BTC and ETH for a pullback after a surge4️⃣ Market view: Don’t chase highs; wait for a retest of key support before acting, MA120 is the dividing line
post-image
BTC-0.67%
ETH-1.26%
  • 2
I'm trading on Gate, a top-tier exchange with a 13-year track record. Come join me and dive into the hottest events right now! https://www.gate.com/campaigns/6852?ch=9269&ref=VLARBF1YAG&ref_type=132
post-image
#美国中期选举今日投票 #WCTCS9 Countdown to the US midterm elections! Will the S&P 500 see a new rally?
The US midterm elections will be held on November 3, and whether Republicans can continue to control Congress has become a focal point for global financial markets.
With Democrats expected to retake control of the House, investors are closely watching how the election results may affect US fiscal policy, government spending, tariffs, and artificial intelligence (AI) regulation.
Historical data shows that the S&P 500 typically performs strongly in the six months following US midterm elections, but will
post-image
ThisIsTranslateContent:
#美国中期选举今日投票 #WCTCS9 Countdown to the U.S. Midterm Elections! Is the S&P 500 Set for a New Rally?
The U.S. midterm elections will be held on November 3, with whether Republicans can continue to control Congress becoming a key focus for global financial markets.
With Democrats expected to retake control of the House of Representatives, investors are closely watching how the election results will affect U.S. fiscal policy, government spending, tariffs, and artificial intelligence (AI) regulation.
Historical data shows that the S&P 500 typically performs strongly in the six months after U.S. midterm elections, but will this trend continue in 2026? This article examines three possible election outcomes and their potential impacts on U.S. stocks, tech stocks, U.S. Treasury yields, and market sentiment.
U.S. midterm elections: Control of Congress is key. As the 2026 U.S. midterm elections approach, investors are watching to see whether Republicans can continue to control Congress or Democrats will regain control of some of it.
Currently, Republicans control the White House, House of Representatives, and Senate, making the key question in this election whether control of Congress will change. Historically, the president's party often loses some seats in Congress during midterm elections.
In 18 of the 20 midterm elections since World War II, the president's party lost seats in the House of Representatives. Current election forecasts favor Democrats retaking the House, while the Senate race is relatively closer.
Why are the House of Representatives and Senate so important? The U.S. Congress consists of the House of Representatives and the Senate. Both chambers participate in lawmaking, but their responsibilities differ.
Because legislation usually needs to pass both chambers before it can be submitted to the president for signature, control of Congress affects how easily the government can advance its policies.
If the two chambers are controlled by different parties, the legislative process may face more gridlock. Conversely, if the governing party controls both chambers, the government has more room to advance its policy agenda.
Why do the U.S. midterm elections affect U.S. stocks? For investors, the importance of the election lies not only in which party wins, but also in how the results could change government policy. If Congress is controlled by different parties, major tax and government spending policies may be harder to pass.
Some market participants believe this could benefit markets, as fewer policy changes may help reduce uncertainty and give businesses and investors a relatively predictable operating environment.
Historical data shows: U.S. stocks typically perform strongly after midterm elections. Historically, the S&P 500 has often posted strong returns after U.S. midterm elections.
According to historical statistics:
Midterm election years: From the end of October, the S&P 500 has returned an average of 14.3% over the following six months.
Non-midterm election years: The average return over the same period is 3.7%.
Fourth quarter: Historically, seasonality indicates that it is typically the strongest quarter of the year for U.S. stocks.
However, historical average returns do not indicate future performance. Interest rates, corporate earnings, geopolitical developments, and the overall economic environment can all affect U.S. stock performance independently of election results.
How could three possible election outcomes affect U.S. stocks? The midterm elections could produce three main scenarios, and different combinations of congressional control could have different effects on policy and financial markets.
Scenario 1: Democrats win the House, Republicans hold the Senate. This would result in a divided Congress. If Democrats control the House while Republicans continue to control the Senate, new tax and government spending bills could be harder to pass.
At the same time, the government could face stricter oversight from the House, while Republicans would continue to have influence over judicial and senior government appointments. For financial markets, the key question is whether legislative gridlock would help reduce policy uncertainty and create a more stable, predictable operating environment for businesses.
Scenario 2: Democrats win both the House and the Senate. If Democrats gain control of both chambers, they would have greater influence over the legislative agenda and government oversight. The current administration could face stronger policy resistance, while government spending, appointments, and regulatory direction could also come under closer scrutiny.
The tech sector is particularly worth watching. If Democrats push for stricter AI regulation, data privacy protections, or oversight of the tech industry, this could affect the operating environment for related companies. For tech stock investors, the key question is whether regulatory changes will affect companies' future growth prospects.
Scenario 3: Republicans continue to control both chambers. If Republicans successfully hold the House and Senate, the current administration would have more room to continue its policy agenda and face fewer congressional constraints.
Policy continuity may give some investors confidence, particularly those expecting further government support or legislative action for certain industries. However, issues such as the government budget deficit, tariffs, and geopolitical developments will remain.
Markets will watch whether policy continuity provides clearer direction or whether existing fiscal and trade uncertainties continue to affect investor sentiment.
Three major policy areas for investors to watch after the election
Regardless of which party ultimately gains control of Congress, the following three policy areas could have broader impacts on financial markets.
1. Fiscal policy and government spending
If Democrats control Congress, they may impose more restrictions on legislation that expands the fiscal deficit and increase scrutiny of government spending. If this lowers market expectations for fiscal expansion, it could affect inflation expectations and demand for U.S. Treasuries. However, the actual direction of U.S. Treasury yields and the dollar will still depend on Federal Reserve monetary policy and the overall economic outlook.
2. Iran conflict and defense spending
Control of Congress could also affect future U.S. funding for the Iran conflict and related military operations. If additional military appropriations are restricted, market expectations for the duration and intensity of the conflict could change.
If tensions ease, concerns about disruptions to energy supplies could lessen, easing pressure on oil prices and inflation expectations. This could also further affect U.S. Treasury yields, the dollar, and overall market sentiment.
3. AI and tech industry regulation
The tech industry will also be closely watching the post-election regulatory environment. If Democrats control Congress, they may push for stronger AI-related regulation, including data protection, market competition, and the use of AI technologies.
At the same time, investors have already begun to question whether the massive capital expenditures by large tech companies and hyperscalers can generate sustainable returns.
Therefore, any changes in regulation or the direction of government support could affect market perceptions of tech stocks, especially companies with a high share of AI business.
What key indicators should investors watch in U.S. stocks after the election results are announced?
In addition to which party wins, investors can also keep an eye on the following four areas.
1 Senate control. Since the House is considered more likely to change hands, the Senate election results could be key to determining the final balance of power in Congress. If Republicans hold the Senate, the U.S. could have a divided Congress. If Democrats win both chambers, they could place greater constraints on the current administration's policy agenda.
2 Market volatility. Uncertainty ahead of a major election could lead to increased short-term market volatility. As the results become clearer, markets may rebound as uncertainty fades. However, actual performance will still depend on how investors interpret the results.
3 Policy signals. Developments related to tariffs, government spending, the Iran conflict, and AI regulation could provide important clues about the future direction of policy. These policy changes could also further affect business operations and investor expectations.
4 Corporate earnings and economic data. Even after the election results are determined, corporate earnings, U.S. inflation data, and interest rate expectations will remain important factors affecting the S&P 500. Therefore, investors should not judge the future direction of U.S. stocks solely on political outcomes.
How will the S&P 500 perform after the U.S. midterm elections?
The U.S. midterm elections could change the future policy environment, but their actual impact on the stock market will still depend on how investors interpret the results alongside economic conditions and business developments.
Historically, the S&P 500 has typically performed well in the months after midterm elections. However, past performance does not guarantee future returns, and investors still need to monitor changing market conditions.
For investors following U.S. stocks, the S&P 500, and the tech sector, the question worth considering may be more than just which party wins the election. More importantly, will the election results bring clearer policy direction to markets, or introduce a new wave of uncertainty?#广场交易达人
repost-content-media
SPX500+0.19%
  • 2
Spot gold retreated to around $3,895/ounce after surging the previous day and is now fluctuating around 3900! Despite oil prices plunging more than 7% in early trading and ongoing geopolitical and political uncertainty, growing expectations of a Fed rate hike in December and stronger demand for the dollar continue to weigh on gold.
Technically, gold remains in a downtrend channel, with the $3,850 support level becoming a key focus for the market. There are many potential catalysts tonight: the US midterm elections, ISM Manufacturing PMI, JOLTS job openings data, and remarks by Fed officials
GLDX-0.40%
PAXG+0.37%
  • 1
It's about time to pump the market, right?$ETH ‌#Gate多项排名全球Top2
ETH-1.23%
Perps settled in World Liberty Financial's USD1 stablecoin hit a new high of $278.2M in open interest on Aster in the week to November 1.
Traders put $3.42B through 24 USD1 stock and commodity markets, more than $487M a day.
@Aster_DEX
USD1-0.05%
ASTER-0.07%
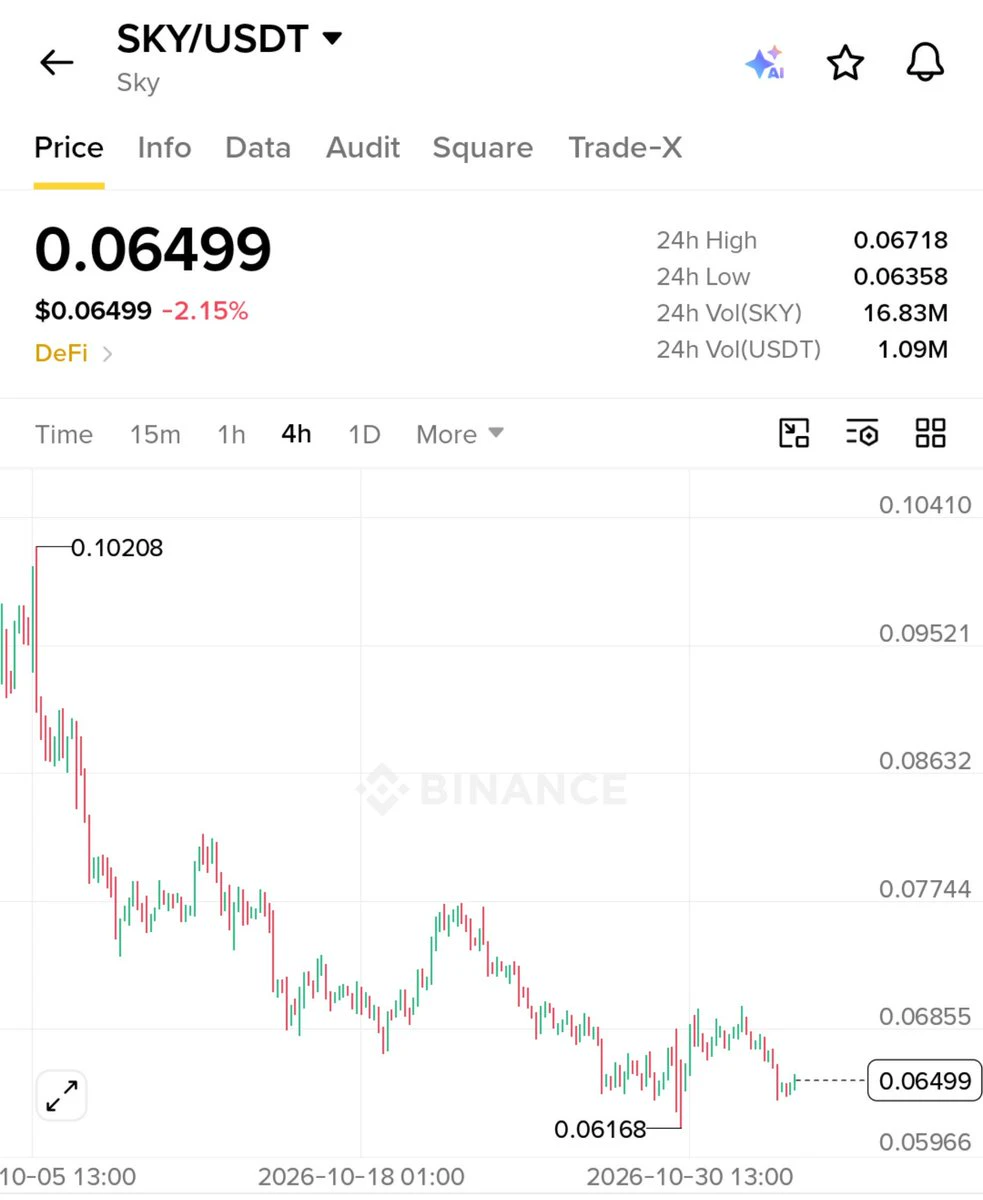
- $SKY trades near $0.065 after a prolonged decline.
- Price bounced from $0.06168, but resistance remains overhead.
- Buyers show some strength, though a clear breakout is still needed.
- Watch volume and support before making any trading decision in the coming sessions.
post-image
SKY-0.42%
Load More

Join 40 M users in our growing community

⚡️ Join 40 M users in the crypto craze discussion

💬 Engage with your favorite top creators

👍 See what interests you

Trending Topics

USMidtermsVoteToday

22.05k Views777 Discussing

The U.S. midterm elections are being held today, with all 435 House seats and 35 Senate seats on the ballot. The results will shape control of Congress and could influence future fiscal, economic and crypto regulatory policy. What are you watching most closely — control of Congress, fiscal policy or crypto regulation? Which market will price in the outcome first: U.S. stocks, gold or crypto?

GateRanksTop2AcrossMultipleCategories

8.51k Views3.01k Discussing

USEarningsSeason

456.93k Views3.33k Discussing

View More