Share your thoughts
placeholder
Article
Everyone’s waiting for SUI to break out—but the 4H chart is quietly setting a trap for late longs.

$SUI /USDT - SHORT

Trade Plan:
Entry: 0.7973 – 0.8021
SL: 0.8224
TP1: 0.7826
TP2: 0.7713
TP3: 0.7542

Why this setup?
Why now?
- 1D trend is *range*—no momentum to push higher.
- RSI on 15m is cooling at 55, losing upside steam.
- ATR (0.0095) shows tight, indecisive candles—breakouts are failing.
- Entry zone 0.797–0.802 is exactly where sellers stepped in last cycle.
- SHORT bias (55% conf) targets TP1 at 0.7826, then TP2 at 0.7713—a clean 3.5% drop from here.

Debate:
Is SUI fa
SUI-0.48%
$XMR Signal】1H bullish resistance + depth imbalance rebound
$XMR The 1H Bollinger lower band at 536 was lost and reclaimed, while a buy wall absorbed selling pressure and a 38.39% order book imbalance created a window for a short-term rebound. The 4H MACD remains in bullish territory, but the histogram is shrinking, with multiple timeframes in conflict as the price repeatedly tests just above EMA50.
🎯Direction: Long
⚡Entry/limit order: 537.70 - 539.32
🛑Stop-loss: 533.93
🚀Target 1: 547.41
🚀Target 2: 551.45
🛡️Trade management:
- Execution strategy: Take 50% profit after reaching Target 1 a
post-image
XMR0.00%
BTC+0.09%
ETH+1.35%
SOL+2.84%
Everyone’s watching $ETH /USDT sideways—but the 4h tape is quietly loading a trapdoor.

$ETH /USDT - SHORT

Trade Plan:
Entry: 2496.36 – 2502.06
SL: 2526.56
TP1: 2478.69
TP2: 2465.02
TP3: 2444.50

Why this setup?
Why now?
- 1D trend is *range*, not bull—so rallies are sellers’ gifts.
- RSI 15m at 49.23 = zero momentum, just waiting for direction.
- ATR 1h at 11.39 means volatility is coiled; the 2499.21 ref is the pivot.
- Short setup armed: TP1 2478.69, TP2 2465.02—risk to SL 2526.56 is only ~1% for a 1.4% move down.

Debate:
If price taps 2499.21 again, do you fade it or wait for
ETH+1.34%
#‌$NVDA NVDA AT $231: NVIDIA REMAINS ONE OF THE STRONGEST AI STOCKS — FULL MARKET ANALYSIS, NFP IMPACT & TRADING PLAN
NVIDIA remains one of the most powerful names in the global technology market, and in my view NVDA continues to deserve serious attention because the AI infrastructure story is far from finished. With NVDA around the $231 area, the stock is sitting in an important decision zone where momentum, fundamentals, AI demand, macroeconomic pressure and valuation are all coming together. The latest verified Friday close was approximately $230.36, after NVDA traded as high as $234.76 and
#HYPEBreaks88HitsNewAllTimeHigh
#HYPE Strong Trend, But Don’t Chase the Top
HYPE is trading around $85–86 today, holding close to the upper end of its recent range after pushing into the $88 area.
The bigger picture remains bullish, but the market is now at a much more important decision zone. HYPE has recently been making fresh highs, while trading activity remains extremely strong. Current 24-hour volume is around $1.55B, which gives this move real participation rather than a completely empty breakout.
But there is an important warning here.
Recent analysis shows HYPE is only a few percent
HYPE+3.85%
#GateTops7DayNetInflowsGlobally
Gate’s $96.64M Inflow Signal: Follow the Liquidity, Not Just the Headline
The latest exchange-flow snapshot is giving Gate another reason to stand out.
Gate has recorded approximately $96.64 million in net capital inflows over a seven-day period, placing it at the top of the global ranking in that particular observation.
At first glance, the number looks extremely bullish.
But I think there is a more important question:
What does this capital actually tell us about market behavior?
The answer is more nuanced than simply saying “money is entering, therefore Bitc
BTC+0.09%
ETH+1.35%
$SPCX
Momentum Is Back — Can SpaceX Push Higher?
$SPCX is trading around the $150 area, and this level is becoming very important for the next move. After a strong bounce from lower levels, buyers have stepped in again and pushed price back toward the recent resistance zone.
SpaceX is not just another growth story. Investors are watching its long-term potential in space technology, satellite internet, AI infrastructure, and future expansion. This combination keeps SPCX one of the most interesting names to follow.
From a technical view, the $145 support zone is important for bulls. As long as
post-image
SPCX-1.19%
[ $GRT Signal] Short-term long + 1H order book absorption/negative funding support
$GRT The 1H pullback reached around 0.0197, with buy-side quote depth nearly 70% higher than sell-side depth and order book imbalance at 25.73%. RSI(1H) is 62.66, not yet in the overbought zone; the 4H MACD histogram is expanding positively, while the 1H histogram is contracting positively. Funding is negative at 0.0296%, open interest shows no sharp fluctuations, and the latest 1H candle was a pullback on declining volume.
🎯Direction: [Long]
⚡Entry/Limit order: [Place a long order in the 0.0196808 - 0.0197400
post-image
GRT+10.96%
BTC+0.09%
ETH+1.35%
SOL+2.84%
ETH has pulled back in tandem after being hit by the negative impact of the nonfarm payrolls report and has now entered range-bound consolidation. The larger daily trend structure has not been completely broken, while the four-hour Bollinger Bands are narrowing and contracting. Long and short momentum is tending toward balance, with the short term in a repair and shakeout phase following the sharp drop, and no clear one-way direction has emerged.

After the price was rejected at higher levels, overhead selling pressure has increased somewhat. Buying support has emerged below after the decline
post-image
ETH+1.35%
#BTCReclaims80K
Bitcoin’s Growing Twin: Why the Gold Correlation Just Hit 0.50
Here’s a development worth paying attention to: the 90-day correlation between Bitcoin and gold has surged to +0.50.
It’s the highest level we’ve seen since the COVID-19 crash of 2020. To put that into perspective, this metric has more than doubled since the start of the year. Back in 2022, during a relatively stable post-crash recovery, that same correlation peaked at a modest +0.30.
So, what changed?
The primary catalyst appears to be a specific policy shift from the U.S. Treasury. On August 19, they announced pl
post-image
BTC+0.09%
NAS100+0.06%
🚀 TRON just surpassed 402 million accounts! But is TRX ready to break through the critical $0.337 level? 🤔 With user growth strong, what’s stalling the price? $TRX #crypto
TRX+0.78%
#GateEventContractTradeSharingChallenge
#XAU Gold Is Sitting at the Decision Zone
Gold is not giving a clean bullish signal yet.
The interesting part is that buyers managed to recover gold from the early-September selloff, but Friday’s U.S. jobs data immediately reminded the market why the upside is still difficult. Right now, XAU/USD is sitting close to the middle of a very important battle zone.
Current Market Snapshot
Spot gold: $4,429.10/oz
24h change: -0.96%
Latest available range: $4,365.80–$4,491.30
Market status: Weekend closed
Spot volume: Not reliably available while the market is c
XAU-0.04%
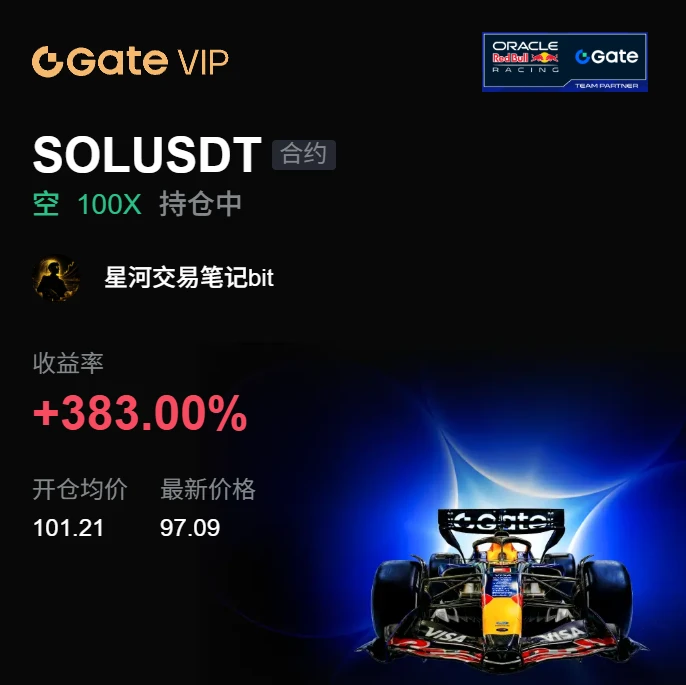
A hand that set the stop-loss a few days ago trembled slightly; this morning I realized that was unnecessary filial piety. Before bed, $APT made a low-volume rebound to a key level, with volume not following at all. I placed a short order at 0.9133, set the stop-loss, and went to sleep.

When I opened the chart in the morning, the price had already slid to 0.6149, locking in +2319.08%. The timing was just right—this run was worth staying up for. Don’t lose patience in the range, only to try to win back your dignity during a one-way move.

I’m not being greedy either: take 80% off the table
post-image
APT+1.25%
SNDK+1.29%
ZEC+15.76%
This was purely the market being in a good mood and casually tossing out some gold coins—one just happened to hit me on the head. While everyone else was running, I was instead watching for a fake move. $IN surged sharply and aggressively, but the volume simply didn’t match up, making it look like a bull trap no matter how I looked at it. I didn’t rush in; instead, I placed a short position around 0.09355.
Being out of the market is not a sin; opening positions recklessly is.
After the sentiment cooled and the price slowly returned to 0.03503, +3011.48% was secured—what a rush. In terms of ex
post-image
IN+0.63%
XRP-0.25%
BTC+0.11%
Layout for Bitcoin, Ethereum, and Dogecoin
live-cover
LIVE3,304
  • 1
Long-term Holding of Gold | Wealth Is Built Through Patience
post-image
GLDX+0.15%
PAXG-0.15%
💰 Great content deserves more than likes. Have you turned on Gate Social Subscriptions yet?
Whether you’re sharing market analysis on Gate Square or discussing trends on Live, you can make your content subscriber-only.
Market recaps, trading ideas, market insights, and more — save your deeper content for subscribers while building a stronger core community.
🔥 Set your own subscription price and keep 100% of your subscription revenue.
👉 Get started: https://www.gate.com/post
📖 Learn more: https://www.gate.com/help/community-center/moments/23369
post-image
  • 5
  • 2
what part of the cycle is this
post-image
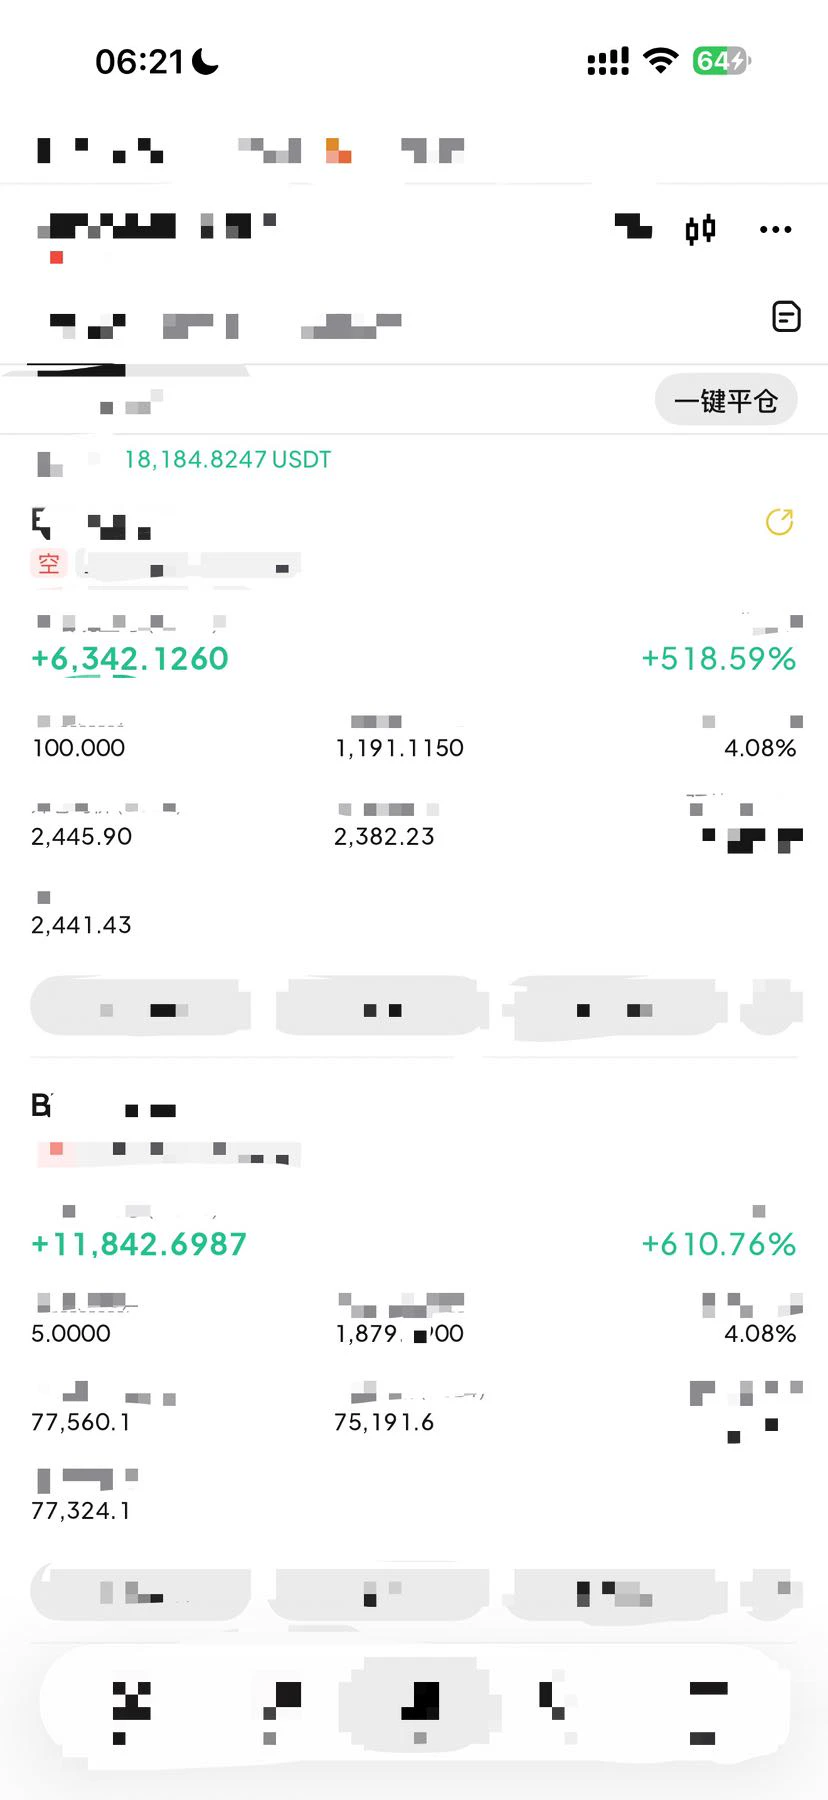
Caught Ethereum at 382 last Friday and manually closed the position this morning, still making dozens of points. If there’s a wick on Monday, I’ll buy at the 0.5 or 0.618 level and take a position. The biggest resistance above is 2530. If it breaks through 2530 live with volume and without a wick, I’ll chase it directly at market price. Use this as a reference, brothers! Now I only have the remaining SK Hynix position in hand—watching 1350. #海力士 #闪迪 #以太坊
ETH+1.35%
SNDK+11.88%
Load More

Join 40 M users in our growing community

⚡️ Join 40 M users in the crypto craze discussion

💬 Engage with your favorite top creators

👍 See what interests you

View More