Square
Following
Hot
News
Profile
Share your thoughts
placeholder
Article
ETH is currently around 2,450, maintaining an overall weak recovery. This rebound is merely a technical bounce after the decline, not a reversal, and the bearish structure remains intact.

On the 4-hour chart, the price is pressured by the moving averages, rebound volume is insufficient, the Bollinger Bands remain in a downward trend, and overhead resistance is dense. This rise is merely a corrective move within the downtrend, with limited upside and relatively high pullback risk.

On the 1-hour chart, short-term fluctuations are showing a mild recovery, but bullish momentum is lacking. This
post-image
ETH+1.73%
( new streamer) market overview
live-cover
LIVE57
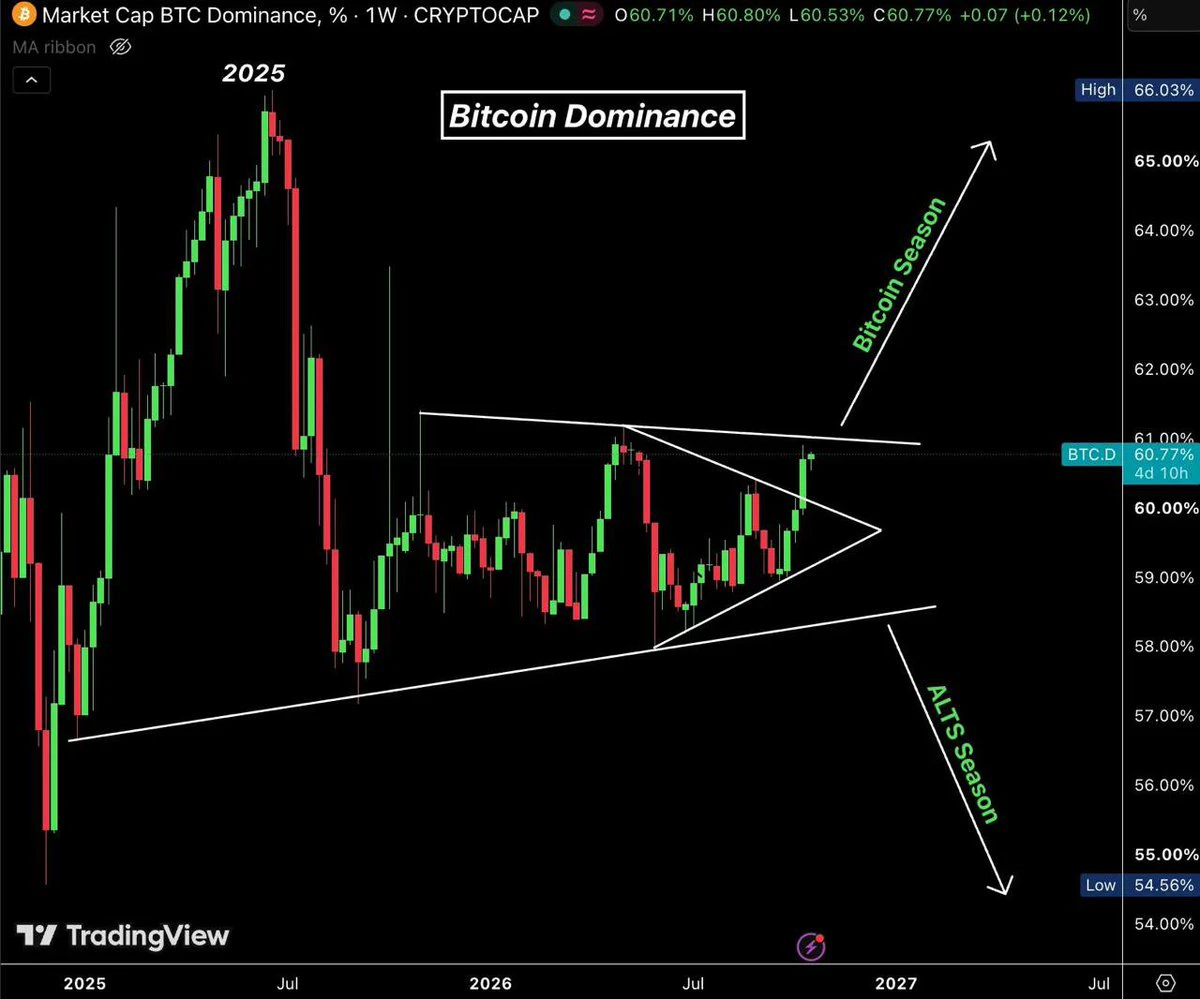
#Bitcoin Golden Cross loading.
You know what this means...
post-image
BTC+0.84%
Ledger response to the recent supply chain attacks: $899 pls. Ps don't drop it
post-image
Many people see the funding rate turn positive and MACD turn green and automatically assume “the bulls are back,” then chase in with oversized positions—this is the most common position-sizing mistake: treating indicator direction as an entry signal while ignoring the moving-average structure and volatility levels. $BERA is a textbook example of this trap.
First, the structure: current price 0.2284, MA5=0.2311 remains below MA20=0.231595, and the short-term moving average has not crossed above, meaning the bearish alignment has yet to be repaired; RSI=47.3 is stuck in the neutral-to-weak zone
post-image
BERA-6.35%
$FIL the big move by gateio has begun, where everyone who believed in and invested in these ETF tokens literally gets screwed 🤡🤯
post-image
FIL+8.74%
Which step is $CRCLB’s latest rally most likely to fool you on?
$CRCLB There is a very typical debate right now: one side uses +8.96% over 24 hours to prove the direction, while the other counters with key levels. I’m not taking sides based on the rise or fall for now, because $CRCLB remains strong, while the crowded positioning is already out in the open and has yet to provide a complete answer. I acknowledge that the trend is strong, but what matters next is not how much higher it can surge, but whether anyone steps in during the first pullback.
Laying out the chart, the current price is 86.
post-image
$ZEC has already been quite decent, delivering a tenfold return. Keep holding
post-image
ZEC+8.91%
$merge bottomed . These micro caps always have these random pumps especially if there are hodlers & bots 🤖 see
AGq9Y4TnfkSiP1JTE6ndfAz7nAqTY9NC3qaPuW9Ppump
#crypto
post-image
CAPS-4.00%
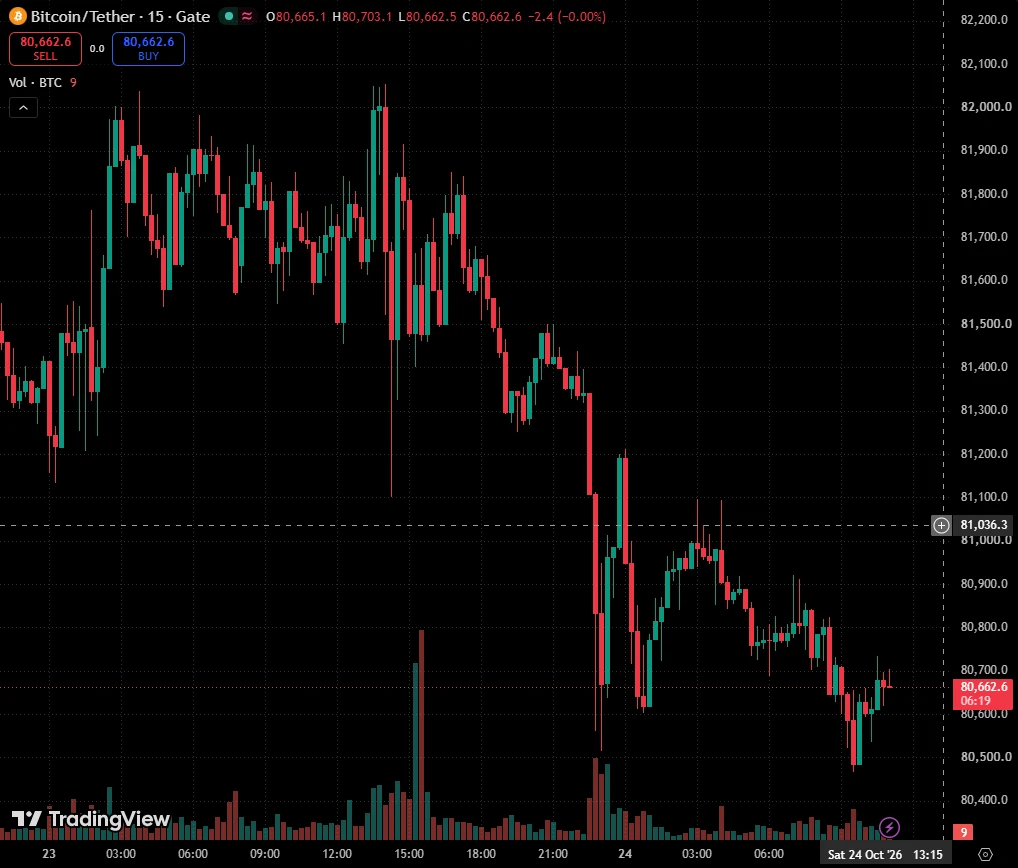
Bitcoin Support and Resistance Levels
live-cover
LIVE43
I make about $29k a month with options.
NO Day trading
NO Swing trading
NO Covered calls
NO Cash secured puts
NO BS
INSTEAD, I DO THIS:
Build base portfolio
Sell portfolio secured puts (not cash secured)
Buy LEAPS with the premium from sold puts
BUY shares with the premium from sold puts
Keep ratios in check
I can explain it to a 13 year old & I will likely outperform 95% of people that read this.
Simple wins.
post-image
$QNT
A steady grind lower all the way, with longs liquidating longs—everyone trying to catch the falling knife got buried.😤 A rebound to 213.7 is the window to escape; if 201.8 breaks, it will head straight down. Don’t wait until the waterfall comes to run.
post-image
QNT+0.80%
Range-bound SKHYNIX is about to break out and most traders are positioned the wrong way.

$SKHYNIX /USDT - SHORT

Trade Plan:
Entry: 971.37 – 978.79
SL: 1010.69
TP1: 948.37
TP2: 930.56
TP3: 903.85

Why this setup?
Why now? The daily trend is range, but the 1h ATR of 14.839521 signals a squeeze is building inside that range. The 15m RSI at 58.85 shows momentum is not yet exhausted, so a short entry near 975.08 is valid as long as we stay below 978.79. TP1 at 948.37 and TP2 at 930.56 define the first two targets on the path down, while the invalidation level of 1156.63 is the hard line that w
SKHYNIX-4.18%
HYPERLIQUID $HYPE REJECTING MOVING AVERAGE RESISTANCE ARE BEARS TARGETING $78.06 NEXT?
Pair: $HYPE /USDT
Direction: SHORT
Entry Price: 81.62
Target Levels (Take Profit)
TP 1: 79.48 2.62%
TP 2: 78.06 4.36%
Stop Loss
SL: 84.47
Technical Breakdown
HYPE ($81.565) faced strong sell-side rejection following an impulsive upward push, printing a topping wick right at overhead structural resistance. This price action confirms persistent seller defense and sets up a clean continuation toward lower targets.
Price action tested areas above short-term moving averages before meeting heavy distribution
HYPE+1.66%
we crushed the PPI news 📊
Careful, @crocat_x is an impersonator and most likely a rug!
Report.
The official crocat:native X is @CroCat_Token with CA 0x7Eb480c734eC5f6bd2B918F7393b59D59913DFFA
This is a good reminder as Cronos is getting more succesful, rugs and rats are also coming back.
Invest with eyes open, very easy to run in to these!
post-image
CRO+0.22%
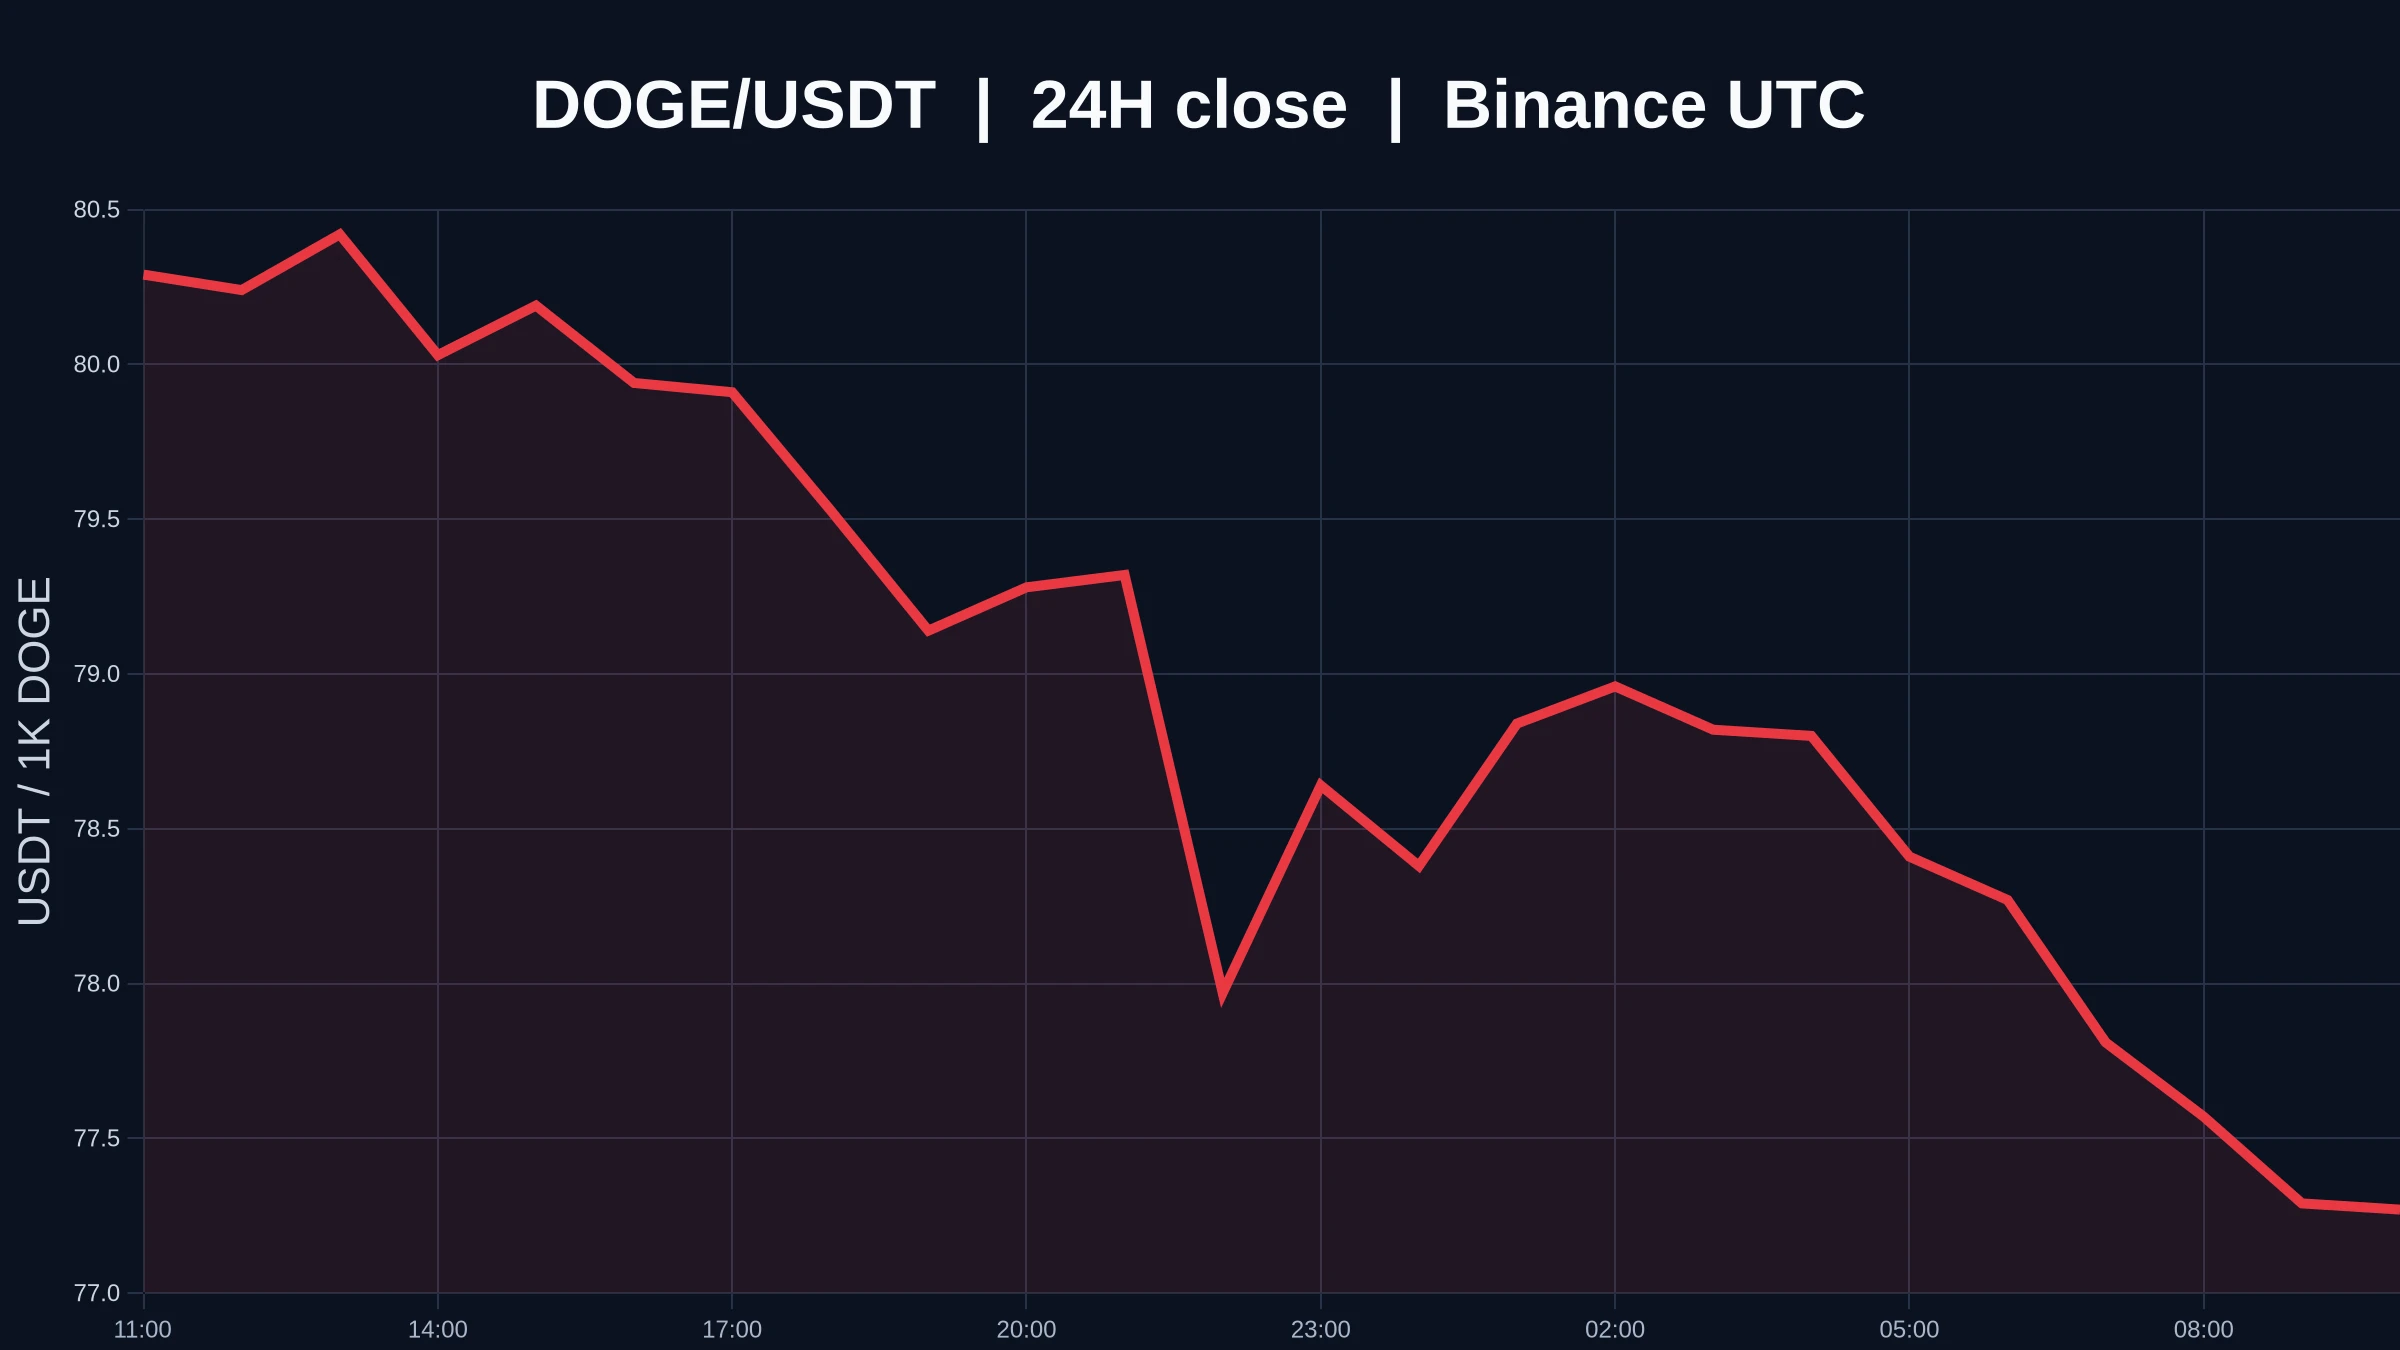
1016 $DOGE Recent entry position for DOGE—just look at the daily chart. Every time the broader market makes any move, DOGE starts falling in advance.
I've bought at 0.06888 many times before and played the August range quite a bit. The last time, I held DOGE until it started moving at 0.083 and then exited. I haven't really watched DOGE since, because I think DOGE can sometimes be difficult to trade short-term.
We'll continue placing long orders around 0.06888 and 0.07, with a stop loss at the bear-market low of 0.067. Keep the stop-loss range slightly wider. Leave this long-term lottery orde
post-image
DOGE-0.42%
Besides $BTC
, which cryptocurrency is most suitable for long-term holding?
● $HYPE ● $TAO ● NEAR
post-image
BTC+0.84%
HYPE+1.37%
TAO+2.91%
$DOGE About To Make Some Gains!?
Just locked into a long on $DOGE!
NFA, DYOR ⚠️
#Crypto #Trading #DOGE
post-image
DOGE-0.35%
$CORE Everyone, do you think it will reach 2u?
post-image
CORE+0.24%
Load More

Join 40 M users in our growing community

⚡️ Join 40 M users in the crypto craze discussion

💬 Engage with your favorite top creators

👍 See what interests you

Trending Topics

USSeptemberPPIBeatsExpectations

91.35k Views1.88k Discussing

US September PPI came in at 6.3% YoY, well above the 5.3% market expectation, pointing to renewed producer-side inflation pressure. Weekly jobless claims were 199K, broadly in line with forecasts. Could hotter inflation further reduce room for rate cuts, and what does it mean for $BTC, US stocks, and gold?

DrLinHanSpeaksAtOxfordUnion

135.63k Views1.86k Discussing

JapanAndKoreaStocksPlunge

47.27k Views1.76k Discussing

View More