Share your thoughts
placeholder
Article
Meme energy coming back… 🚀
What are your top picks? 👀
#memecoins #crypto
post-image
MEME-0.05%
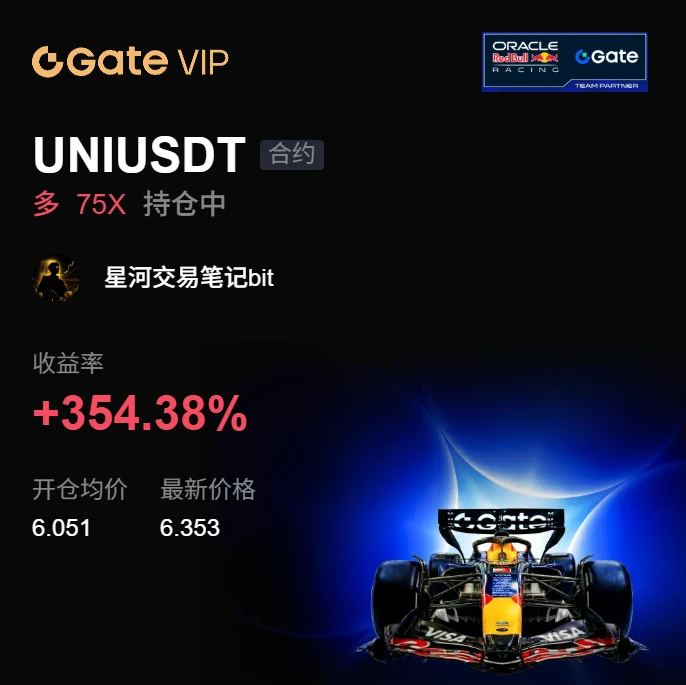
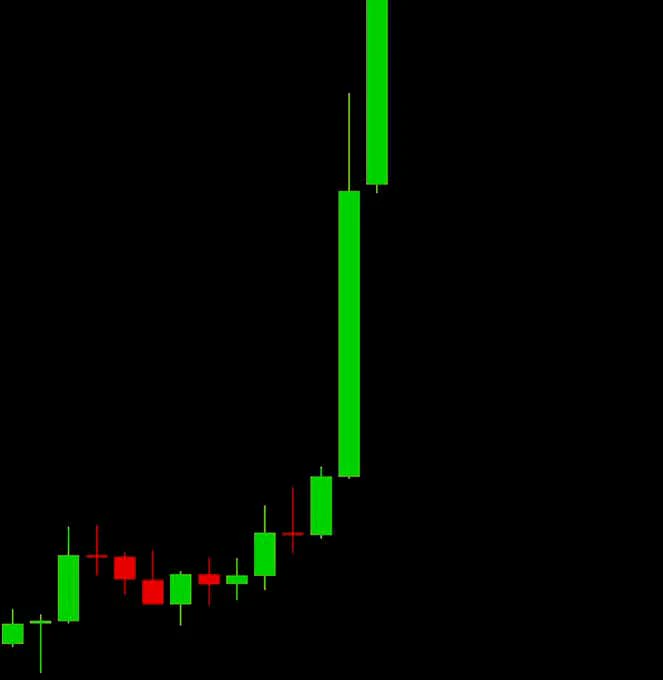
Going long on this move hasn’t felt very comfortable. Right after entering the position, I was hit by a false-breakout wick, and a key level nearly swept my stop-loss. I didn’t cut the position at the key level because volume hadn’t expanded; instead, it looked more like a shakeout. The chart then saw a series of small bullish candles, with the battle between bulls and bears quickly shifting to the bulls’ side. When the price reached around 0.1951, I took profits on 70% of the position and moved the stop-loss on the remaining position above breakeven. The profit currently stands at +358.26%, a
post-image
BNB-1.49%
ADA-0.27%
$INJ has reached a major decision point after a strong recovery from the $4.60 area.
Price is now testing the $5.80–$6.00 zone, so confirmation matters here.
A clean breakout and hold above $6.00 could open the move toward $6.30 → $6.60.
But rejection from this zone could trigger a pullback toward $5.50 → $5.20.
For now, momentum is bullish, but this is the level that decides the next move.
Long $INJ ‌
post-image
INJ+22.06%
Everyone is about to find out what happens when SYMBOL breaks 88.061.

$HYPE /USDT - LONG

Trade Plan:
Entry: 85.245 – 85.679
SL: 83.383
TP1: 87.021
TP2: 88.061
TP3: 89.620

Why this setup?
Why now? The daily trend is bullish, setting the stage for continuation higher. The 1h price sitting at 85.462 aligns perfectly with the entry_ref, giving us a precise spot to initiate. The 15m RSI at 48.31 shows room to run without being overbought, while the 1h ATR of 0.866321 confirms enough volatility to reach TP1 at 87.021 and push toward TP2 at 88.061. The invalidation level at 83.595 is the line i
HYPE-2.34%
A few days ago, I nervously canceled the stop-loss. Looking at it today, it feels like I narrowly escaped.

During the repeated intraday swings, every rebound in $CYS was pushed back down, with selling pressure never easing and volume shrinking badly. This kind of grinding action isn't gearing up for a breakout—it is looking for a key level to the downside.

After entering the short at 1.3889, the current price dropped straight to 0.2099, with unrealized gains reaching +1671.7%. Those who were on board should be waking up with a smile. That was a satisfying chunk of profit.

Don't get greed
post-image
CYS-8.72%
XRP-1.17%
BTC-0.95%
Insiders are quietly stacking shorts on $XAU /USDT while the 1h price holds a suspiciously flat range.

$XAU /USDT - SHORT

Trade Plan:
Entry: 4411.58 – 4417.00
SL: 4440.26
TP1: 4394.81
TP2: 4381.82
TP3: 4362.35

Why this setup?


Debate:
Are we about to sweep 4456 and trap the shorts, or is this range about to explode downward?

⚠️ Personal market analysis only. NFA — manage risk and DYOR.
Educational content, not investment advice or a recommendation to buy, sell, deposit, or withdraw any asset. No paid promotion or referral/affiliate links.
XAU-0.37%
#Solana: $105 Is the Key Level
$SOL ’s momentum is improving, but the weekly trend still needs confirmation.
• $105 = major resistance — Fibonacci, trendline and moving averages converge here.
• RSI bullish divergence suggests selling momentum weakened into the June low.
• Death cross remains active, keeping the broader trend under pressure.
• Stablecoin supply is around $16.4B, but DEX and perps volumes are declining — liquidity is rising, yet active demand remains unconfirmed.
Weekly close above $105 + successful retest → stronger recovery structure.
Rejection below $105 → broader downtrend
post-image
SOL-1.61%
Insiders are quietly setting shorts on DOGE while the 1h price sits at 0.08975.

$DOGE /USDT - SHORT

Trade Plan:
Entry: 0.08950 – 0.09000
SL: 0.09220
TP1: 0.08792
TP2: 0.08669
TP3: 0.08486

Why this setup?
Why now? The daily trend is range-bound, which favors short reversals at the top of the range. The 15m RSI reading of 48.07 shows the 1h price is neutral, not overbought, so a move lower is not out of character. The 1h ATR of 0.001019 means the average hourly swing is roughly that size, giving the entry zone of 0.08950 to 0.09000 a realistic trigger for a breakdown. TP1 at 0.08792 and TP
DOGE+0.58%
New Gate futures listings: $STONK , $BEN , $ZCAT , $BREW
🔹 Trading pairs: $STONK / $USDT, $BEN / $USDT, $ZCAT / $USDT, $BREW / $USDT
🔹 Trading hours: Now open
🔹 Supports 1 - 10x leverage, trading bots, and copy trading
From STONK and BREW’s multi-asset launchpad, to BEN’s stock rewards mechanism, to ZCAT’s anonymous cat and ZEC rewards, four hot projects bring together MemeFi, stock, and privacy narratives
Trade $STONK: https://www.gate.com/zh/futures/USDT/STONK_USDT
Trade $BEN: https://www.gate.com/zh/futures/USDT/BEN_USDT
Trade $ZCAT: https://www.gate.com/zh/futures/USDT/ZCAT_USDT
Trade
post-image
STONK-8.14%
BEN-53.26%
ZCAT-19.29%
BREW-55.80%
ZEC-5.29%
The only 2 tokens I hold on Stable chain.
These are $pumper & og $fefer:
> $pumper — launchpad on stable, fees go back to buyback and burn, holders and stakers;
> og $fefer — the first and main meme coin on Stable chain.
P.S: might ape into a business cat later... still thinking.
post-image
STABLE+2.85%
MEME-0.05%
I was just about to go to the forum and rant, but then I saw my balance and thought, never mind—the market is always right.
When I opened the charts this morning, while the whole screen was still flashing green, $PEPE had already stopped falling. Being unable to drop further is the best signal. It kept grinding at the bottom, but every sell-off was absorbed. I made it clear at the time: at this level, stop scaring yourself. Wait for it to stabilize before making a move.
Looking back now, I’m really glad I took a second look. From 0.000003539 to the current 0.000003611, this long position has
post-image
PEPE+0.42%
SOL-1.65%
ETH-0.35%
I originally wanted to cut my losses and sacrifice to the heavens, but the ceremony never happened—the meat roasted itself.
$SNDK ’s rebound this time came much faster than I expected. While it was grinding out a bottom intraday, everyone was shouting that it had broken down. I panicked too, but after looking at 1500.51, I saw that funds were genuinely entering and the buying support hadn’t broken, so I decided to hold a little longer instead of selling at the bottom.
A few days ago, I was still torn when I went to bed. When I woke up this morning, the candlestick chart had already done the wor
post-image
SNDK-0.10%
SOL-1.65%
ETH-0.35%
Guys, this is a mining project in the BNB ecosystem. Any wallet that has participated in the BNB ecosystem can join.
Previously active wallets get a multiplier bonus.
No need to connect your wallet. Just enter your address and email to start mining!
Just for fun:
BNB-1.46%
Crypto Market and Trading Insights
live-cover
LIVE848
$SPCX /USDT is range-bound on the daily trend but the 1h ATR whispers a short is forming.

$SPCX /USDT - SHORT

Trade Plan:
Entry: 150.04 – 150.28
SL: 151.35
TP1: 149.27
TP2: 148.67
TP3: 147.78

Why this setup?
Why now? The daily trend is range, which means the 1h price of 150.16 sits at a natural magnet for mean reversion. The 15m RSI reading of 48.86 confirms the short-term momentum is neither oversold nor overbought, allowing a clean entry within the 150.04 to 150.28 zone. The 1h ATR of 0.496517 quantifies the volatility contraction before a potential snap-back toward TP1 at 149.27. If t
SPCX-0.72%
Why is everyone still long XRP when the 1h ATR is barely moving?

$XRP /USDT - SHORT

Trade Plan:
Entry: 1.3932 – 1.3990
SL: 1.4237
TP1: 1.3754
TP2: 1.3616
TP3: 1.3409

Why this setup?
Why now? The daily trend is range-bound, but the 1h price just touched 1.3960, and the 15m RSI sits at 45.88, showing bearish momentum without oversold exhaustion. The 1h ATR of 0.01151 confirms the market is compressing before a potential breakdown. The entry zone of 1.3932 to 1.3990 aligns with the entry reference of 1.3961, giving a precise short trigger. If price pushes to TP1 at 1.3754 and then TP2 at 1.
XRP-1.17%
🚀 NVDA Testing Key Levels — Is The AI Leader Ready For Another Breakout?
$NVDA is trading around the $230.36 level, and this area is becoming a key decision point for the next move. After dropping toward lower support zones, Nvidia showed strong recovery momentum and buyers stepped in again, pushing the stock back above the $230 area.
The biggest reason investors continue watching NVDA is the strength of the AI story. Nvidia remains at the center of AI infrastructure growth, with demand for advanced chips and data center solutions continuing to support the long-term trend. Recent earnings mo
NVDA+0.87%
Load More

Join 40 M users in our growing community

⚡️ Join 40 M users in the crypto craze discussion

💬 Engage with your favorite top creators

👍 See what interests you

View More