

Share your thoughts
placeholder
Article
Everyone’s staring at the 4h chart, but the 15m RSI just flashed 32.89—nobody sees the trap HYPE is setting.

$HYPE /USDT - LONG

Trade Plan:
Entry: 83.751 – 84.255
SL: 81.587
TP1: 85.815
TP2: 87.023
TP3: 88.835

Why this setup?
- 1D trend is bullish, yet price is coiled at 84.003 with a 95% long confidence—this is textbook accumulation before expansion.
- ATR (1h) at 1.006 suggests volatility is compressing; the breakout from 83.751–84.255 will be violent.
- TP1 at 85.815 is only a 2.1% move, but the real fuel is momentum: RSI oversold on low timeframe + high timeframe trend = mean rev
HYPE-2.11%
#SHIB
$SHIB

A forward-looking view
If it reaches the blue box, it will be a good opportunity
SHIB-3.06%
Everyone’s watching silver’s fake breakout—but the 4H tape just whispered a trap.

$XAG /USDT - SHORT

Trade Plan:
Entry: 66.15 – 66.37
SL: 67.34
TP1: 65.45
TP2: 64.91
TP3: 64.10

Why this setup?
Why now? $XAG /USDT sits at 66.26 with a SHORT bias (55% confidence), yet the 1D is rangebound, not trending. RSI on the 15m is only 53—no momentum behind the push. ATR (0.45) says volatility is thin, so the 66.15–66.37 zone is a magnet for stop hunts. If price rejects here, TP1 at 65.45 is the first domino; TP2 at 64.91 is the real prize. But the alt map (TP1 at 67.07) shows bulls are armed—so thi
XAG-1.13%
Who’s riding the $MARSCOIN rocket to the final target? 🚀
post-image
CryptoSat
$MARSCOIN is already up 100%+ today, but the chart is still holding a bullish structure.
Price is currently staying above the short-term moving averages, and if buyers keep defending the pullbacks, I’m watching for another leg higher.
For those who want to take a long bet, here’s my setup:
Entry: 0.120 – 0.108
Stoploss: 0.104
Targets: 0.13, 0.144, 0.156, 0.17, 0.20, 0.30
Key area to watch is 0.12-0.11 If it holds as support, the upside targets remain in play.
Keep the position size small and don’t chase green candles.
Let’s see if the bulls have another move left. 👀
repost-content-media
MARSCOIN+74.11%
BTC ETH UPDATE
live-cover
LIVE86
🚨 CATI/USDT SHORT TRADE 🚨
📉 Entry: 0.066 – 0.070 USDT
🛑 Stop Loss: 0.072 USDT
🎯 Take Profit:
• TP1: +50%
• TP2: +100%
• TP3: +200%
• TP4: +300%
⚠️ Risk Management:
Trade with proper position size & always use SL.
Market conditions can change quickly — DYOR.
$CATI #CryptoTrading #ShortTrade #TradingSignals #harrycrypto
CATI+19.84%
This move is so obvious I don’t even need to think—the account is dancing on its own. During the intraday plunge, $ACE kept falling just short every time it tried to push higher, with a weak rebound and insufficient buying support. I warned against rushing to catch a falling knife and went short instead, entering at 0.1903. Looking at it now, the current price is 0.1722, with a return of +234.52%—the timing was spot-on.

No vision, can’t hold—these profits are paper-thin, but I love it. I’ve taken 80% profit first, putting the bulk in my pocket, and moved the stop-loss on the remaining 20% t
post-image
ACE-6.23%
SOL-2.35%
ZEC+7.78%
I originally wanted to sell at a loss as an offering to the heavens, but the ritual never happened—the meat cooked itself. When I checked the chart after lunch, $OPENAI was grinding around 1206.57. Seeing that long lower wick, I knew right away: this was a textbook pullback holding firm, with bottom-buying pressure insanely strong.
The thinking at the time was very simple: hold as long as the key level doesn't break, and leave only if it does. Who could have expected an afternoon surge straight to 1379.11, sending paper profits to +282.19%? The brothers on board should have woken up laughing.
post-image
OPENAI-0.39%
LAB-0.12%
DOGE-3.36%
Everyone’s watching 718, but the real trap is the range above 730—are you shorting the fakeout?

$BNB /USDT - SHORT

Trade Plan:
Entry: 716.83 – 719.47
SL: 730.78
TP1: 708.68
TP2: 702.37
TP3: 692.90

Why this setup?
- BNB sits at 718.15 with a 4h SHORT bias (55% confidence) while the 1D trend chops sideways—no momentum to break higher.
- RSI (15m) at 47.84 shows zero buying pressure; ATR (1h) at 5.26 means moves are tight, but TP1 at 708.68 is a clean 1.3% drop from entry.
- Why now? Price is “Armed” below resistance—if 719.47 holds as the ceiling, downside to 702.37 (TP2) opens fast, b
BNB-0.70%
The few stocks we talked about yesterday all performed very well today, and BE was also added to the S&P 500 after hours.
post-image
BE+7.42%
SPYX-0.28%
crypto market trend
live-cover
LIVE47
$AKE Everyone, don't give up. The price will only keep going higher, higher, higher, and higher. We might make it to the bull market and truly achieve financial freedom—real financial freedom.
AKE-14.79%
Steady lads, deploying fresh liquidity into ur mom.
post-image
Bitlayer (BTR), the native asset of the Bitlayer ecosystem, continues to seek consolidation at its bottom levels after a sharp 70.2% pullback over the past 7 days. The BTR/USDT spot pair, recovering from its intraday low of 0.04547 USDT with buying interest, rose by 10.58% to 0.05278 USDT. Perpetual futures (Perp) contracts are trading at 0.05298 USDT, up 10.74%.
Volume Indicators and Capital Flows
Despite the immediate price rebound, derivative market and capital flow data indicate a cautious outlook:
Trading Volume: In the last 24 hours, the Gate spot market recorded a trading volume of 59.6
BTR+13.45%
  • 12
  • 2
Play with the lucky ones.
If you make money, everything you say is right.
Stay away from contrarians; they either question everything or complain.
Some people are clearly making money, yet they seem to be in more pain than those who are losing money. How are you supposed to get rich?
A profitable trade is a successful trade even if it only makes 10U. If you treat every 10U you earn as 100,000U, you will soon make 1,000,000U. Opportunities favor those who are prepared, as well as those who are optimistic.
Making money from speculation is painful. Big-cap meme coins all go through extreme shakeo
post-image
MEME+1.87%
Claude just produced the first computer-checked proof of Fermat's Last Theorem, working largely on its own for 11 days.
It wrote 13 million lines of Lean and proved 29,500 intermediate theorems. Full proof is on GitHub.
Would you trust an AI-checked proof more than a year of human referees?
This was purely the market being in a good mood, casually tossing out a few gold coins that just happened to hit me on the head. During the repeated intraday swings, $BZ fell just short every time it pushed higher, and the candlesticks looked limp, but looking at the trading volume, buying pressure had actually been quietly strengthening all along. When everyone was afraid to move, I instead felt it was time to act.
The long position signaled at 92.57 is now at 95.72, +316.54%—feeling great, brothers. This kind of bottoming structure tests your patience the most, but as long as you dare to ent
post-image
BZ-0.10%
XRP-4.11%
BTC-1.89%
The $DASH 10x long position is making a push.
DASH+31.88%
$$Lobster's 29% gain: 87M in trading volume shows you what turnover-based distribution looks like
The price of 0.0938 is stuck between 0.1027 and 0.0711, with trapped holders above and profit-taking holders below. Going long here is just handing fees to the market maker. My system shows that the 0.0711–0.1027 range has already seen massive volume, but the price has failed to make a new high—a textbook distribution structure.
Here's the trading plan: Entry zone: enter only after a pullback to 0.084–0.086 holds; abandon the trade if it breaks 0.083. Stop-loss: 0.0805 (hard stop; a break below me
龙虾+29.85%
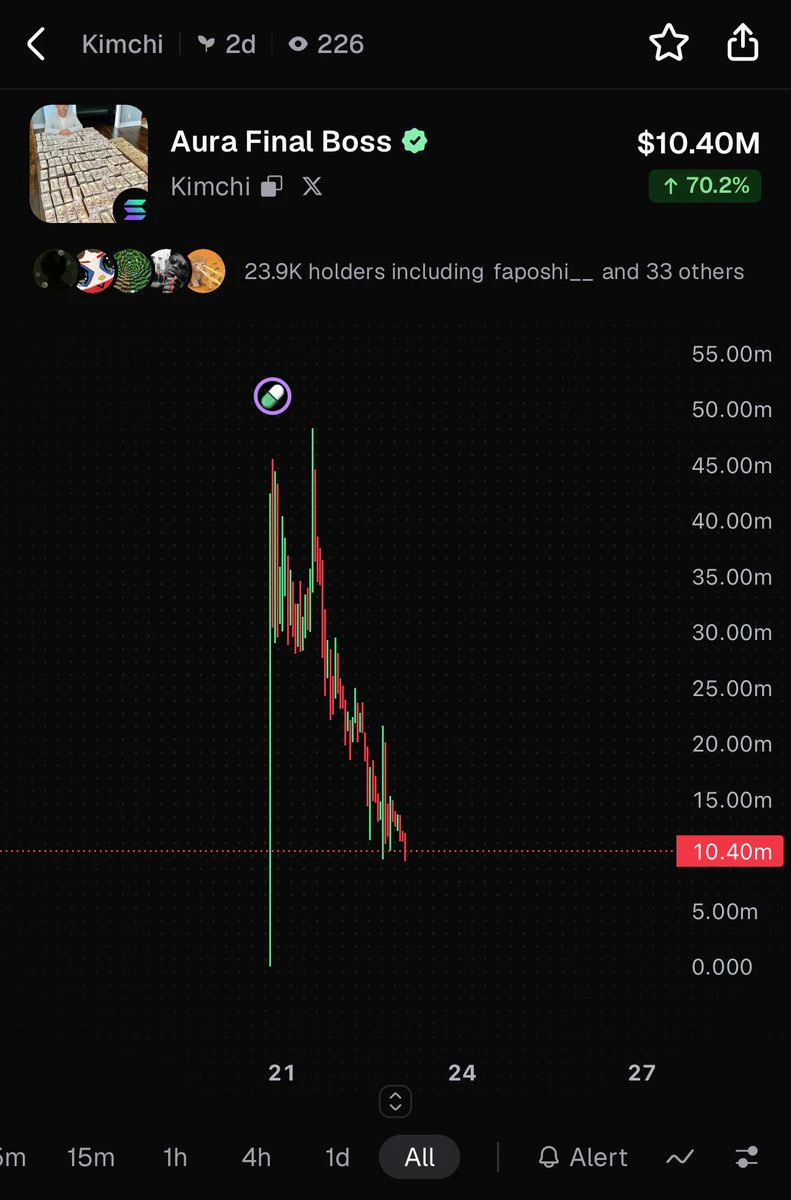
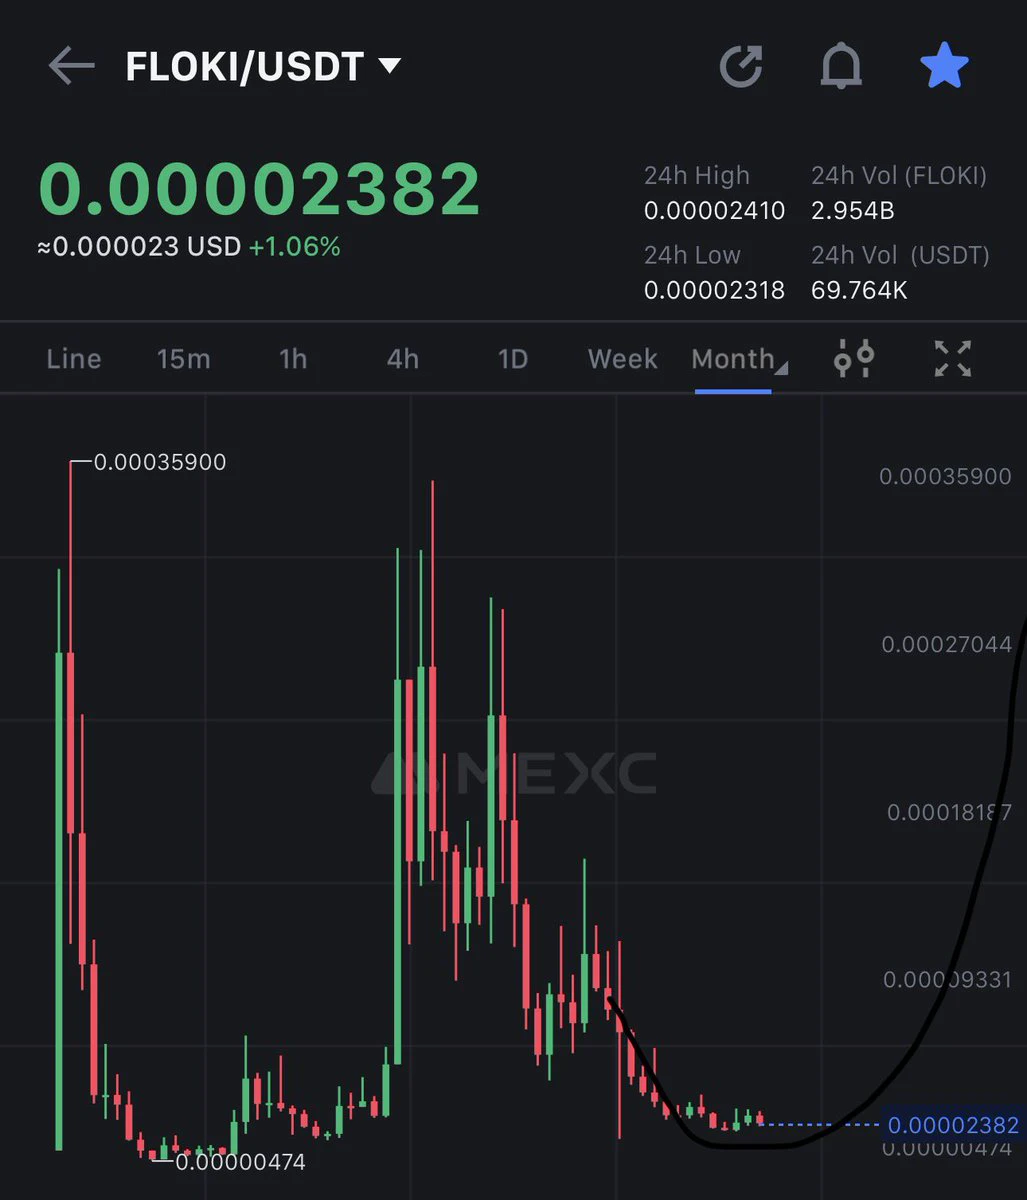
After $DOGE , #SHIB , $PEPE
WHO IS NEXT #100x IN 2026???
post-image
DOGE-3.36%
SHIB-3.06%
PEPE-4.46%
IN+2.03%
Load More

Join 40 M users in our growing community

⚡️ Join 40 M users in the crypto craze discussion

💬 Engage with your favorite top creators

👍 See what interests you

View More