Square
Following
Hot
News
Profile
Share your thoughts
placeholder
Article
$FET took me through a trade like this: the hardest part is knowing when to exit.
This feels like a good spot. Close the position right here. Watching these two today: $SO and $BAT .
post-image
FET+4.26%
BAT+28.27%
$ETH Key resistance ahead?
Ethereum (ETH/USD) is rising toward the pivot, which has been identified as an overlap resistance, and could reverse toward the 1st support, which is a pullback support.
Pivot: 2,566.05
1st Support: 2,344.48
1st Resistance: 2,780.51
Disclaimer:
The opinions given above constitute general market commentary and do not constitute the opinion or advice of Markets or any form of personal or investment advice.
Any opinions, news, research, analyses, prices, other information, or links to third-party sites contained on this website are provided on an "as-is" basis, are inte
post-image
ETH+1.31%
$INJ Short setup… price is testing a strong resistance zone INJ has surged strongly from around 7.05 to the 8.50–8.56 resistance zone. The rebound momentum is strong, but this is exactly where I would stop chasing longs. Short entry: 8.30–8.60 (filled) Next target price: 8.20 Take profit 1: 8.00 Take profit 2: 7.80 Final target: 7.65 Stop-loss: 9.00 After the rapid rebound, the move is beginning to look somewhat overextended, while the price is currently just below resistance. If buyers fail to break through 8.56 effectively, I expect the price to first pull back to test around 8.20, followed
post-image
INJ+10.59%
🔹Whale Dumps BTC and Loads Up on ETH! After selling 237.8 BTC and buying 7,929 ETH, is big money be
live-cover
LIVE46
$ETH is about 9% below where it traded before Bitmine said it would stop buying. And as far as I can tell, Bitmine hasn’t even stopped yet.
Here’s the setup. As of Oct 4, Bitmine held about 6 million ETH, roughly 4.9% of everything out there. Chairman Tom Lee said on Oct 7 it will stop at 5%, about 100,000 ETH away. At around $2,460 an ETH, that’s roughly $246M by my math. Reports say it has $643M in cash and securities, so it isn’t stopping because the money ran out. It’s choosing to stop.
On my Gate chart, ETH sat around 2,700 before Oct 7. It slid to a low of 2,317 on Oct 15, then bounced
post-image
ETH+1.41%
$SIVE 🇸🇪
It’s breaching the neckline (red zone). It broke below the accumulation triangle, though the week hasn’t closed yet
post-image
$BTC Bitcoin is bouncing after a sharp rejection
Bitcoin is bouncing after a sharp rejection and is trying to reclaim structure from the recent breakdown. Price has pushed back above the key support area near $81.6K, which is a positive short-term sign.
The main level to watch now is the $82.4K–$82.8K zone. That area is acting as resistance, and BTC still needs a clean break and hold above it to confirm stronger upside momentum. If that happens, the next move could target the higher resistance region around $83.6K+.
On the downside, if BTC loses $81.6K again, the bounce could fail and price ma
post-image
BTC+0.82%
$SIREN Chinese mitten crab 0xfcfe23be934f34ab01f74c9ef69c2af880a74444
post-image
SIREN+10.64%
#Solana大升级定档
#SolanaMajorUpgradeScheduled
SOLANA’S ALPENGLOW UPGRADE: A MAJOR TECHNICAL BREAKTHROUGH OR A CLASSIC “SELL THE NEWS” EVENT?
Solana is approaching an important milestone, with its Alpenglow consensus upgrade scheduled for October 21, 2026. The announcement has attracted attention across the crypto community because it promises to improve transaction finality and make the network more efficient. However, one important question remains: will this technological progress push SOL higher, or has the market already priced in most of the positive expectations?
In my view, Alpenglow repr
SOL+0.98%
BTC+0.84%
Layout: Bitcoin, Ethereum, Dogecoin
live-cover
LIVE880
  • 4
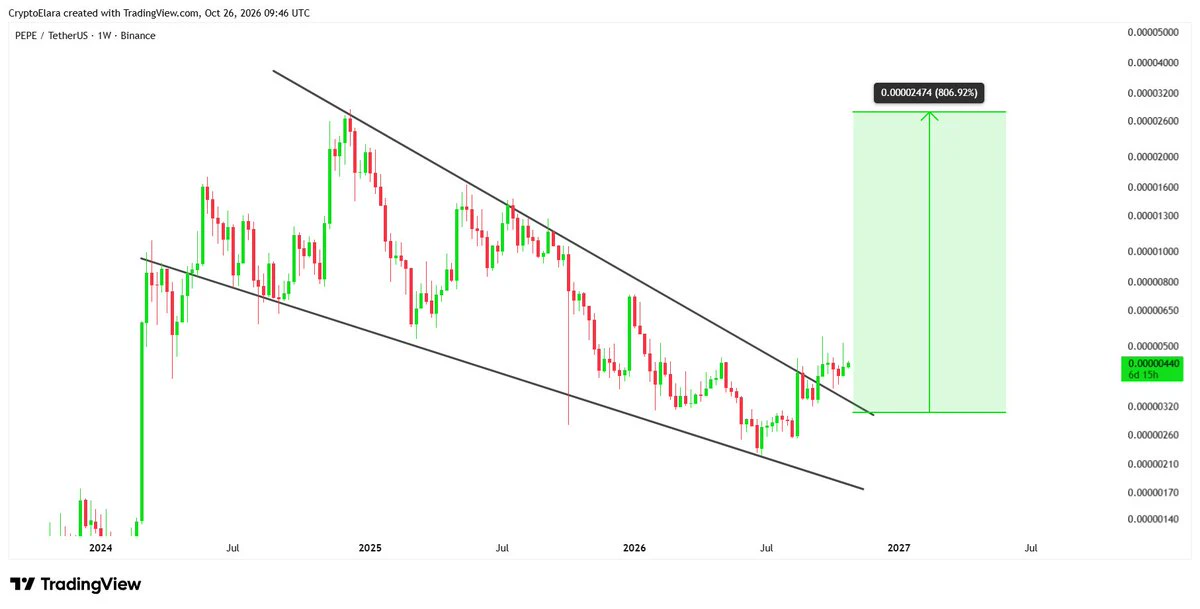
Pepe have magikal skillz of riding things down to $0 & then back up again with gainz 🚀🌙
solana:EEpng77ZPn9FT4xsRjwuxNCcMBYq3HTwEscyTpump MFs get in 🚀🚀 we riding this to the moon 🌖
EEpng77ZPn9FT4xsRjwuxNCcMBYq3HTwEscyTpump
#crypto
post-image
PEPE+0.29%
SOL+0.98%
$BERA Current price 0.2275, 24h -5.88%, trading volume only 5.6M USDT, MA5 at 0.23092 has crossed below MA20 at 0.23155, RSI at 46.6 is weak, the MACD histogram at -2.941e-05 remains bearish, and the Bollinger Bands are [0.214696, 0.248404], with the 30-candle amplitude at approximately 17.58%. The funding rate is -0.0001%, with bears slightly dominant but not at an extreme, and the Fear & Greed Index is neutral at 53—this is a typical low-volume, gradual decline structure rather than panic selling, meaning downside may open slowly instead of being released all at once.
Directional view: Beari
post-image
EPIC-19.18%
$AKE Something is off with this data.
While scanning the market just now, I saw $AKE jump straight from 0.026 to 0.0375, gaining 22 points in 24 hours, with trading volume surging to 179 million. This volume is unusual—normally this coin only does several tens of millions in daily volume, but today it suddenly expanded by so many times. There must be something going on.
Three possibilities: first, the project team is making a move. I haven't seen any positive announcements recently, so it could be capital aggressively pushing the price up; second, someone is aggressively buying spot in prepar
AKE+21.44%
  • 1
$BNB BNBUSDT: +3.4% bounce off $709 — $735 resistance decides next
BNB was the outlier in today's ~$1B liquidation cascade — while ETH fell 5%+ and BTC broke $81K, BNB finished the day green (+0.5%), bouncing 3.4% off its $709 cascade low to $733, a hair under its $735.3 24h high. The tension: genuine relative strength, or just a slower bleed in a market still digesting hot US inflation data?
Trend per timeframe
- Daily: Slid from the $745–747 zone (Oct 14) to a $709 cascade wick (Oct 15 02:00 UTC), then ground back to $733.2 — still ~1.6% below where the selloff began. The recovery reads corr
post-image
BNB-0.23%
Midnight's newly published roadmap targets tokenized deposits, private lending and private swaps for Q4 2026. NIGHT staking and community block production are slated for Q1 2027.
@MidnightNtwrk
NIGHT-3.47%
I thought this was a couple with a huge size difference when I came across this post, but then I clicked into their profile and was shocked. What on earth are you two up to?
post-image
First, a word for the bullish side $AAVE , then one for the bearish side.
The bullish side needs to prove that someone is buying above 158.98; the bearish side needs to prove that nobody is catching it after 147.05 gives way. $AAVE is currently at 158.72, up 3.44% over 24 hours. The 1-hour support is 147.05, resistance is 158.98, and current volume is 0.23 times the average volume of nearly 20 candles.
Before either side has fully presented its evidence, I’m more focused on the fact that $AAVE’s price has already moved, while trading activity and volume have not kept up. We can temporarily bel
post-image
AAVE+2.29%
$DOGE The most unusual detail today is not the drop, but that the funding rate remains positive at +0.0100%, while the price has slipped 0.46%—longs are paying to hold positions, but the market is not rising. This kind of “paid stagnation” is often a signal that the health of the trend needs to be verified.
When using moving averages to determine whether a trend is healthy, the key points are alignment and slope. Currently, MA5=0.081446 is higher than MA20=0.0804545, with the short-term moving average above the long-term moving average, constituting a bullish alignment; however, the gap betwee
post-image
DOGE-1.01%
HYPE+1.39%
TRX+0.06%
They are still hawking the IPO even inside lagos life.
This man must have so much love for the poor 😂
post-image
$merge bottomed . These micro caps always have these random pumps especially if there are hodlers & bots 🤖 see
AGq9Y4TnfkSiP1JTE6ndfAz7nAqTY9NC3qaPuW9Ppump
#crypto
post-image
CAPS-4.00%
Load More

Join 40 M users in our growing community

⚡️ Join 40 M users in the crypto craze discussion

💬 Engage with your favorite top creators

👍 See what interests you

Trending Topics

USSeptemberPPIBeatsExpectations

91.35k Views1.88k Discussing

US September PPI came in at 6.3% YoY, well above the 5.3% market expectation, pointing to renewed producer-side inflation pressure. Weekly jobless claims were 199K, broadly in line with forecasts. Could hotter inflation further reduce room for rate cuts, and what does it mean for $BTC, US stocks, and gold?

DrLinHanSpeaksAtOxfordUnion

135.63k Views1.86k Discussing

JapanAndKoreaStocksPlunge

47.27k Views1.76k Discussing

View More