Square
Following
Hot
News
Notifications
Profile
Share your thoughts
placeholder
Article
#CLARITYActCouldBeDelayedUntil2028
CLARITY Act Could Be Delayed Until 2028: What Does It Mean for Crypto?

The U.S. crypto industry has spent years waiting for one thing that traditional financial markets already take for granted: clearer rules about who regulates what.

The CLARITY Act was supposed to address a major part of that uncertainty by defining the regulatory responsibilities of the SEC and CFTC and establishing a clearer framework for digital asset markets. But its political path has become considerably more complicated.

Following the November midterms, Democrats have regained con
post-image
BTC-0.67%
GENIUS+1.22%
  • 5
Can't you meet it?😂
Trenches
ZIG
Z
bade
b
ZIG
0x8c...1145
Market Cap
$.
Change
.
24h Vol
$.
Holders
.
BTC
B
bade
b
BTC
C5xp...pump
Market Cap
$.
Change
.
24h Vol
$.
Holders
.
STONK
S
bade
b
STONK
6GmA...UNgx
Market Cap
$.
Change
.
24h Vol
$.
Holders
.
DESSA
D
bade
b
DESSA
npz2...pump
Market Cap
$.
Change
.
24h Vol
$.
Holders
CORLA
C
bade
b
CORLA
0xba...7777
Market Cap
$.
Change
.
24h Vol
$.
Holders
.
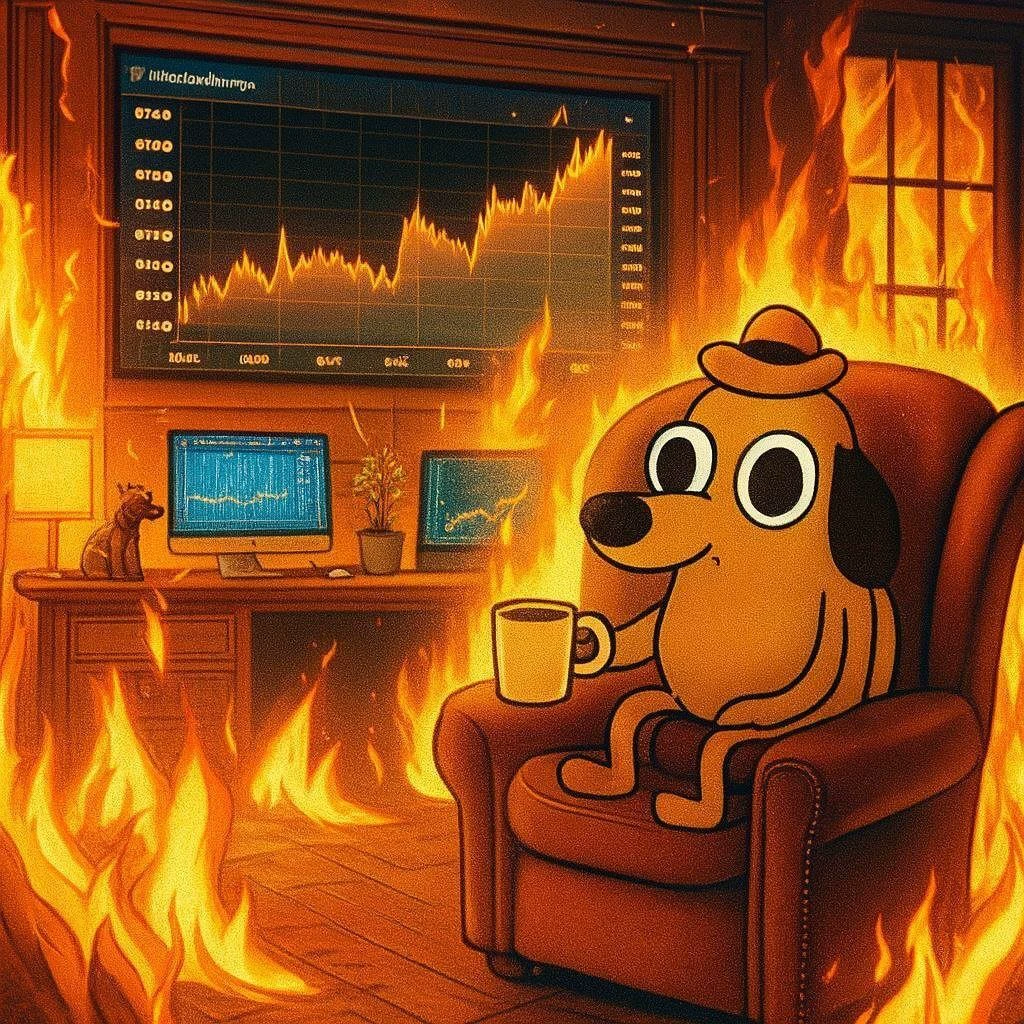
Aghhh fine'ally made it home.
Have a great night everyone see you all tomorrow.
Everything is fine!
🔥🐶🔥
post-image
#Epic Sell-Off in U.S. StocksTech stocks are facing a wave of heavy
live-cover
LIVE2,254
Bitcoin falling isn't scary; what's scary is having too large a position! What should BTC and ETH investors do now?

The most thrilling thing about crypto is that when prices rise, you feel like an investing genius, and when they fall, you start questioning your life.

As BTC and ETH weaken along with overall risk assets, investors face a practical question: keep holding, reduce positions, or buy more on the dip?

My view is that the first thing to do right now is not predict prices, but assess your own risk tolerance.

If your position is too large, appropriately reducing your risk exposure i
BTC-0.67%
ETH-1.26%
Long-term market outlook reference

BTC currently at 75585.1, ETH currently at 2221.00
Both major assets have completed a pullback after a rally over the larger time frame. This is a cyclical consolidation following an upswing; the long-term bottom structure remains intact, and downside room is gradually narrowing, making it unsuitable to chase shorts. Wait for a retest of the long-term support zone and, once signs of stabilization emerge, build a core position in batches to position for a new upward trend.

Long-term strategy: scale in on pullbacks
BTC: wait for a pullback to 73000‑74500; fir
BTC-0.67%
ETH-1.26%
What Is the Break-Even Win Rate? How High Does a Trading Strategy’s Win Rate Need to Be to Cover Trading Costs?

In cryptocurrency trading, many people know their win rate but not how high it needs to be to actually make money. If winning trades earn little while losing trades lose a lot, you may still end up losing money even if you make the right call more often. The break-even win rate can help traders understand the minimum performance their strategy needs to achieve.

First, what is the break-even win rate?

The break-even win rate is the minimum win rate required for long-term expected r
post-image
BTC UPDATES
live-cover
LIVE1,959
#CryptoMarketUnderPressure
‍#DailyStandouts #ShareWeekly $ETH $XRP $SOL
Crypto Market Under Pressure: Macro Selloff or Internal Liquidity Stress?

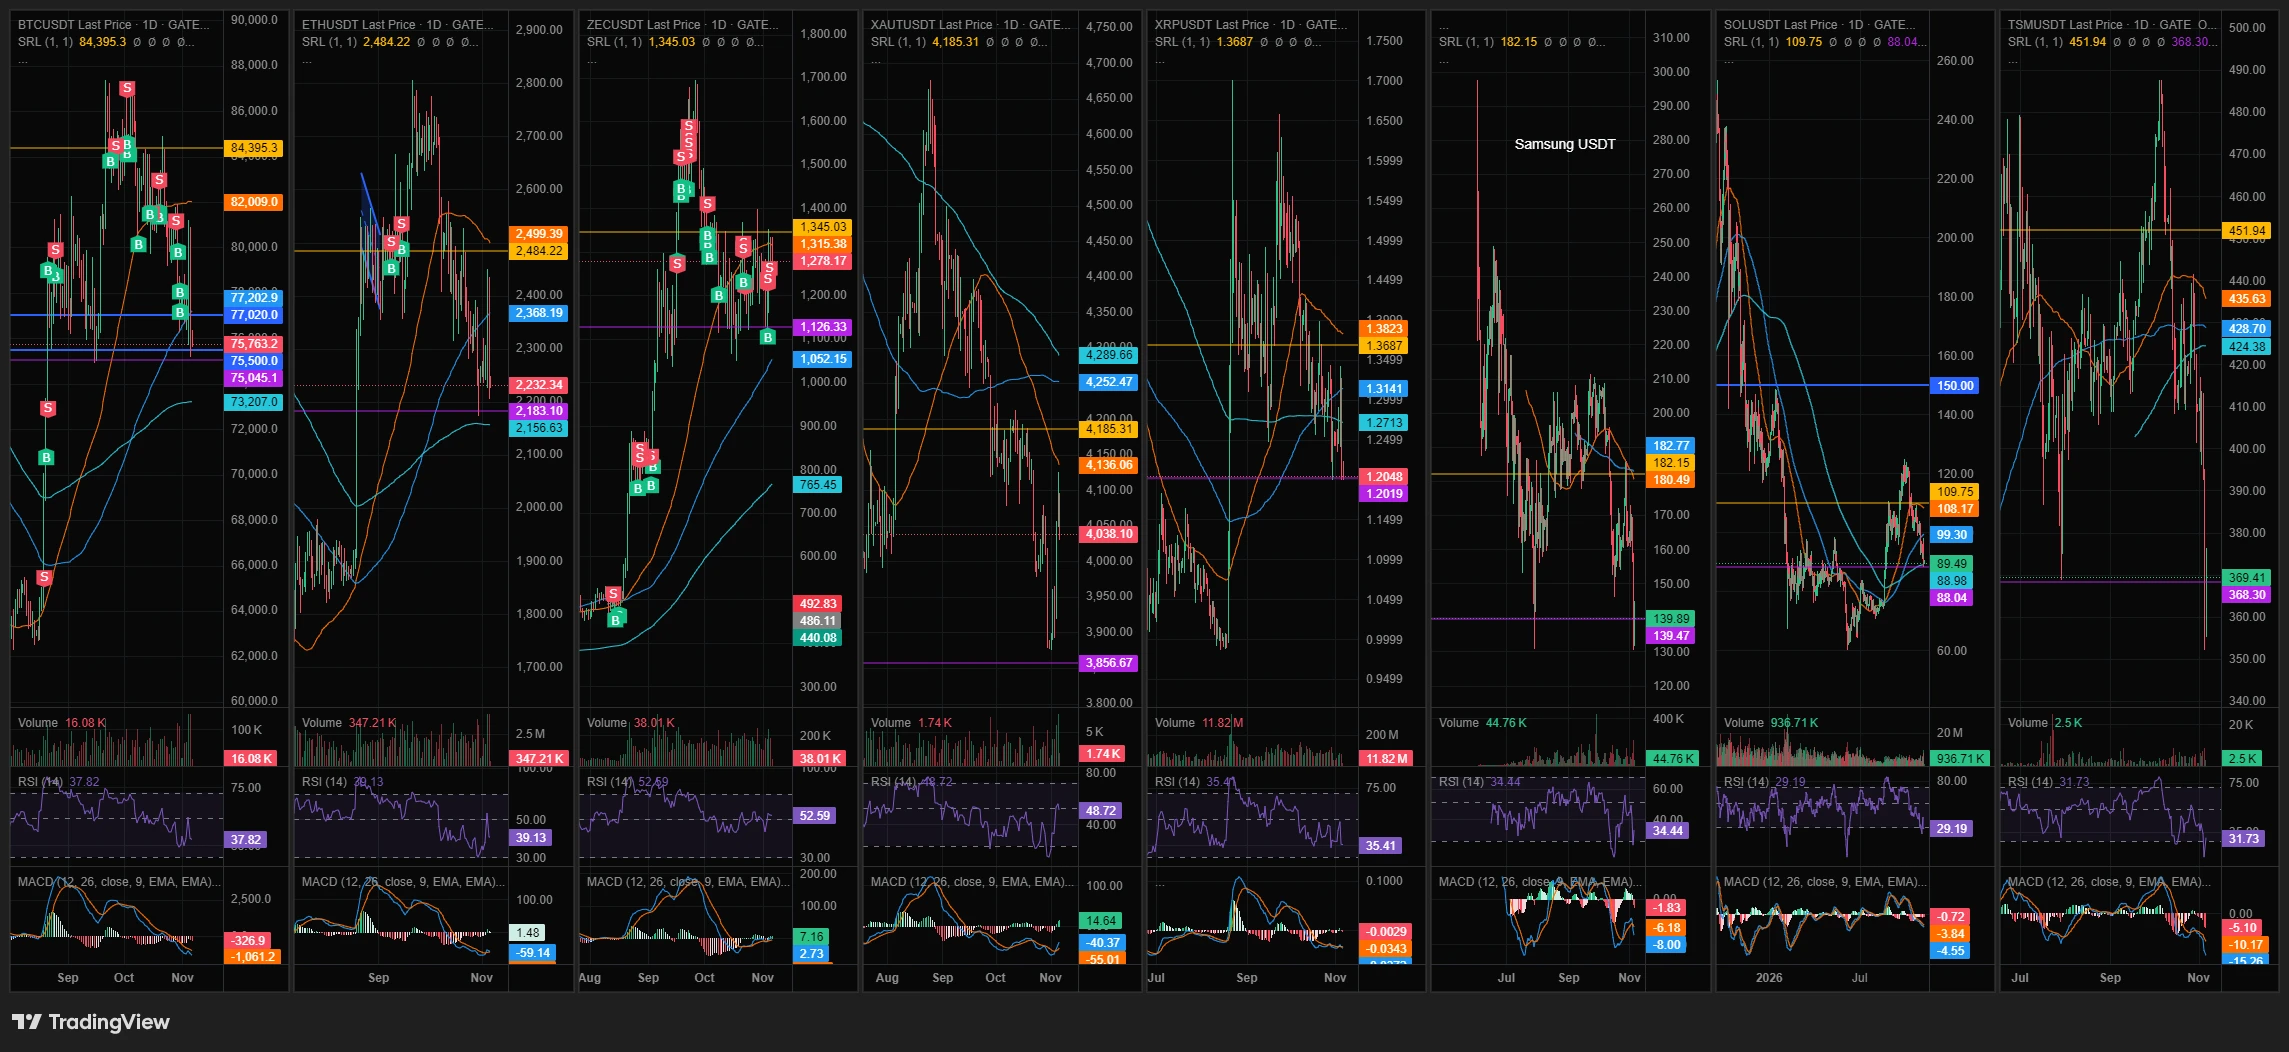
Crypto is facing pressure from two directions at the same time. Bitcoin, Ethereum, Solana and XRP have all moved lower as global risk appetite weakened, but the decline is exposing something deeper: the crypto market's own liquidity and positioning conditions are not particularly strong either.

I would not treat this as just another temporary reaction to falling technology stocks.

The macro connection is becoming harder to ignore

The November 5
post-image
ETH-1.23%
XRP-1.12%
SOL-0.74%
  • 7
$UAI $UAI is now heavily long, with a long entry price of 0.1558 and a later sale at $0.4420 $UAI 👇
post-image
UAI-7.58%
  • 1
#USNonfarmPayrolls
#USNonfarmPayrolls

The US Nonfarm Payrolls report is one of the most important economic indicators in the global financial market. It provides important information about job growth in the United States and helps investors understand the overall condition of the US economy.

This report shows how many jobs were added or lost during the previous month, excluding certain sectors such as agriculture. Strong employment growth can indicate that the economy is still healthy, while weaker job growth may suggest that economic activity is slowing down.

Investors closely watch Nonf
XAU+0.38%
BTC-0.67%
  • 3
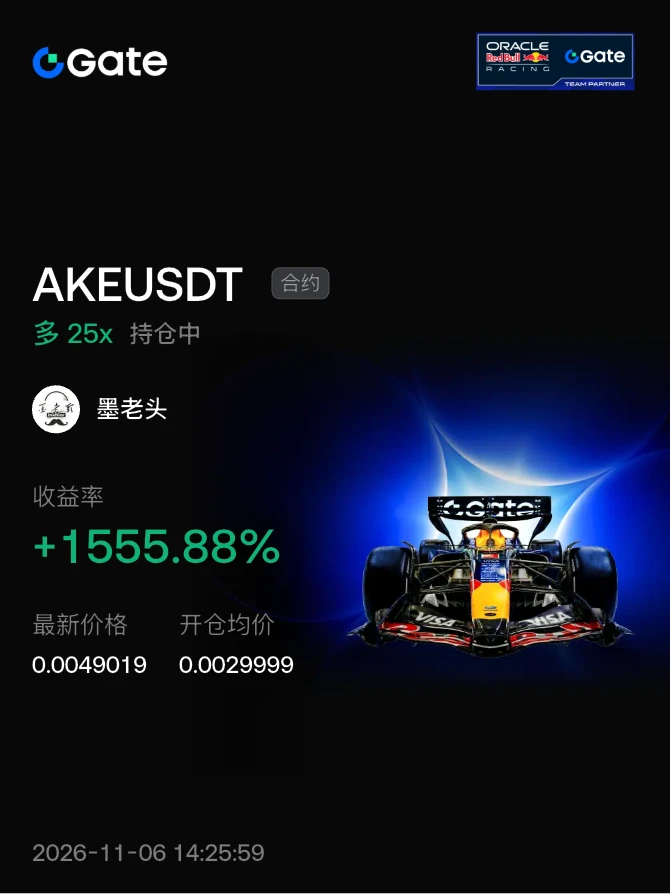
#晒出我的持仓收益
What was I saying? Life needs a few ups and downs; otherwise, how is it any different from being a salted fish?🤐
post-image
  • 8
  • 2
At noon on June 23,
I had written the course of my own fate,
and my words came true
post-image
Gm
Its friyayyyyyyy
post-image
📣 Daily standout post call|Don’t keep great posts to yourself—see you in the comments

Which post have you written recently that you’d most like everyone to take a closer look at? 🔎

Well-grounded market analysis, trading recaps that spell out the wins and losses, clearly explained knowledge sharing… all are welcome.

💬 Leave this in the comments: a link to the original Square post + one thing that makes it worth a look
Feel free to recommend your own post, or share a great post by another author. If you come across an opinion that interests you, open the original post and chat with the aut
post-image
  • 8
  • 1
Gold rebounds sharply and pulls back, then continues to fall; the quantitative system captures the optimal entry point
post-image
GLDX-0.40%
PAXG+0.37%
XAU+0.38%
How much business information can others glean from a stablecoin payment once it’s on-chain?
Suppose a company uses stablecoins to pay its suppliers every week. Looking at a single transfer, you might only know how much was paid. But if the payment address is linked to the company’s identity, looking at several months of transactions together could let an observer infer who it works with, whether its purchasing volume has changed, and even which suppliers are being replaced.
This information might normally be scattered across contracts, invoices, and internal ledgers. On a public blockchain, t
post-image
BNB-0.76%
What Is Trading Signal Confluence? Why Doesn’t It Guarantee a Successful Trade When Multiple Indicators Generate Similar Signals at the Same Time?

In cryptocurrency trading, traders often use moving averages, RSI, MACD, volume, and support and resistance analysis to assess the market. When multiple signals point in the same direction, many people assume the trade is more likely to succeed. But more signals do not necessarily mean stronger evidence, much less that the market outcome is certain.

First, what is trading signal confluence?

Trading signal confluence refers to different analytical
post-image
330U Copy Trading Experiment | Day 30

I smart-copied a top trader's trades!
Come take a look (^v^)
Starting capital: 330U; current funds: 435.76U; return: 153.26%. (400U has been withdrawn during this period)

Just a quick update today:

Currently flat, waiting for Aoying's next trade.
My hands are idle, but my eyes are on the market, waiting for a signal.

Keep it up, guys!
Believe in the power of belief! 🦅
post-image
  • 2
Last night, we warned in advance not to buy the dip; today's market has once again validated that call!

Early yesterday morning, we clearly said not to rush into longs in this kind of market, and not to assume that a drop means you can buy the bottom.

BTC fell steadily from around 80500, hitting a low of 75158; ETH fell from around 2449 to a low of 2205.

The market still shows no clear reversal today, with both coins trading weakly in a range near their lows.

Many people see a drop and immediately think about buying the dip, believing prices have fallen enough. But trading can't rely on gu
BTC-0.65%
ETH-1.23%
Load More

Join 40 M users in our growing community

⚡️ Join 40 M users in the crypto craze discussion

💬 Engage with your favorite top creators

👍 See what interests you

Trending Topics

USStocksFaceHistoricSelloff

2.23k Views3.58k Discussing

U.S. stocks suffered a sharp selloff on Thursday, with the Nasdaq closing down more than 5% and the Philadelphia Semiconductor Index falling over 12%. AI and chip stocks including $NVDA and $AMD were hit especially hard. Markets are reassessing AI valuations, data-center spending and future returns. Is this just short-term deleveraging, or the start of a deeper correction in the AI trade? Which sectors are you watching next?

GateLaunchesPoSECProofOfSecurity

13.06k Views579 Discussing

USNonfarmPayrolls

11.25k Views4.02k Discussing

View More