Square
Following
Hot
News
Notifications
Profile

Engin1979

vip
No content yet
Peak Tier VIP 53.0 Year(s)
16
Following
81
Followers
2.9k
Liked
🎁 Share stock ideas, earn rewards — new creators get an extra bonus
Gate Square Stock Talk Season is live
Complete event registration to receive a 10 USDT Stock Futures Position Voucher.
👉 Register now:https://www.gate.com/campaigns/6898

If you haven’t posted on Gate Square before, publish your first qualifying original stock post during the event:
🆕 The first 1,000 eligible new Gate Square creators
Each receives 5 USDT in Stock Trial Funds

Start with a stock you follow. Share your view, reasoning, or trading recap.
Post original content with #GateStockTalkSeason 👇
Gate_Square
🎁 Share stock ideas, earn rewards — new creators get an extra bonus
Gate Square Stock Talk Season is live
Complete event registration to receive a 10 USDT Stock Futures Position Voucher.
👉 Register now:https://www.gate.com/campaigns/6898

If you haven’t posted on Gate Square before, publish your first qualifying original stock post during the event:
🆕 The first 1,000 eligible new Gate Square creators
Each receives 5 USDT in Stock Trial Funds

Start with a stock you follow. Share your view, reasoning, or trading recap.
Post original content with #GateStockTalkSeason 👇
repost-content-media
🏆 Gate Live Rising Streamers Ranking Vol.04
Congratulations to the following streamers for making the list with their high-quality content and growing popularity! Each featured streamer will also receive 100 USDT Position Voucher 🎁 Check out the lineup and see if your favorite streamer made it ⚡

⭐ cryptosana
Deeply rooted in the cryptocurrency market, with a focus on market analysis
https://www.gate.com/profile/g1bF8rQZW25w7QRkS2

⭐ ObsidianXboy
hands-on crypto market practitioner: identify trends, capture key entry and exit levels
https://www.gate.com/profile/%20ObsidianXboy

⭐ Crypto Tre
GateLive
🏆 Gate Live Rising Streamers Ranking Vol.04
Congratulations to the following streamers for making the list with their high-quality content and growing popularity! Each featured streamer will also receive 100 USDT Position Voucher 🎁 Check out the lineup and see if your favorite streamer made it ⚡

⭐ cryptosana
Deeply rooted in the cryptocurrency market, with a focus on market analysis
https://www.gate.com/profile/g1bF8rQZW25w7QRkS2

⭐ ObsidianXboy
hands-on crypto market practitioner: identify trends, capture key entry and exit levels
https://www.gate.com/profile/%20ObsidianXboy

⭐ Crypto Trendista
Insightful Analysis of Market Trends
https://www.gate.com/profile/Crypto%20Trendista

⭐ skyvera
In-Depth Analysis of Market-Moving Events
https://www.gate.com/profile/skyvera%20

⭐ cryptomafiagirl
BTC Market Analysis and Price Outlook
https://www.gate.com/profile/cryptomafiagirl

A big thank you to every streamer who continues to create quality content and go live consistently. We will keep discovering outstanding creators and providing more exposure and growth opportunities for talented streamers.

🔔 Follow your favorite streamers and never miss a live session!
Who would you like to see in the next ranking? Leave your recommendation in the comments below 👇
repost-content-media
BTC-0.67%
  • 1
🌈 Gate Live Streaming Inspiration - Nov.5

Today's Topic Recommendations:
🔹Democrats Sweep Both Chambers of Congress as the Dow Surges Over 3%! But AI Stocks Fall Across the Board. Is a Major Sector Rotation Underway in U.S. Stocks?
🔹KOL View: Tom Lee Remains Bullish on the AI Trade! With Tech Stocks Facing Repeated Sell-Offs, Is This a Crisis or a Buying Opportunity?
🔹Chip Stocks Are Falling, but Demand Hasn't Weakened? With Democratic Regulatory Expectations Shaking Markets, Are Semiconductor Stocks Being Unfairly Punished?
🔹OpenAI Uncovers 948 Linux Vulnerabilities in One Run! As AI-Po
GateLive
🌈 Gate Live Streaming Inspiration - Nov.5

Today's Topic Recommendations:
🔹Democrats Sweep Both Chambers of Congress as the Dow Surges Over 3%! But AI Stocks Fall Across the Board. Is a Major Sector Rotation Underway in U.S. Stocks?
🔹KOL View: Tom Lee Remains Bullish on the AI Trade! With Tech Stocks Facing Repeated Sell-Offs, Is This a Crisis or a Buying Opportunity?
🔹Chip Stocks Are Falling, but Demand Hasn't Weakened? With Democratic Regulatory Expectations Shaking Markets, Are Semiconductor Stocks Being Unfairly Punished?
🔹OpenAI Uncovers 948 Linux Vulnerabilities in One Run! As AI-Powered Hacking Capabilities Advance Rapidly, Is the Cybersecurity Industry Heading for a Major Shakeup?
🔹A-Share and Hong Kong Stock Markets Weaken in Pre-Market Trading! ChangXin and MiniMax Drop Around 2%. Could the AI Tech Stock Correction Spread Across Asian Markets?
🔹What Happens If BTC Breaks Above $82,000? With $337 Million in Short Positions Facing Liquidation Pressure, Is a Major Short Squeeze About to Begin?
🔹AI Stocks Face Indiscriminate Selling! Some Memory Stocks Trade at Annualized P/E Ratios as Low as 1.6x. Are These Once-in-a-Lifetime Buying Opportunities or Value Traps?
🔹Trump Links Republican Election Losses to the Iran Issue! With Middle East Policy Controversies Heating Up, How Will Oil and Safe-Haven Assets React?
🔹Whale Starts Cutting Losses on a $148 Million Oil Long Position! Still Holding Nearly $100 Million in Bullish Bets, Is an Oil Price Rebound Coming?
🔹Democrats Continue Pushing the CLARITY Act! With the SEC Potentially Gaining More Authority, Is U.S. Crypto Regulation Heading for a Major Overhaul?

Pick any topic and go live for a chance to be featured on the homepage!
🔥 More livestream topic ideas and tips: https://www.gate.com/help/community-center/live_chat/49345
repost-content-media
BTC-0.65%
☀️ GM! The market has switched gears again—which direction are you watching today? 📺
The Nasdaq rose 1.4% last night, but semiconductor stocks weakened against the trend, while BTC rebounded to around $80K . 👀
📌 Today's featured topics: The market is moving in different directions—which one are you watching most closely?
₿ BTC: Can the rebound continue?
💻 U.S. tech stocks: The broader market is strong, so why are chip stocks lagging behind?
📊 U.S. nonfarm payrolls: The data comes out tomorrow night—how are you preparing?
The market is moving at different paces. What's your take?
🎁 Share
GateSquare
☀️ GM! The market has switched gears again—which direction are you watching today? 📺

The Nasdaq rose 1.4% last night, but semiconductor stocks weakened against the trend, while BTC rebounded to around $80K . 👀

📌 Today's featured topics: The market is moving in different directions—which one are you watching most closely?

₿ BTC: Can the rebound continue?
💻 U.S. tech stocks: The broader market is strong, so why are chip stocks lagging behind?
📊 U.S. nonfarm payrolls: The data comes out tomorrow night—how are you preparing?

The market is moving at different paces. What's your take?

🎁 Share your market insights and trading plans on Gate Square. Post to earn red packet rewards, with large red packets also dropping at random. High-quality posts may also be featured.

👇 Show us the market signals you're watching most closely:
https://www.gate.com/post
repost-content-media
NDAQ-2.63%
BTC-0.67%
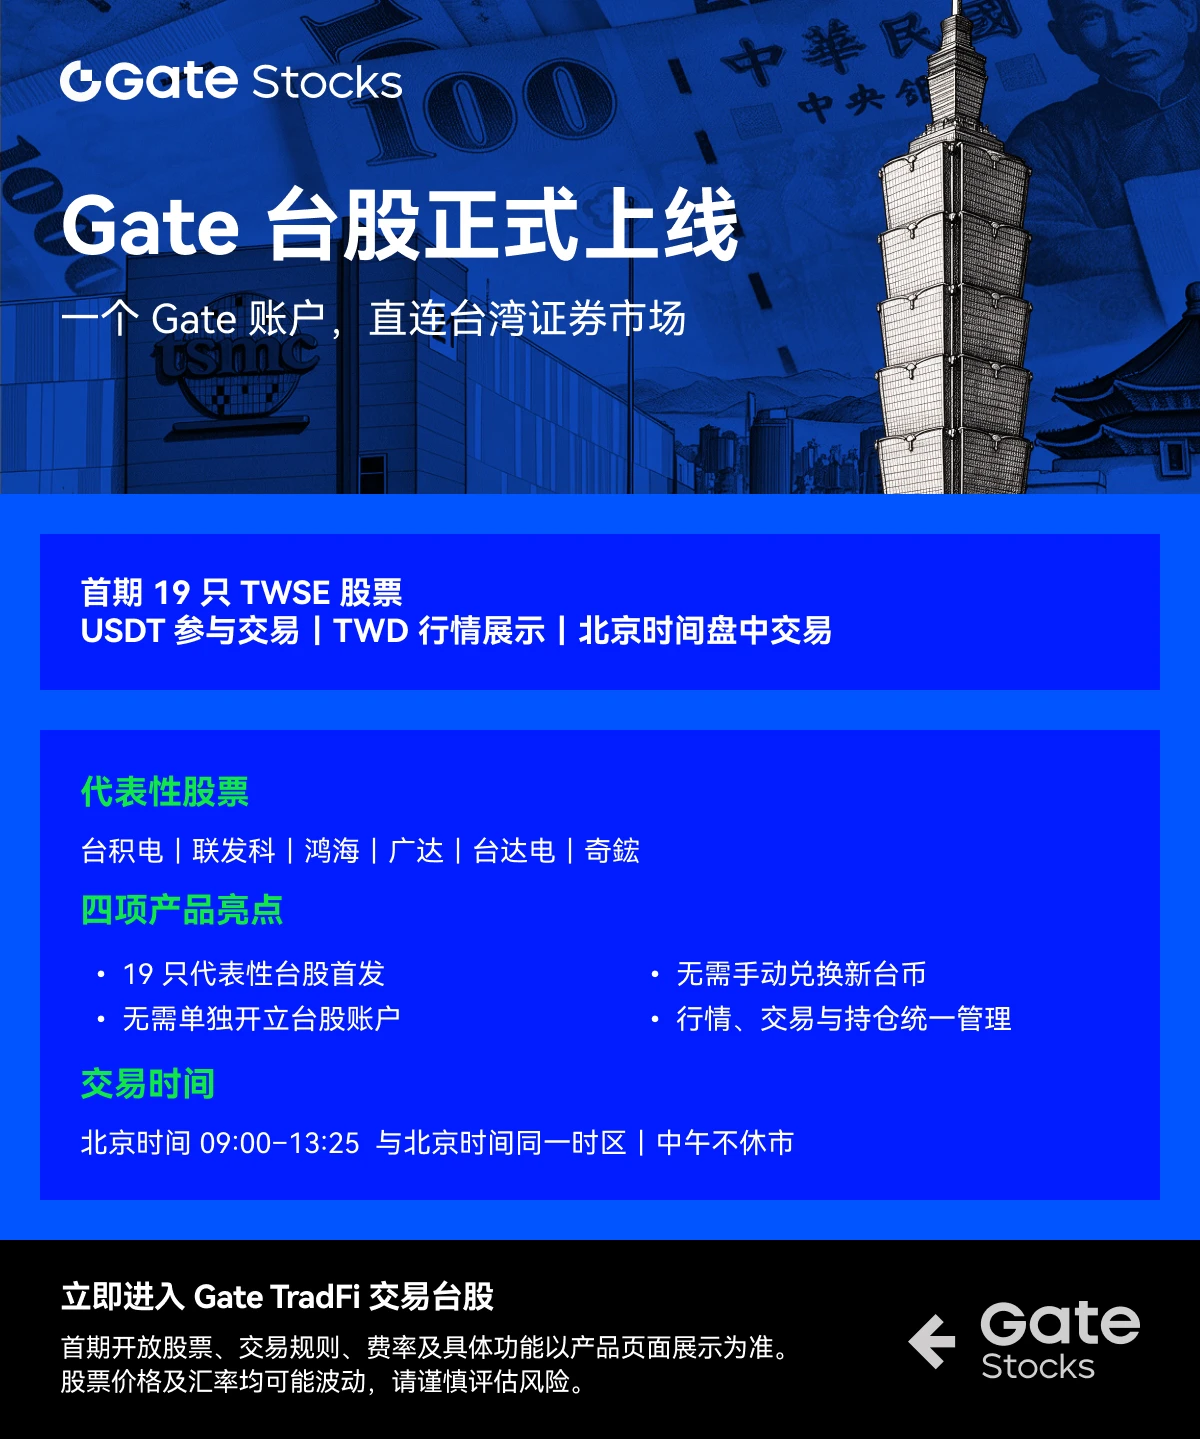
🚀 Gate officially launches Taiwan stock trading|Post and discuss for a chance to win red envelopes worth up to 10 USDT!
📊 Gate continues to expand its global asset trading footprint!
The first batch supports 19 Taiwan stocks
Trade directly using $USDT
Including popular stocks such as TSMC (2330) and MediaTek (2454)
💬 If you could use $USDT to invest in Taiwan stocks, which one are you most bullish on? TSMC, MediaTek, or another AI supply chain stock?
🎁 Join the discussion with #Gate上线台股交易 !
New users who post: 100% chance to win
Weekly leaderboard rewards: up to 100 USDT
Sign up now 👉 h
GateSquare
🚀 Gate officially launches Taiwan stock trading|Post and discuss for a chance to win red envelopes worth up to 10 USDT!

📊 Gate continues to expand its global asset trading footprint!
The first batch supports 19 Taiwan stocks
Trade directly using $USDT
Including popular stocks such as TSMC (2330) and MediaTek (2454)
💬 If you could use $USDT to invest in Taiwan stocks, which one are you most bullish on? TSMC, MediaTek, or another AI supply chain stock?

🎁 Join the discussion with #Gate上线台股交易 !
New users who post: 100% chance to win
Weekly leaderboard rewards: up to 100 USDT

Sign up now 👉 https://www.gate.com/campaigns/6244
Post now 👉 https://www.gate.com/post/topic/GateLaunchesTaiwanStockTrading?topic_id=211714
repost-content-media
TSM+5.36%
📈 Gate Taiwan stocks officially go live, adding a new investment option in the AI industry chain
Gate's first batch features 19 TWSE stocks, including popular names such as TSMC, MediaTek, Hon Hai, and Quanta.
🔥 Trading highlights
▪️ Trade Taiwan stocks with just one Gate stock account
▪️ Trade using USDT, with no need to manually exchange for New Taiwan dollars
▪️ Supports TWD price quotes, holdings, and profit and loss display
▪️ Trading hours: 09:00–13:25 Beijing time, with no midday break
💬 TSMC, MediaTek, or Hon Hai—which do you think has the greatest long-term potential in the AI boom
GateSquare
📈 Gate Taiwan stocks officially go live, adding a new investment option in the AI industry chain

Gate's first batch features 19 TWSE stocks, including popular names such as TSMC, MediaTek, Hon Hai, and Quanta.

🔥 Trading highlights
▪️ Trade Taiwan stocks with just one Gate stock account
▪️ Trade using USDT, with no need to manually exchange for New Taiwan dollars
▪️ Supports TWD price quotes, holdings, and profit and loss display
▪️ Trading hours: 09:00–13:25 Beijing time, with no midday break

💬 TSMC, MediaTek, or Hon Hai—which do you think has the greatest long-term potential in the AI boom?
Join #Gate上线台股交易 on Gate Square to share your watchlist, market views, or trading ideas.

✨ High-quality content may be featured and receive traffic support.

👉 Taiwan stock trading:
https://www.gate.com/stocks/2330
📖 Learn more:
https://www.gate.com/announcements/article/102594
repost-content-media
🎉 Gate Square New Creator Rewards Are Here! Get 2x Exposure for 14 Days!
Join Now: https://www.gate.com/campaigns/6880
🎁 4 Exclusive New Creator Benefits!
1️⃣ Post Rewards: 0.1 USDT per post, up to 0.5 daily, weekly pool 10,000 USDT.
2️⃣ 2x Exposure: Double exposure for 14 days.
3️⃣ Daily Picks: 3 winners daily, each gets a 100 USDT Position Voucher.
4️⃣ Referral Rewards: Refer a friend, both get a 50 USDT Position Voucher.
🔥 Start posting, grow your fans, and earn rewards!
Details: https://www.gate.com/announcements/article/102585
Gate_Square
🎉 Gate Square New Creator Rewards Are Here! Get 2x Exposure for 14 Days!

Join Now: https://www.gate.com/campaigns/6880

🎁 4 Exclusive New Creator Benefits!
1️⃣ Post Rewards: 0.1 USDT per post, up to 0.5 daily, weekly pool 10,000 USDT.
2️⃣ 2x Exposure: Double exposure for 14 days.
3️⃣ Daily Picks: 3 winners daily, each gets a 100 USDT Position Voucher.
4️⃣ Referral Rewards: Refer a friend, both get a 50 USDT Position Voucher.

🔥 Start posting, grow your fans, and earn rewards!
Details: https://www.gate.com/announcements/article/102585
repost-content-media
#WCTCS9 #BTC #ShareWeekly
Bitcoin Analysis: Testing the 77,000 Support Zone, Key Levels and Trade Plan
Bitcoin is trading near 77,750 USDT, down about 2.3 percent over the past seven days and roughly 10 percent below its early October high near 86,700. The daily chart shows sellers in control since the rejection around 84,000 to 84,900 in the third week of October. The market is now testing whether the 76,300 to 77,500 demand zone can hold. My view is that BTC is in a corrective bear phase on the daily timeframe, but it sits at a level where a sharp short squeeze is possible if buyers defend
HighAmbition
#WCTCS9 #BTC #ShareWeekly
Bitcoin Analysis: Testing the 77,000 Support Zone, Key Levels and Trade Plan

Bitcoin is trading near 77,750 USDT, down about 2.3 percent over the past seven days and roughly 10 percent below its early October high near 86,700. The daily chart shows sellers in control since the rejection around 84,000 to 84,900 in the third week of October. The market is now testing whether the 76,300 to 77,500 demand zone can hold. My view is that BTC is in a corrective bear phase on the daily timeframe, but it sits at a level where a sharp short squeeze is possible if buyers defend this area.

On the 1-day chart, BTC has printed a series of lower highs: about 86,700 on October 6, about 84,400 on October 22, and a failed bounce toward 81,900 on October 28. The decisive move came on October 29, when price broke below 80,000, fell below the short-term moving averages, and turned the 30-day average into resistance. On October 30 the price wicked down to 76,283 and recovered, leaving a long lower shadow. That wick is the most important support marker on the chart right now. The October 31 candle closed at 78,341, and today's session opened near 78,342, but price has slipped back below 78,000. The recovery is not yet confirmed.

On the 7-day view, the trend remains negative. The 7-day change is about minus 2.3 percent, and the market has been making lower highs since early October. However, the structure is not yet a full breakdown, because price has held above the 76,000 region and has not produced a daily close below the October 30 low. That distinction matters for trade planning.

Moving averages show the short-term weakness. The 7-day MA is near 79,083 and the 30-day MA is near 81,916, so price is below both. The 120-day MA sits near 74,426 and the 200-day MA near 73,195, and price remains well above these long-term averages. This suggests the broader uptrend from earlier in the year has not been broken. The bear case is a correction inside a larger structure, not yet a full cycle reversal. The EMA 200 near 74,539 is a deeper support I am watching if the 76,300 zone fails.

Bollinger Bands give a similar picture. The middle band is near 80,929, the upper band near 84,578, and the lower band near 77,280. Price is below the middle band and close to the lower band. Momentum is weak, but the market is not in extreme oversold territory. The 30-day volatility measure is about 1.5 percent per day, so a move of 3 to 4 percent in either direction within a few sessions is realistic.

Momentum indicators lean bearish but are not extreme. Daily RSI is about 39.5, below the neutral 50 line, so bears still have the upper hand, yet it is not oversold below 30. Stochastic readings are low, with K near 25 and D near 24, which allows for a short-term bounce if support holds. MACD remains negative at about minus 455, with the signal line near minus 648, and the histogram is negative. I want to see a bullish MACD crossover before calling a trend change. ADX is near 17, meaning trend strength is weak. The DI minus line near 28 sits above the DI plus line near 15, confirming that bearish direction still dominates. The Parabolic SAR is near 83,190, above price, which stays bearish until price closes above it. Williams %R near minus 76 is leaning oversold but not extreme.

Market sentiment looks cautious rather than panicked. Price has held above 76,000 through several sessions of selling, which suggests spot buyers are still active near these levels. Strategy, Michael Saylor's company, has kept buying bitcoin. Reports from October put its holdings at roughly 848,000 to 848,500 BTC, with further purchases in the week of October 19. Saylor posted a purchase chart on November 1, which many traders read as a hint of another buy. At the same time, MSCI is due to announce its index decision on November 11, and some analysts are discussing whether Strategy could face index-related selling pressure. This creates two-sided risk. Continued treasury buying supports sentiment, while index uncertainty could add volatility. I do not treat Strategy purchases as a guaranteed price driver, but they are a useful sentiment signal to watch alongside the chart.

Key resistance levels are as follows. 79,100 is the 7-day MA and a recent intraday pivot. 80,900 is the 30-day MA and the Bollinger middle band, and it is the first level bulls must reclaim. 81,900 to 82,000 is the October 28 rejection zone. 84,400 to 84,900 covers the October 21 and 22 highs and the upper Bollinger region. 86,700 is the October 6 high, the level that must be reclaimed for a real trend reversal.

Key support levels are as follows. 77,500 to 77,000 is the current demand area, close to the November 1 low near 77,490. 76,300 is the October 30 wick low and the most important line in the market right now. 75,000 is a psychological round number and a previous consolidation shelf. 73,200 to 74,500 contains the 200-day MA and the EMA 200.

For long trades, my base plan is patience at support with defined risk. I prefer entries in the 77,000 to 77,500 zone, and only once price holds above 77,000 on a 4-hour close and reclaims 78,000. The main stop loss sits below 76,300, which would invalidate the support test. Targets are TP1 at 79,100, TP2 at 80,900, and TP3 at 82,000. Using an entry at 77,300 with SL1 at 76,800, SL2 at 76,300, and SL3 at 74,800 as a deeper protective stop, the reward-to-risk to TP1 is about 1.6 to 1 against SL2, rising to about 3.2 to 1 at TP2 and about 4.2 to 1 at TP3. Partial profit taking at TP1 and TP2 makes sense, with the remainder held for TP3 if momentum improves. SL3 is only for traders who accept a wider drawdown and expect a retest of the 200-day MA.

For short trades, I prefer waiting for a rejection rather than chasing. A strong short zone is 80,900 to 81,900, where the 30-day MA, the Bollinger middle band, and the late October breakdown level converge. If price rejects there with a bearish daily or 4-hour candle, I would place the stop above 82,300. Staged risk levels are SL1 at 82,300, SL2 at 83,200 near the SAR level, and SL3 at 84,600 near the upper Bollinger band, depending on position size. Targets are TP1 at 78,000, TP2 at 77,000, and TP3 at 76,300. A daily close below 76,300 would open the path toward 75,000 and then the EMA 200 near 74,500.

The trend call is a bear correction for now, not a confirmed bear market. The bullish case strengthens if BTC closes a daily candle above 80,900 and then above 81,900. That would reclaim the 30-day MA and show sellers losing control. The bearish case becomes dominant if BTC closes below 76,300 on a daily basis, confirming a lower low and opening the path to 75,000 and possibly 73,200. Between these levels, the market is likely to stay range-bound with choppy moves.

For spot accumulation or long positions, the best area is the 76,300 to 77,500 band, provided price shows signs of holding. Scaling in is safer than entering all at once. A first entry near 77,500 and a second near 76,800 spreads the risk. Avoid chasing above 79,000 unless the market closes above that level with strong volume.

My base case for the next seven days is a range of 76,300 to 81,000, with a slight upside bias if 77,000 holds and MACD starts turning up. The bullish scenario targets 81,900 to 82,000 if buyers reclaim the 30-day MA. The bearish scenario targets 75,000 if the 76,300 support fails. These are scenario estimates, not guarantees.

On position size, risk no more than one to two percent of trading capital on any single idea. If you use leverage, keep it low. A 2 to 3 percent move against you can trigger liquidation quickly in a choppy market.

Bitcoin is at a decision point. The short-term daily trend is bearish, but the long-term structure remains above the 120-day and 200-day averages, and the 76,300 wick low gives a clear line for risk management. Wait for confirmation, respect the levels, and do not mistake a bounce for a trend reversal.
repost-content-media
BTC-0.67%
☀️ GM! New month, new watchlist. 🗓️
$AAPL and $AMD earnings are coming up, along with US jobs data, CPI, and PPI. Plenty to watch in November. 👀
📌 What's your top focus this month?
💻 Tech: $AAPL or $AMD earnings?
📊 Macro: Jobs, CPI, or PPI?
₿ Markets: What's next for BTC and stocks?
New month. Pick your focus and share your plan.
🎁 Post your November outlook on Gate Square to claim a red packet, with bigger rewards dropping at random. Quality posts may also get featured.
👇 Share your first take of November:
https://www.gate.com/post
Gate_Square
☀️ GM! New month, new watchlist. 🗓️
$AAPL and $AMD earnings are coming up, along with US jobs data, CPI, and PPI. Plenty to watch in November. 👀

📌 What's your top focus this month?
💻 Tech: $AAPL or $AMD earnings?
📊 Macro: Jobs, CPI, or PPI?
₿ Markets: What's next for BTC and stocks?

New month. Pick your focus and share your plan.
🎁 Post your November outlook on Gate Square to claim a red packet, with bigger rewards dropping at random. Quality posts may also get featured.
👇 Share your first take of November:
https://www.gate.com/post
repost-content-media
AAPL-1.50%
AMD-17.64%
BTC-0.67%
  • 2
🎁 10,000 USDT in rewards are up for grabs! The 2️⃣5️⃣th Growth Points Lottery ends in 4 days!
Spend 300 Growth Points per draw, up to 10 draws daily, with a 100% chance to win! 🤩
💫 Interact every day to earn Growth Points with ease
🔹 Explore the Square: post, like, comment, and share for up to +600 per day
🔹 Watch livestreams: watch, book, like, comment, and share for up to +300 per day
🔹 Join Hot Chat: participate in discussions and share trading cards for up to +90 per day
🔹 Creator bonus: publish content featuring specified tokens or trading cards for up to +300 per task
🎉 Enter the
GateSquare
🎁 10,000 USDT in rewards are up for grabs! The 2️⃣5️⃣th Growth Points Lottery ends in 4 days!
Spend 300 Growth Points per draw, up to 10 draws daily, with a 100% chance to win! 🤩

💫 Interact every day to earn Growth Points with ease
🔹 Explore the Square: post, like, comment, and share for up to +600 per day
🔹 Watch livestreams: watch, book, like, comment, and share for up to +300 per day
🔹 Join Hot Chat: participate in discussions and share trading cards for up to +90 per day
🔹 Creator bonus: publish content featuring specified tokens or trading cards for up to +300 per task

🎉 Enter the draw for great prizes, including a 10,000 USDT Position Trial Voucher, a Nintendo console, a Gate laptop stand, and more!

Draw now 👉️ https://www.gate.com/activities/pointprize?now_period=25
$BTC $ETH $ZEC$GER40
repost-content-media
BTC-0.67%
ETH-1.26%
ZEC+1.16%
GER40+0.44%
  • 1
#HYPERalliesAgainstTheMarket
Hyperliquid (HYPE) Relative Strength Analysis: Outperforming the Broader Market
Hyperliquid (HYPE) has been displaying clear relative strength against the wider cryptocurrency market. While major assets have faced selling pressure or limited upside in recent sessions, HYPE has held firmer and delivered stronger percentage gains over multiple timeframes. This analysis breaks down the situation step by step, incorporates the latest available prices and percentage moves, outlines key technical levels, RSI readings, market sentiment, potential upside scenarios, and pr
miss_1903
#HYPERalliesAgainstTheMarket
Hyperliquid (HYPE) Relative Strength Analysis: Outperforming the Broader Market

Hyperliquid (HYPE) has been displaying clear relative strength against the wider cryptocurrency market. While major assets have faced selling pressure or limited upside in recent sessions, HYPE has held firmer and delivered stronger percentage gains over multiple timeframes. This analysis breaks down the situation step by step, incorporates the latest available prices and percentage moves, outlines key technical levels, RSI readings, market sentiment, potential upside scenarios, and practical trading considerations. All figures are approximate based on market data as of early November 2026 and are for informational purposes only.

1. HYPE Is Moving Against the Overall Market Trend
In periods when Bitcoin and the broader altcoin complex have shown weakness or consolidation, HYPE has frequently held higher or advanced. Recent data shows HYPE trading near $87.30–$88.00. Over the past 7 days it has posted gains of approximately +15.0% to +15.4%, while Bitcoin has seen weekly moves in the range of roughly –3% to –4% in some comparable windows and Ethereum has posted similar or slightly milder weekly declines. This divergence highlights HYPE’s independent momentum.

Market capitalization for HYPE stands near $20.9–$21.1 billion, placing it around rank #10–#11. 24-hour trading volume has been robust, often exceeding $1.4–$1.9 billion. The token remains roughly 10–11% below its all-time high of approximately $97.96 set on September 23, 2026.

2. Meaning of Relative Strength
When the overall crypto market or major assets decline, a coin that stays stable or rises demonstrates strength. This relative outperformance can attract capital rotation as traders seek assets that are not following the broader weakness. HYPE’s ability to post double-digit weekly gains while Bitcoin and Ethereum faced pressure is a classic example of such strength.

3. Outperformance in Practice
A simple illustration of the pattern:
Bitcoin down roughly 3–4% over a comparable recent weekly window.
Ethereum down roughly 3–4% in similar periods.

HYPE up approximately +15% over 7 days.

In such conditions HYPE is clearly outperforming. On shorter timeframes the 24-hour change for HYPE has recently been modest (around –0.3% to –0.7%), yet the multi-day and weekly picture remains constructive relative to the majors.

4. Concrete Price Comparison Example
Recent snapshot ranges:
Bitcoin trading near the high $77,000s to low $78,000s with weekly pressure.

Ethereum near $2,260–$2,270 with limited weekly upside.

HYPE near $87.50, having climbed from levels around the mid-to-high $70s earlier in the prior week, delivering the noted +15% weekly advance and approaching resistance zones closer to previous highs.

This kind of divergence often draws attention from both short-term traders and longer-term holders looking for relative strength plays.

5. HYPE Rallying Against Market Pressure
The recent weekly advance of roughly +15% while the broader market struggled constitutes a counter-trend rally. Supporting factors include strong platform activity on Hyperliquid’s perpetual exchange, elevated trading volumes, and positive narrative around potential institutional or infrastructure developments. Price action has shown resilience above key short-term moving averages in several analyses.

6. Investor and Trader Attention
Relative strength tends to attract capital. When an asset holds or rises while peers fall, it signals underlying demand. Traders monitor such names for potential continuation or breakout setups. Current market capitalization near $21 billion and solid daily volume provide the liquidity needed for larger participants.

Current Price, Technical Levels, RSI and Sentiment
Current price range: Approximately $87.30–$88.00 (recent readings clustered near $87.50).

Key support levels (approximate):

Immediate support: $86.17–$86.50

Secondary support: $83.95–$85.00

Stronger support zone: $80.50–$81.00

Key resistance levels (approximate):
Near-term resistance: $88.50–$89.50

Intermediate resistance: $94.00–$95.00

Major resistance / prior high zone: $97.00–$98.00

Psychological target: $100
RSI (14-period daily): Readings in the 57–59 range have been reported across multiple sources.

This places RSI in neutral-to-mildly bullish territory—above the midline of 50 but not yet in overbought conditions (typically above 70).

Momentum remains constructive without extreme readings.

Market sentiment: Broader crypto sentiment has been cautious (Fear & Greed Index near the mid-30s, “Fear” zone). Within that environment HYPE’s relative strength stands out. Some analyses note bullish bias on higher timeframes when price holds above key moving averages.

Potential Upside and Forecast Scenarios
Short-term technical targets frequently cited in recent analyses include a move toward the $94–$98 zone if near-term resistance is cleared, with the round $100 level as a psychological objective. Longer-term statistical or model-based projections vary widely; some point to potential ranges extending higher over multi-month horizons under constructive conditions, while others emphasize that crypto remains highly volatile. Any upside remains dependent on continued relative strength, volume confirmation, and broader market stability. Downside risks include a break of the $86 area that could open a path toward the mid-$80s or lower support.

Trading Considerations and Practical Tips
Relative strength focus: HYPE has shown ability to decouple positively.

Traders often watch for continuation of this pattern on higher timeframes.
Level-based approach: A sustained hold above $86.50–$87.00 keeps the near-term structure constructive. A clean break and hold above $89.50 would improve the odds of testing higher resistance. Failure below $86 would shift focus to lower supports.

RSI and momentum: Current neutral-to-positive RSI leaves room for further upside before classic overbought conditions. Divergence between price and RSI should be monitored.

Volume confirmation: Strong volume on up days has accompanied recent strength. Declining volume on rallies would be a caution signal.

Risk management: Crypto assets can move sharply in either direction.

Position sizing, stop levels below key supports, and awareness of overall market conditions remain essential.
Broader context: Relative strength can persist for periods but is not guaranteed. Correlation with Bitcoin can reassert itself during sharp market-wide moves.

Summary
HYPE has demonstrated measurable relative strength, delivering roughly +15% over 7 days while major assets faced pressure. Current price near $87.50 sits approximately 10–11% below the all-time high of $97.96.

RSI in the high 50s supports a neutral-to-constructive momentum picture. Key levels to watch are support near $86–$86.50 and resistance near $89–$95 with the prior high zone and $100 as further objectives. Traders are paying attention to this divergence, but outcomes remain uncertain and highly dependent on volume, broader market direction, and continued demand for the asset.#ShareWeekly
HYPE+0.24%
BTC-0.67%
ETH-1.26%
  • 2
7-Day Referral Rewards: Team Up with Friends and Earn Up to 1,660 USDT per User https://www.gate.com/campaigns/6827?ref=U1YXBFlY&ref_type=132&utm_cmp=AFXoboN2
FenerliBaba
7-Day Referral Rewards: Team Up with Friends and Earn Up to 1,660 USDT per User https://www.gate.com/campaigns/6827?ref=U1YXBFlY&ref_type=132&utm_cmp=AFXoboN2
repost-content-media
  • 2
The US stock market experienced a broad selloff, with the tech-heavy Nasdaq Composite dropping 365.13 points, or 1.37 percent, to close at 26,184.72. The Philadelphia Semiconductor Index also fell, ending a four-session winning streak.
Intel shares were a major drag on the semiconductor sector, plunging after the company issued a weak fourth-quarter guidance. Intel expects revenue between 15 billion and 16 billion dollars, well below analyst estimates of around 17 billion dollars. Adjusted earnings per share are guided to 25 cents, short of the 43-cent consensus, with a gross margin of 38 perc
Sakura_3434
The US stock market experienced a broad selloff, with the tech-heavy Nasdaq Composite dropping 365.13 points, or 1.37 percent, to close at 26,184.72. The Philadelphia Semiconductor Index also fell, ending a four-session winning streak.
Intel shares were a major drag on the semiconductor sector, plunging after the company issued a weak fourth-quarter guidance. Intel expects revenue between 15 billion and 16 billion dollars, well below analyst estimates of around 17 billion dollars. Adjusted earnings per share are guided to 25 cents, short of the 43-cent consensus, with a gross margin of 38 percent. The company also warned that the PC market slowdown could continue into the first half of 2027. This guidance overshadowed a third-quarter beat, where adjusted earnings per share of 52 cents topped estimates.
The weakness in Intel and the broader semiconductor space was compounded by concerns about heavy spending on artificial intelligence. Alphabet shares fell 12.64 percent after its results raised doubts about whether massive AI investments are generating sufficient returns. This sentiment weighed on other chipmakers, with AMD, Micron, and Nvidia all closing lower. More than 2 trillion dollars in market value is set to be wiped from the Nasdaq 100 in October as these AI spending fears deepen.
For you, these moves show how quickly sentiment can shift from growth expectations to concerns about costs and returns. The selloff was not uniform, as defensive sectors like healthcare and consumer staples saw gains.
Markets are watching whether the PC slowdown is temporary and if AI investments begin to show clearer payoffs. If these concerns ease, sentiment may stabilize. If spending continues to rise without matching returns, pressure may persist. I am holding my positions and watching the market. Which signal matters more to you here, the guidance from chipmakers or the broader AI spending trend.
This is not financial advice.
#USStocks #Semiconductors
#IntelBeatsEarningsButStockPlunges
#StrategySTRCNears100ParValue
#USEarningsSeason
$INTC $AMZN $NVDA $MU $SNDK
INTC-10.58%
AMD-17.64%
MU-17.23%
NVDA-9.33%
AMZN-2.11%
  • 1
🏆 WCTC S9 Topic Today | Hold Through the Weekend or Stay Light and Wait for Opportunities?
It’s Friday. How are you preparing your positions for the weekend? Will you continue holding according to plan, or reduce your positions a bit to leave room for new opportunities?👀
💡 Let’s talk about:
• Which asset is worth holding through the weekend, and why?
• If you check the markets less often, how will you manage take-profit and stop-loss orders?
• What would make you adjust your positions or change your plan?
Share your weekend trading plan and reasoning with #WCTCS9 , and feel free to include
GateSquare
🏆 WCTC S9 Topic Today | Hold Through the Weekend or Stay Light and Wait for Opportunities?
It’s Friday. How are you preparing your positions for the weekend? Will you continue holding according to plan, or reduce your positions a bit to leave room for new opportunities?👀

💡 Let’s talk about:
• Which asset is worth holding through the weekend, and why?
• If you check the markets less often, how will you manage take-profit and stop-loss orders?
• What would make you adjust your positions or change your plan?

Share your weekend trading plan and reasoning with #WCTCS9 , and feel free to include your performance card and share what you learned from this week’s trades. 📊
🎁 Each day, 3 outstanding creators are selected to receive a 100 USDT position trial voucher. Valid participation adds up to entries in a weekly bonus prize draw.
👉 Sign Up
https://www.gate.com/campaigns/6559
📝 Share Your Trading Ideas
https://www.gate.com/post
repost-content-media
🎃 Gate Square Halloween countdown: 2️⃣ days! A 25,000 USDT prize pool awaits!
Post to claim red packets, share your creative ideas to win prizes, and earn leaderboard rewards!
🎁 Four perks, nonstop surprises
1️⃣ New users are guaranteed to win with their first post: a position trial voucher worth up to 100 USDT!
2️⃣ Share your real trading story to win a position trial voucher worth up to 500 USDT!
3️⃣ Show off your creative image to win a position trial voucher worth up to 500 USDT!
4️⃣ Earn points by posting and interacting for a chance to win a position trial voucher worth up to 80 USDT!
GateSquare
🎃 Gate Square Halloween countdown: 2️⃣ days! A 25,000 USDT prize pool awaits!
Post to claim red packets, share your creative ideas to win prizes, and earn leaderboard rewards!

🎁 Four perks, nonstop surprises
1️⃣ New users are guaranteed to win with their first post: a position trial voucher worth up to 100 USDT!
2️⃣ Share your real trading story to win a position trial voucher worth up to 500 USDT!
3️⃣ Show off your creative image to win a position trial voucher worth up to 500 USDT!
4️⃣ Earn points by posting and interacting for a chance to win a position trial voucher worth up to 80 USDT!

📌 How to participate
1️⃣ Visit the event page and sign up 👉 https://www.gate.com/campaigns/6741
2️⃣ Include #GateSquareHalloween and post original trading content

Join the Halloween celebration and make every share a chance to win a surprise!
👉 https://www.gate.com/post
#GateSquareHalloween
repost-content-media
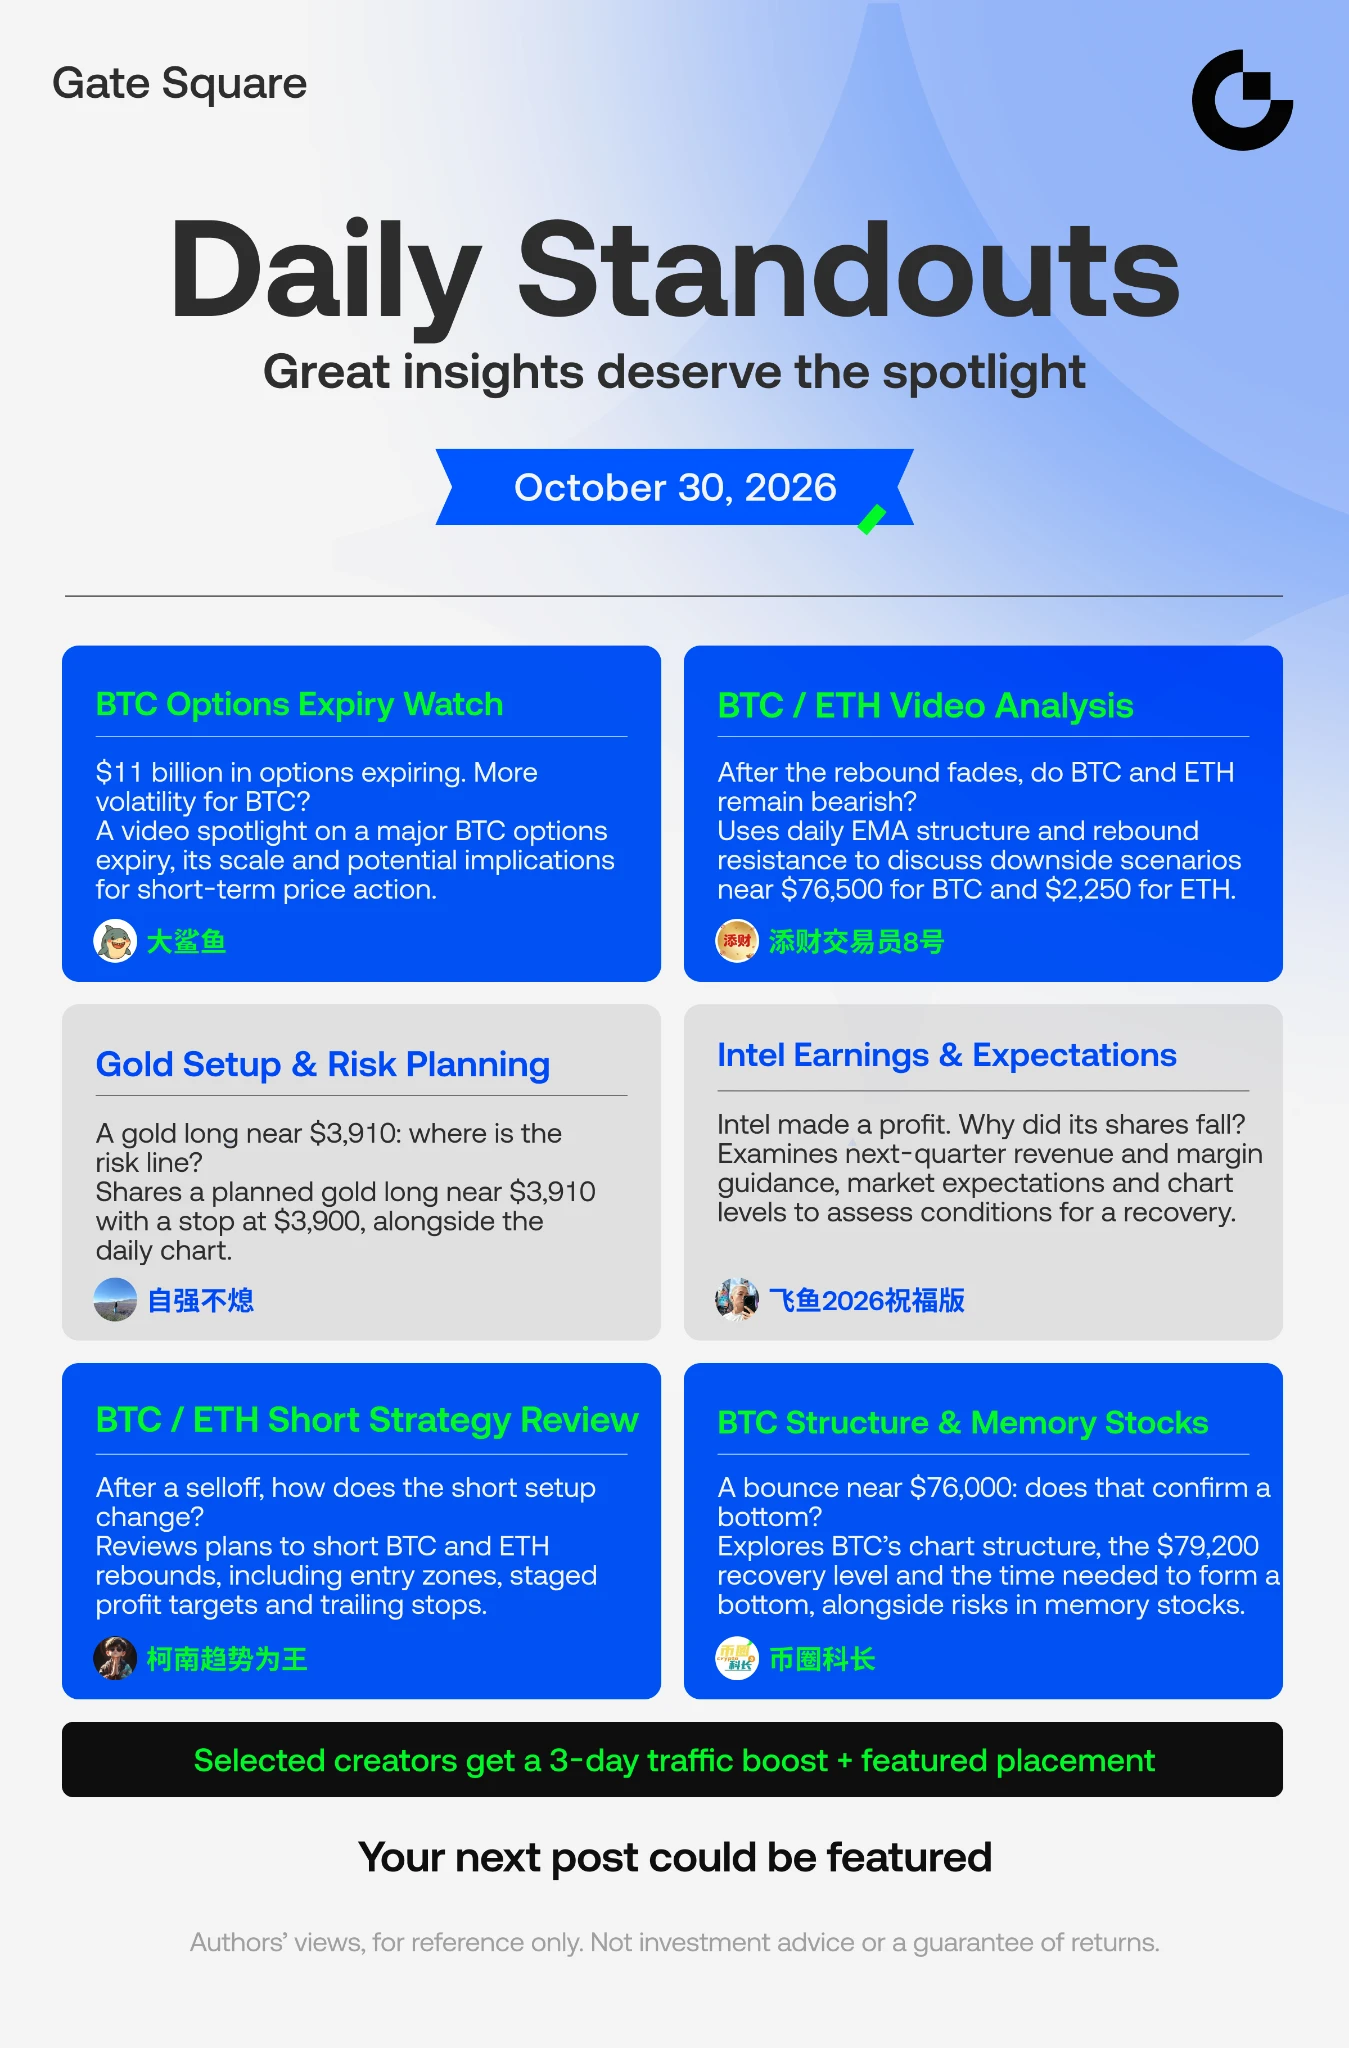
🔥 Gate Square Daily Standouts | Oct 30
Does reaching a downside target mean the bottom is in? 💡
BTC options expiry, crypto rebound signals, gold setups and Intel’s earnings reaction. Explore today’s 6 picks and share your take 👇
🎬 @JS大鲨鱼 | $11 billion in BTC options expiring: more volatility ahead?
"https://www.gate.com/zh/post/status/25288392" (https://www.gate.com/zh/post/status/25288392)
📉 @添财交易员8号 | After the rebound fades, do BTC and ETH remain bearish?
"https://www.gate.com/zh/post/status/curated/25291030" (http
Gate_Square
🔥 Gate Square Daily Standouts | Oct 30

Does reaching a downside target mean the bottom is in? 💡
BTC options expiry, crypto rebound signals, gold setups and Intel’s earnings reaction. Explore today’s 6 picks and share your take 👇

🎬 @JS大鲨鱼 | $11 billion in BTC options expiring: more volatility ahead?
"https://www.gate.com/zh/post/status/25288392" (https://www.gate.com/zh/post/status/25288392)

📉 @添财交易员8号 | After the rebound fades, do BTC and ETH remain bearish?
"https://www.gate.com/zh/post/status/curated/25291030" (https://www.gate.com/zh/post/status/curated/25291030)

🥇 @自强不熄 | A gold long planned near $3,910: where does the stop go?
"https://www.gate.com/zh/post/status/25284422" (https://www.gate.com/zh/post/status/25284422)

🔍 @飞鱼2026祝福版 | Intel made a profit. Why did its shares fall?
"https://www.gate.com/zh/post/status/curated/25293634" (https://www.gate.com/zh/post/status/curated/25293634)

🎯 @柯南趋势为王 | Shorting BTC / ETH rebounds: profit targets and trailing stops
"https://www.gate.com/zh/post/status/curated/25292839" (https://www.gate.com/zh/post/status/curated/25292839)

📊 @币圈科长 | A BTC bounce near $76,000: does that confirm a bottom?
"https://www.gate.com/zh/post/status/25294824" (https://www.gate.com/zh/post/status/25294824)

🎁 Selected creators receive a 3-day traffic boost + featured placement
Read the posts, compare the reasoning and join the conversation.
Your next post could be featured.

#DailyStandouts #GateSquare
repost-content-media
BTC-0.67%
ETH-1.26%
XAU+0.38%
INTC-10.58%
📈 XRP Price Prediction: Can $1.33 Support Open the Door to $5?
$XRP has recovered to around $1.33 after a sharp correction from $3.50 toward $1.00, putting its long-term bullish structure back in focus.
The token has traded within a broad ascending channel since 2020, when XRP was near $0.15. While $BTC continues to shape broader crypto sentiment, XRP's next move depends on whether buyers can defend support and reclaim key resistance levels.
##ShareWeekly
$XRP ‌
TheBuzzingBee
📈 XRP Price Prediction: Can $1.33 Support Open the Door to $5?

$XRP has recovered to around $1.33 after a sharp correction from $3.50 toward $1.00, putting its long-term bullish structure back in focus.

The token has traded within a broad ascending channel since 2020, when XRP was near $0.15. While $BTC continues to shape broader crypto sentiment, XRP's next move depends on whether buyers can defend support and reclaim key resistance levels.

##ShareWeekly

$XRP ‌
repost-content-media
XRP-1.15%
BTC-0.67%
  • 1
A Full Review of the BNB Theft: Was It Staged or Was It Really Stolen? “$5.6 billion, 37 minutes, one hot wallet drained. Every step left footprints on-chain, and we followed them all the way.”
JsBigShark
A Full Review of the BNB Theft: Was It Staged or Was It Really Stolen? “$5.6 billion, 37 minutes, one hot wallet drained. Every step left footprints on-chain, and we followed them all the way.”
BNB-0.76%
  • 1
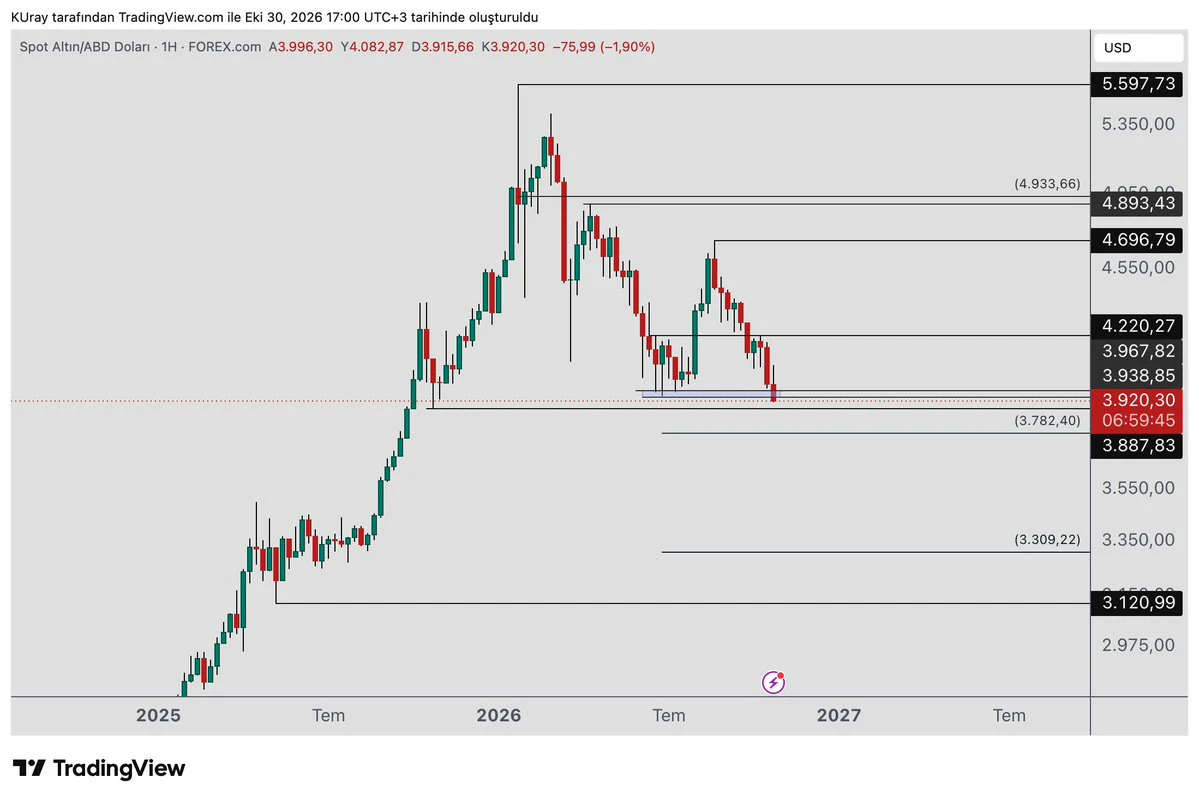
#xau #altın We are approaching a critical level. Buyers are still not strong.
If there is a daily close below 3887, followed by a weekly close, the decline will deepen further.
If it stays below 3887, the first support is at 3782.
If 3887 holds, it means the uptrend formed on the weekly chart remains intact.
KamileUray
#xau #altın We are approaching a critical level. Buyers are still not strong.
If there is a daily close below 3887, followed by a weekly close, the decline will deepen further.
If it stays below 3887, the first support is at 3782.
If 3887 holds, it means the uptrend formed on the weekly chart remains intact.
repost-content-media
XAU+0.38%
  • 1
Deep Technical Analysis: BTC/USDT Multi-Timeframe Breakdown
The breakdown of the $80,000 baseline has fundamentally shifted the short-term market structure to bearish, driving the asset into a high-volatility liquidity hunt within the $76,000–$77,000 demand block. Below is a rigorous technical analysis across key timeframes based on the provided chart indicators.
1. Macro Trend: 1-Week Chart (1W)
• Bollinger Bands Structural Analysis:
• Upper Band (UB): $90,766.2 acting as the primary macro overhead resistance target for Q4.
• Middle Band (MB / 20 SMA): $72,946.0 representing the critical bu
KatyPaty
Deep Technical Analysis: BTC/USDT Multi-Timeframe Breakdown

The breakdown of the $80,000 baseline has fundamentally shifted the short-term market structure to bearish, driving the asset into a high-volatility liquidity hunt within the $76,000–$77,000 demand block. Below is a rigorous technical analysis across key timeframes based on the provided chart indicators.

1. Macro Trend: 1-Week Chart (1W)

• Bollinger Bands Structural Analysis:
• Upper Band (UB): $90,766.2 acting as the primary macro overhead resistance target for Q4.
• Middle Band (MB / 20 SMA): $72,946.0 representing the critical bull/bear boundary for the overall cycle. A correction down to this level remains structurally healthy.
• Lower Band (LB): $55,125.8.
• Volume Profile & Price Action: The long upper wick near the $85,000–$87,300 supply zone confirms strong institutional distribution. Price is dropping toward the middle band, signaling a macro mean-reversion phase.

2. Intermediate Momentum: Daily Chart (1D)

• Volatility Squeeze and Expansion:
• The daily Bollinger Bands had tightened heavily between $78,055.9 (LB) and $84,674.6 (UB).
• The current price action shows a definitive downward expansion, breaking below the Middle Band ($81,365.3).
• Key Indicators:
• RSI: Has pulled back sharply into the 41–45 zone, confirming that short-term bullish momentum is fully lost, giving sellers full control without the asset being oversold yet.
• MACD: The histogram shows expanding bearish momentum below the zero line, with a widening negative spread between the MACD and Signal lines, warning against catching a falling knife prematurely.

3. Execution & Micro-Structure: 4-Hour Chart (4H)

• Immediate Support Test: The 4-hour chart captures the velocity of the liquidation event. BTC breached the lower band at $76,398.4, bottoming temporarily at $76,260.8.
• Order Book & Moving Averages:
• Immediate Resistance: The 4H Middle Band at $79,693.4 (coinciding with the psychological $80k level) has flipped into an aggressive overhead supply zone.
• Volume: The massive spike on the breakout candle confirms stop-loss cascades (long liquidations).

📉 Key Levels & Trading Action

Key Resistance Zones:
• Major Resistance ($82,988.4): Daily Bollinger Band breakdown point and structural volume node. Look for failure and rejection on any relief rallies to trigger short positions.
• Immediate Resistance ($79,693.4): 4H Middle Band and psychological $80K pivot. This is the reclaim target; bulls must close a 4H candle above this to stall the drop.
Current Pivot & Immediate Support:
• Current Pivot ($76,983.9): Current spot cluster and local consolidation zone. This area is "No-Man's Land" with high risk for high-leverage market entries.
• Immediate Support ($76,260.8): Recent 24H swing low and Daily Lower Band boundary. This is a potential scalp long area; watch for lower-timeframe double bottoms or absorption.
Macro Support Floor:
• Macro Support ($72,946.0): 1W Middle Band (20 SMA). This represents the deep accumulation zone and primary area for long-term spot buyers and swing longs.

🧠 Strategic Execution Outlook

• The Bearish Continuation Scenario: If the current daily candle closes decisively below $77,000, the daily Bollinger Bands will swing open downwards. This invalidates the local bull flag structure and opens the path for a direct test of the weekly support engine at $72,946.
• The Bullish Reclaim Scenario: For an immediate trend reversal, bulls need to engineer an aggressive V-shape recovery, closing back above $80,000 within 24–48 hours. Failure to do so will flip the $79.6k–$80.5k area into a permanent distribution block, dragging the market lower.
#ShareWeekly #BTCDropsToward77000
repost-content-media
BTC-0.67%
  • 1
Load More