Share your thoughts
placeholder
Article
My colleagues at the company got me to use this software when I feel like placing a trade
I have to say, it seems pretty useful for beginners to learn and review their trades
I had him add it to the webpage
Those interested can test it out 😂—it’s on the webpage in my profile
post-image
$UNI /USDT is about to explode but nobody is watching yet

$UNI /USDT - LONG

Trade Plan:
Entry: 6.218 – 6.264
SL: 6.018
TP1: 6.408
TP2: 6.519
TP3: 6.686

Why this setup?
Why now? The daily trend is firmly bullish while the 1h price sits at 6.241, perfectly aligned with the entry reference. The 15m RSI at 28.71 signals oversold exhaustion, and the 1h ATR of 0.092742 shows volatility is compressing before a breakout. The entry zone between 6.218 and 6.264 offers a tight risk reward, with TP1 at 6.408 and TP2 at 6.519 as the first two targets. The line in the sand is the invalidation level at
UNI-1.59%
  • 1
Everyone watching SYMBOL long just got handed a free invalidation level.

$BTC /USDT - LONG

Trade Plan:
Entry: 76736.3 – 76826.7
SL: 76347.5
TP1: 77107.0
TP2: 77324.1
TP3: 77649.6

Why this setup?
Why now? The daily trend is bullish, but the 15m RSI at 20.14 screams oversold, hinting at a squeeze. The 1h ATR of 180.85 shows the recent volatility is tight enough to stack entries inside the 76736.3 to 76826.7 zone. A fill at 76781.5 targets the first TP of 77107.0, with a second objective at 77324.1 before the line in the sand at 77673.3 gets ripped. This setup only works if price respects t
BTC-0.73%
This is my wealthiest moment
98% of the quota + three reset coupons
I can have a good chat with God.
post-image
Why is everyone suddenly watching $SKHYNIX /USDT like a hawk?

$SKHYNIX /USDT - LONG

Trade Plan:
Entry: 1325.63 – 1328.95
SL: 1306.60
TP1: 1342.81
TP2: 1353.16
TP3: 1368.67

Why this setup?
Why now? The 4h trend is range-bound, but the 15m RSI at 34.63 shows oversold momentum that could flip bullish. The 1h ATR of 6.63 points to a sharp move once volatility expands, making the entry zone around 1327.29 a high-probability trigger. TP1 at 1342.81 offers the first realistic target, while TP2 at 1353.16 extends the upside if momentum holds. The daily range structure keeps the trade contained,
SKHYNIX-3.95%
$LSK futures trading volume reached approximately $3.082 billion, while open interest rose to approximately $185 million, of which shorts accounted for approximately $31.22 million, or about 88%.
0.1u → 2u → cut in half—all in one day……
Thrilling? Exciting? Tempting? Who exactly is making money?
I don’t dare play. Teach me—are there any patterns that can be applied?
post-image
LSK+310.09%
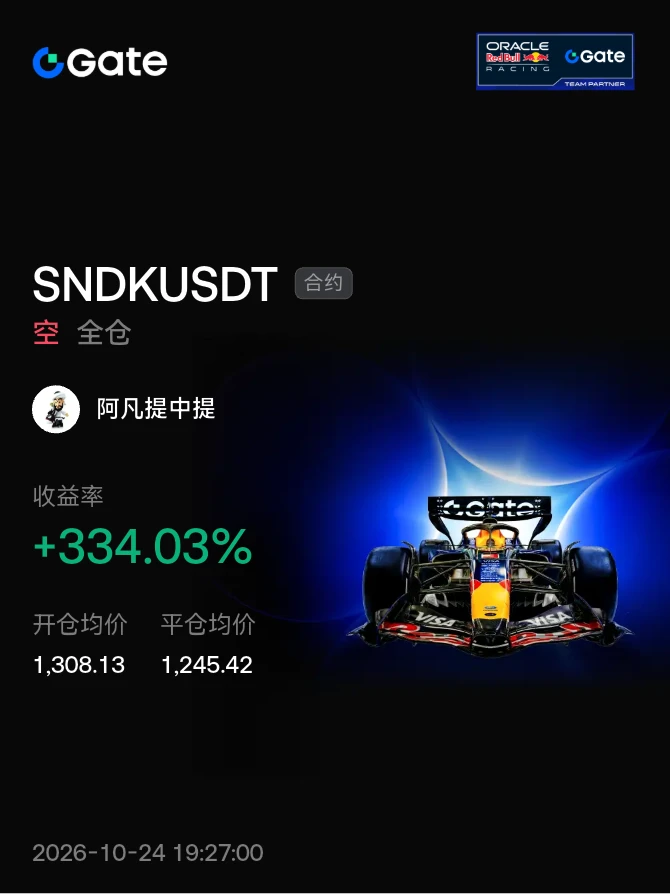
The stop-loss I nervously removed a few days ago—looking at it today, it feels like it saved my life. A few days ago in the afternoon, $HOME ’s rebound lacked strength; every upward push fell just short, with clear resistance above. Shorts could be held.

HOME slid from 0.00899 to 0.00543, securing +2809.8%; the short position paid off, and this was a satisfying bite of profit.

Close 80% first, and protect the remaining 20% at the entry price. Let profits run if the sell-off continues; if it rebounds, don’t give the profits back—lock them in when the time comes.

I’d rather miss a limit-up
post-image
HOME-1.09%
ZEC-3.73%
ETH-1.67%
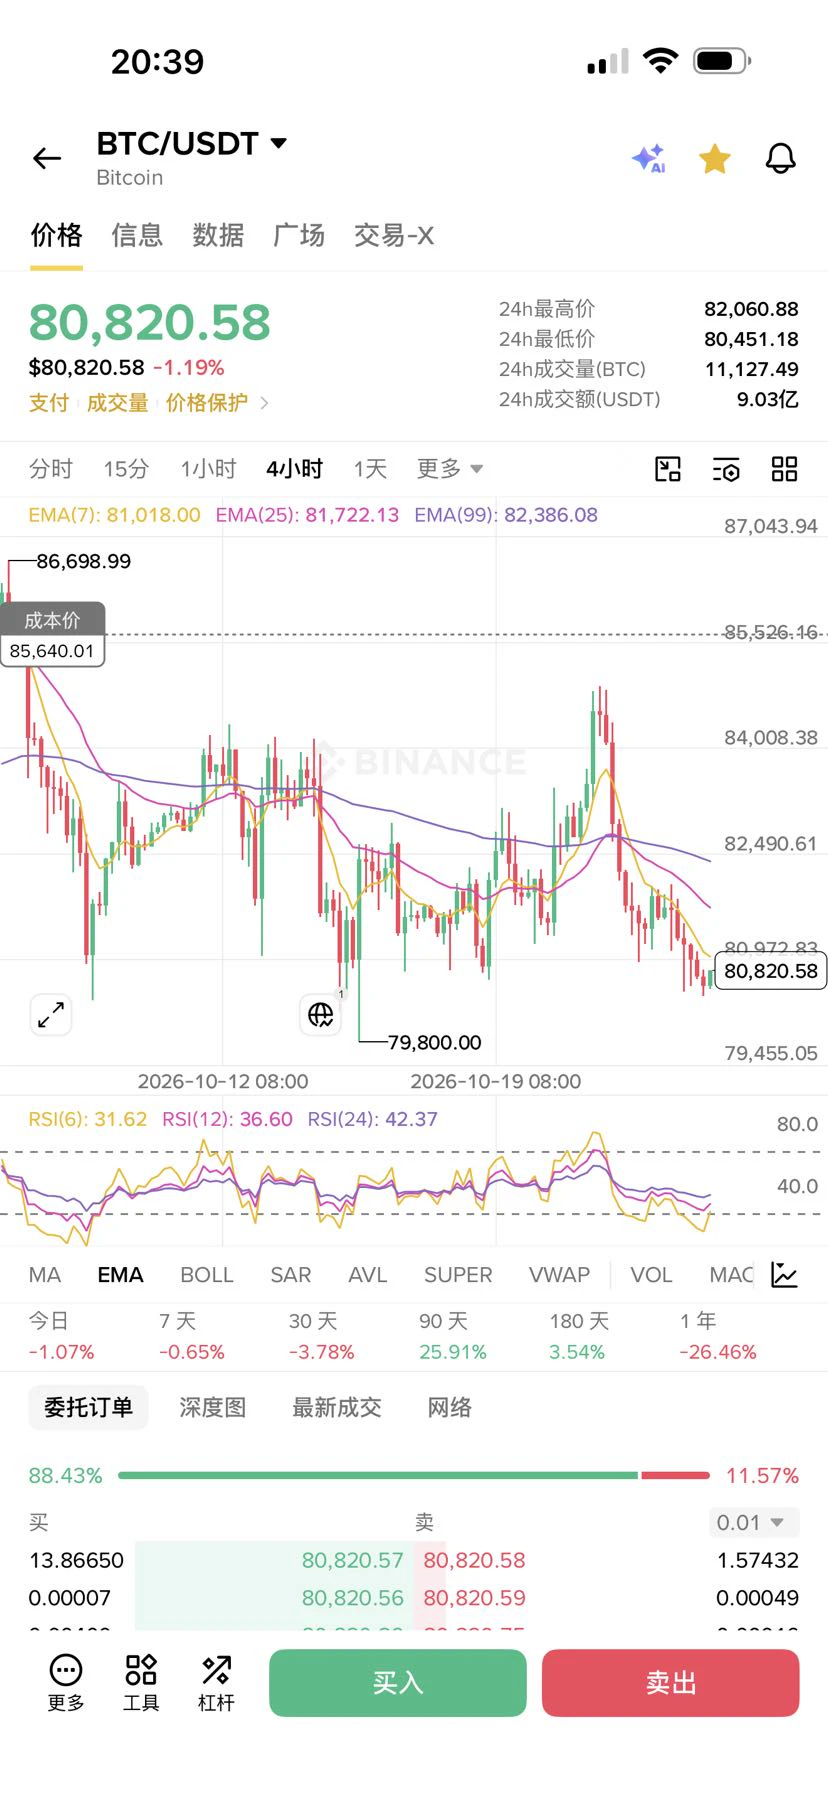
$BTC BOTTOM IS IN
$BTC
post-image
BTC-0.72%
  • 2
  • 1
Release tomorrow! Pre save now:
post-image
This trend doesn’t even require me to think—the account is partying on its own. While the market was bottoming out intraday, $BTW repeatedly held above 0.377246. I watched it for a few minutes: the key level held, buying pressure was still strengthening, and it was obvious someone was using the volatility to accumulate. My only judgment at the time was: a pullback is an entry opportunity, not a signal to run.

The market is waited out, and profits are held onto.

Later, the candlesticks slowly started climbing, and just now they touched 0.564054 directly, bringing the position return to +49
post-image
BTW+1.53%
SNDK-3.02%
BNB-2.46%
ETH has finished adjusting; consider going long. Currently live.
post-image
ETH-1.67%
Something doesn’t seem right—how could there be free haircuts in this world?
post-image
solana:3nqHijNUExsnjNBb15WJsJ2xisyMVGN6FK4aUgZk1Rwj is already in the top 10 by MC on @LaunchOnSF
It was top 6 at ATH just a few hours ago
This thing launched, graduated, and flipped 1m$ in just a couple of hours!
Things are about to go ballistic in the next few hours and days
Solana loves volume
Jupiter loves volume
Raydium loves volume
ZEC loves the meme linked to it
And most importantly, STONK loves the volume
This flywheel is too good to be faded and I see some serious money, like huge SIZE money, is about to flow into these two memes
The solana:HcRLc9VDgjLeK154xDawfb1dmVJ98DoSqcwTHGqiDe
post-image
SOL-1.96%
JUP-4.82%
RAY-6.77%
ZEC-3.73%
TAO is range-bound, but this 15m RSI whispers a different story.

$TAO /USDT - SHORT

Trade Plan:
Entry: 232.2 – 233.4
SL: 238.2
TP1: 228.7
TP2: 226.0
TP3: 222.0

Why this setup?
Why now? The daily trend is range, but the 1h price is sitting at 232.8 with a 15m RSI of 30.79, signaling a sudden exhaustion in buying pressure. The 1h ATR of 2.253326 shows the volatility is compressed just before a potential explosive move. We are targeting a short entry at the 232.8 reference, with the first target at 228.7 and a deeper objective at 226.0. The line in the sand is the invalidation level at 244.
TAO-1.15%
🔹 Tom Lee: Bullish on crypto over the next 12 months
live-cover
LIVE1,074
🐟 Next week may be the week I’m least interested in making impulsive trades lately.
It’s not that there’s no action. It’s just that there are three cards on the table right now, and none of them is suitable for me to go all-in on a direction ahead of time.
First, BTC is still stuck between 76K and 79K.
There’s resistance above and support below. Around 77K, going long feels too high, while shorting feels too low. The most frustrating thing is being in a range like this. It looks like it’s moving every day, but in reality, whoever chases gets hurt.
Second, the September 16 FOMC meeting.
The ma
post-image
BTC-0.72%
  • 3
Insiders are watching SYMBOL like a hawk and the setup is far from random

$XAG /USDT - LONG

Trade Plan:
Entry: 64.39 – 64.43
SL: 64.17
TP1: 64.59
TP2: 64.71
TP3: 64.90

Why this setup?
Why now? The 1h price is holding at 64.42 while the 15m RSI sits at 29.66, signaling oversold exhaustion that often precedes a reversal within a range-bound daily trend. The 1h ATR of 0.078181 shows just enough volatility to push the price from the entry zone of 64.41 toward the first target at 64.59 without blowing the account. If momentum continues, the second target at 64.71 becomes the real reward zone,
XAG-0.09%
Gold Holds Firm Despite Higher Yields, Could Precious Metals Remain Defensive?
live-cover
LIVE385
A colleague of mine hand-built a trading exam app
I use it when I get the itch to place a trade
I have to say, it seems pretty useful for beginners to learn and review their trades
I had him add it to the website. If you're interested, you can take the exam😂
It's on the webpage in my profile
Just for free entertainment
post-image
OpenAI is entering Wall Street territory with a new dedicated AI service for the financial sector.
Powered by their GPT-6 Astra model, the platform is built to streamline market research, analyze complex datasets, and build financial models in real time. It looks like traditional research workflows are about to get a massive upgrade.
$BTC traders, drop your thoughts below
post-image
BTC-0.72%
Load More

Join 40 M users in our growing community

⚡️ Join 40 M users in the crypto craze discussion

💬 Engage with your favorite top creators

👍 See what interests you