Square
Following
Hot
News
Notifications
Profile
Share your thoughts
placeholder
Article
$NEAR

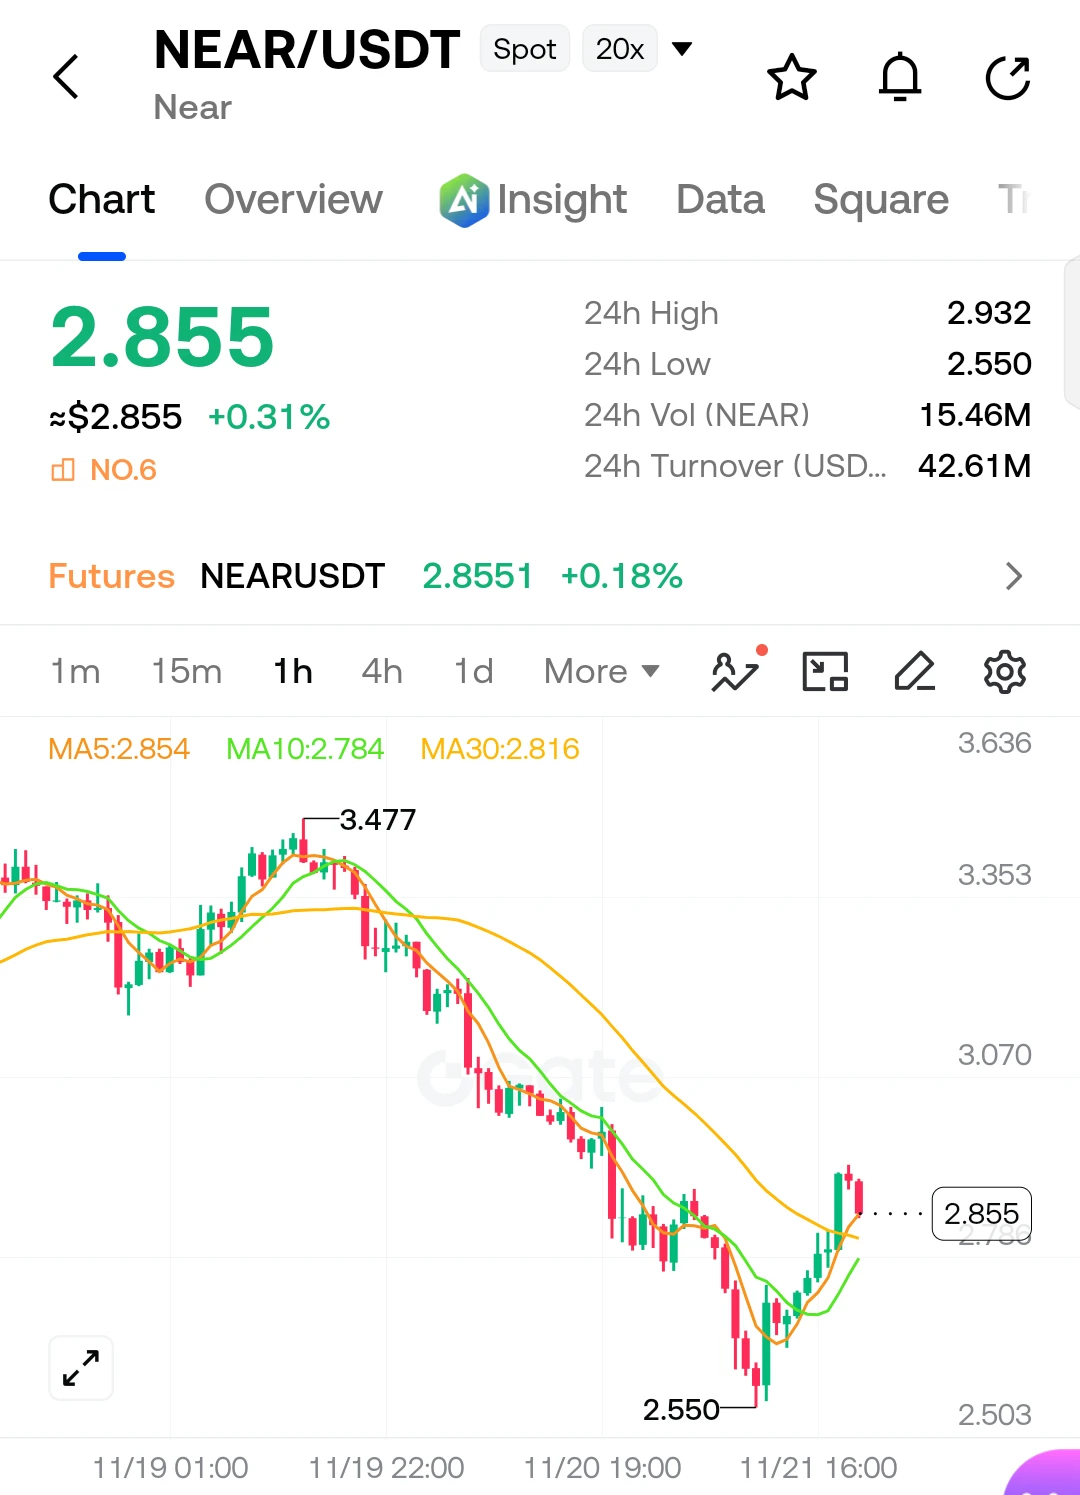
Sliced hard from 3.47 down to the 2.55 floor, now catching a relief bid. Price is reclaiming the fast MAs but facing heavy resistance at the MA30. This is a bounce, not a confirmed reversal yet. Break above 2.93 triggers the next leg up; rejection means another test of the lows. Momentum is shifting, but needs confirmation.

Entry Zone: 2.80 – 2.85

TP1: 2.93
TP2: 3.07
TP3: 3.35

Stop-Loss: 2.68

#NEAR #ShareWeekly #BTCBreaksBelow60K #GateDirectIPOPhase3ANTAllocates92100Shares #NvidiaDropsNearly14Percent
post-image
NEAR+1.17%
  • 2
  • 1
【November 21 Evening | BTC / ETH / Gold Weekend Watch】

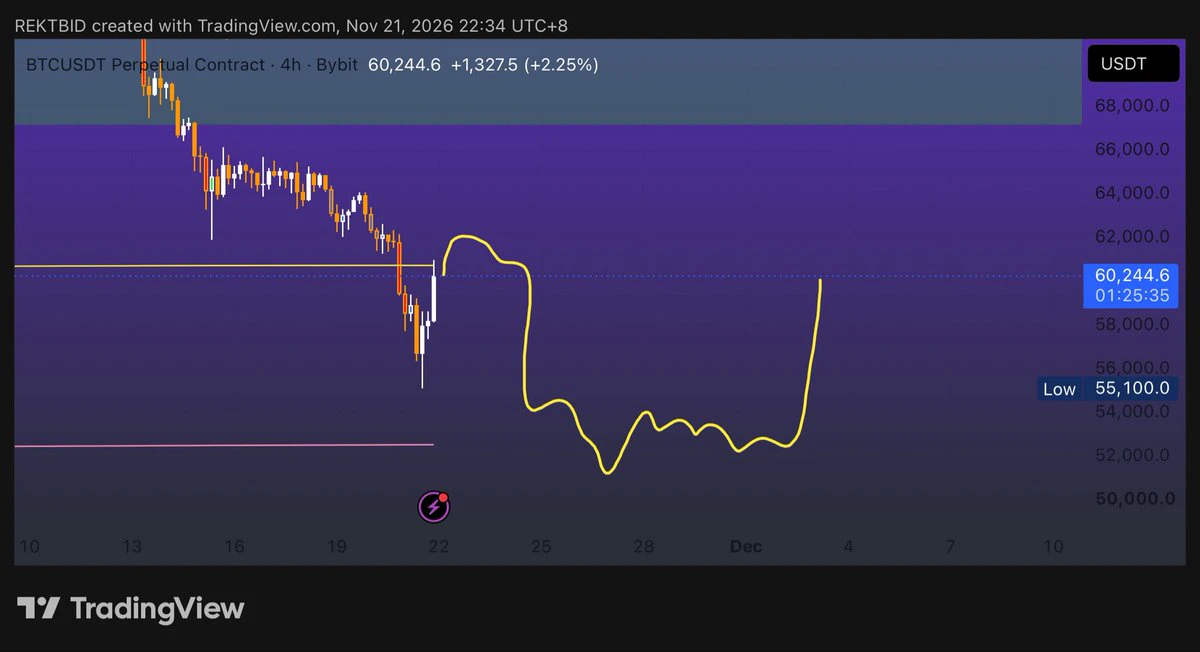
BTC is around $59,900. The weekly and daily charts remain clearly weak; the 4-hour chart has rebounded from a low of $55,127 but has yet to reclaim moving-average resistance. Support is at $58,000–$55,100; a break below these levels could bring a deeper pullback. Resistance is at $61,000–$62,500; further recovery would require holding above this range.

ETH is around $1,684. The weekly and daily charts are weak, while the 4-hour chart has rebounded from a low of $1,538. Support is at $1,620–$1,538, with resistance at $1,750–$1,800; the st
post-image
BTC-0.65%
Trenches
FIONA
F
bade
b
FIONA
B34n...pump
Market Cap
$.
Change
.
24h Vol
$.
Holders
.
IDOL
I
bade
b
IDOL
0x3b...ab07
Market Cap
$.
Change
.
24h Vol
$.
Holders
.
PIEVERSE
P
bade
b
PIEVERSE
0x0e...25a9
Market Cap
$.
Change
.
24h Vol
$.
Holders
.
CLAUDIA
C
bade
b
CLAUDIA
2j5S...W2ZM
Market Cap
$.
Change
.
24h Vol
$.
Holders
.
mihao
m
bade
b
mihao
4Cxj...pump
Market Cap
$.
Change
.
24h Vol
$.
Holders
.
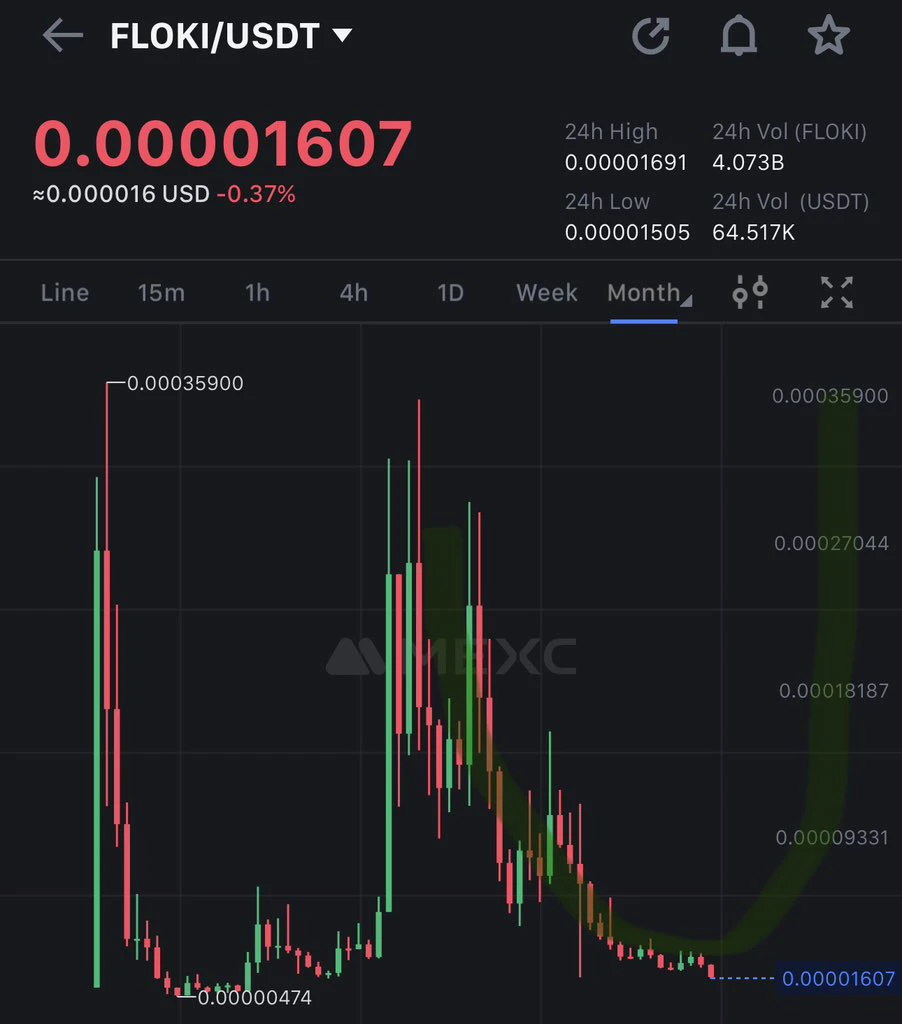
$H Has it bottomed? It won't drop any further, right? I got in at 0.036 and averaged down to 0.016
post-image
H-2.00%
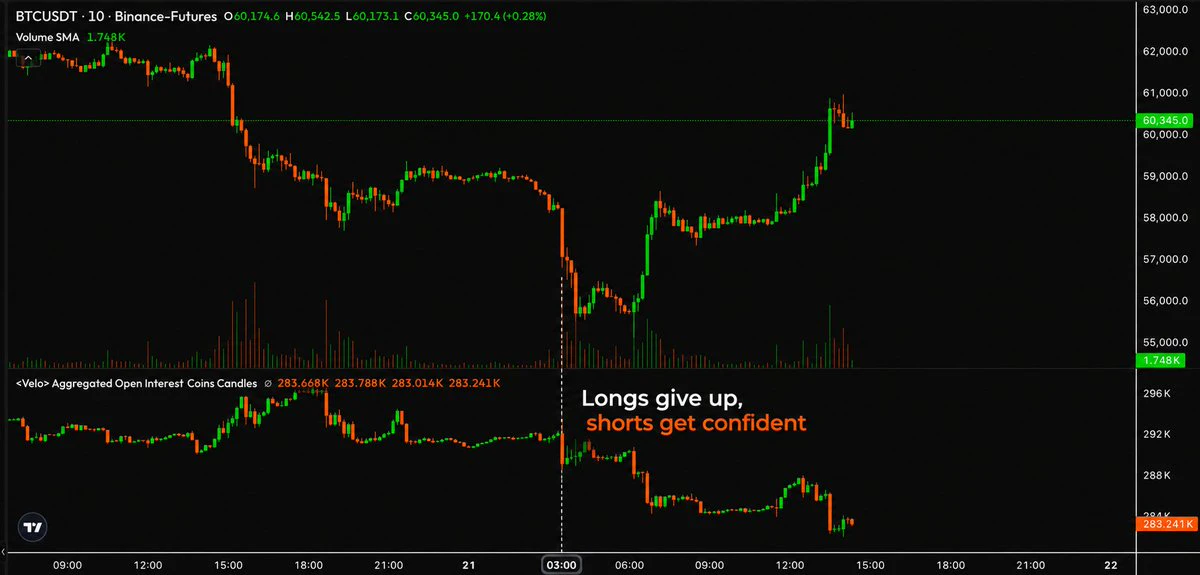
Something changed last night
Longs were leveraging every mini dip with tight stops, adding more fuel to the fire
At $55K, Bitcoin finally found dip buyers
From there on out, Shorts started leveraging every dip
Essentially, longs gave up and have been rage shorting the bounce
post-image
BTC-0.65%
Time to make less painful charts in life
#bitcoin
BTC-0.67%
$BULLA is up 16.78%, moving 22 points from low to high. These are the days when it’s easiest to misread the structure.
My own pattern checklist has four items. Just follow it.
First, check whether it’s holding above the previous stretch’s high-volume trading zone. The standard is that a retest must hold above that platform line. If it breaks, it’s a false move—no need to guess.
Second, check whether the highs and lows are rising. For $BULLA, first confirm that the sequence from 0.0127 to 0.0155 today is still intact. If it breaks, set it aside for now.
Third, check whether volume is keeping up
  • 1
  • 1
🔹 NVIDIA Interim CEO Colette Kress Faces a “Glass Cliff” as She Must Deal With Jensen Huang’s Legac
live-cover
LIVE1,939
BTC-0.67%
XAUUSD-2.40%
XAU+0.38%
ETH-1.23%
NVDA-0.35%
#晒出我的持仓收益
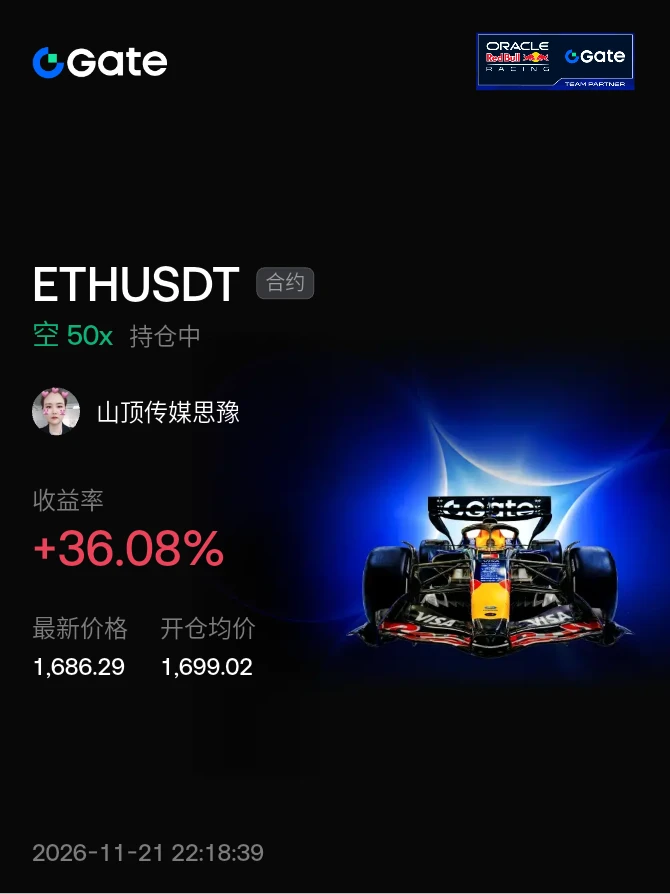
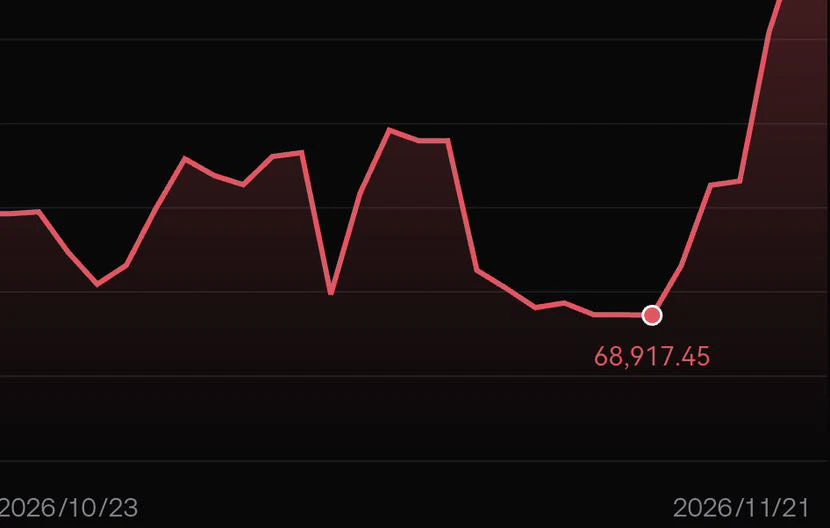
Hehe 🤤🤤🤤 keep it going, keep it going~ Let's get into futures~ Keep it up, keep it up
post-image
ETH-1.23%
  • 3
USD1 market predictions
live-cover
LIVE2,861
USD1+0.00%
Too early to tell, prolly betta wait for a much convincing low to form..imo V reversal chances are very very slim
post-image
$NVDA CFD copy trading is open. If you're not afraid of getting liquidated, follow along
post-image
NVDA-13.84%
  • 1
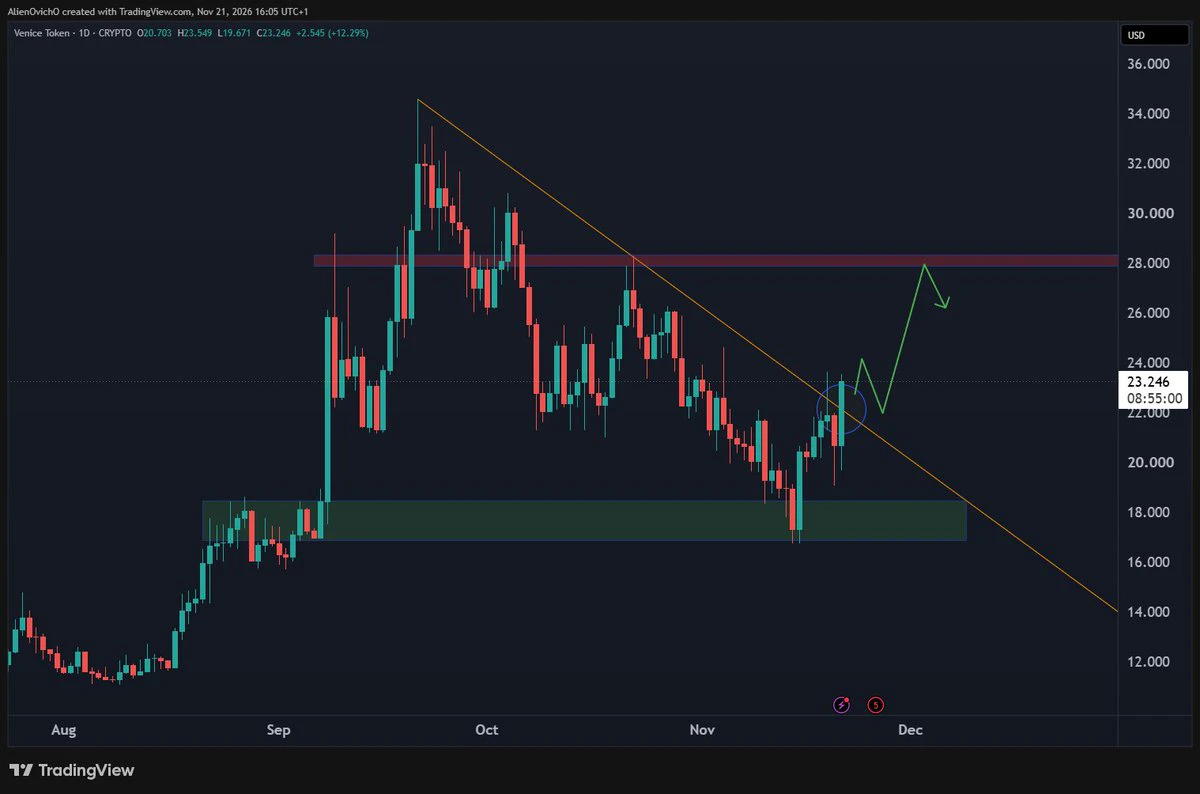
base:0xacfe6019ed1a7dc6f7b508c02d1b04ec88cc21bf is pushing against the descending trendline 📈
A daily close above 22$ confirms the daily reversal in progress and could take price back toward the 28 area.
post-image
TAKE-0.39%
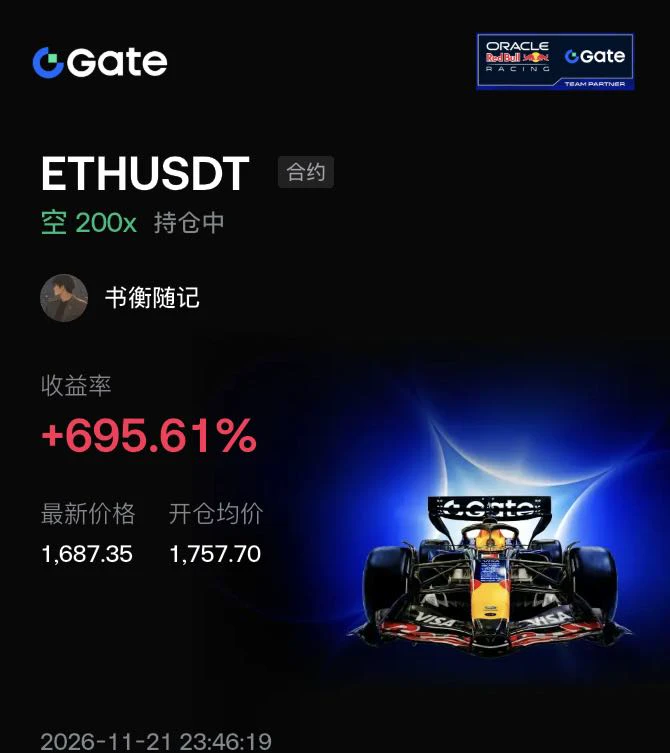
$ETH The current 4-hour trend has shifted from a continuous decline into a rebound and recovery phase, but overhead resistance remains significant.

After the price broke below 1750, several large bearish candles followed, with a low of 1534.94, indicating that the previous support had been decisively breached. I opened a short position around 1757, mainly based on the 4-hour structure of progressively lower rebound highs and continuously declining moving averages. The position is currently showing unrealized profits of nearly 7x.

Looking at the current chart, the price has rebounded to aroun
post-image
ETH-1.23%
BTC-0.65%
SOL-0.74%
  • 1
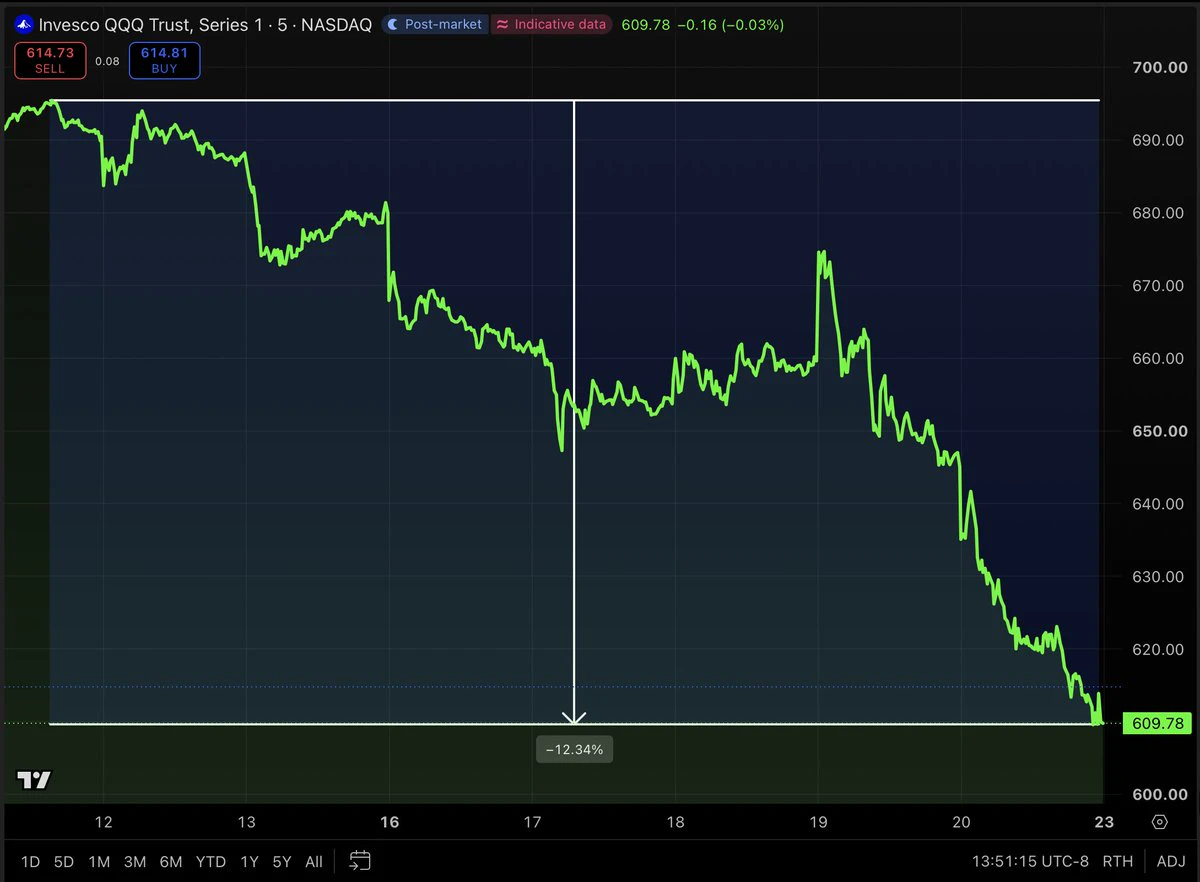
On November 11th $Q closed at $695 ish
Yesterday it closed at $609
That’s down 12% in a week ish
So if you bought a Q call last week that expires today, you didn’t just lose. It’s probably going to zero
& a lot of people did. The market had just bounced. It felt safe again
That’s the trap with short duration options. It gets you when you finally feel comfortable again.
My options don’t expire today. They expire in 2028 & 2029. A bad 6 days doesn’t decide anything for me.
In a world where everyone wants instant gratification and "overnight riches" long duration options win again.
Few get this..
post-image
$PARTI is showing strong bullish momentum—buyers are gearing up for another move higher! Trading plan: Long entry zone: 0.0375 – 0.0381 TP1: 0.0393 TP2: 0.0400 TP3: 0.0420 Stop-loss: 0.0368 PARTI has surged significantly and is currently consolidating near 0.0381. The bulls are holding their ground, and a breakout above 0.0393 could trigger a fresh rally.
post-image
PARTI-1.06%
2026.11.22
Daily chart entry point: 1683
Resistance levels: 1701-1710-1716-1726-1736
Support levels: 1680-1671-1656-1647-1636
1626-1616-1600-1580-1550-1543-1536
At the first break of any support or resistance level, stop out; if it holds, look for a rebound. Once price stabilizes, follow the trend. This is personal advice for reference only. Pay attention to 1716-1626-1543-1536.#BTC跌破6万美元关口 $ETH
post-image
ETH-1.23%
$floki should go up from here.
Will pump hard. Expecting a new ATH.
post-image
FLOKI-0.82%
My friend catches the most every time.
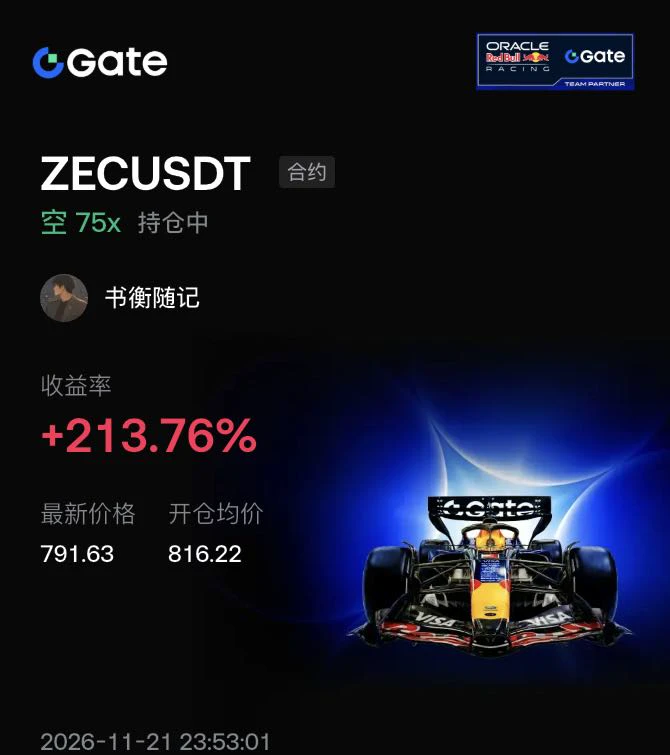
$ZEC The main thing to watch now is the conflict between the short-term rebound and the 4-hour downtrend.

The rebound from around 679 to above 790 has pushed the 1-hour price above the 5-, 10-, and 30-period moving averages, showing a clear short-term recovery.

The 15-minute moving averages are also starting to turn upward, but after rising to around 807, the price has temporarily entered a sideways consolidation, indicating some selling pressure overhead.

On the 4-hour chart, although the price has moved back above the short-term moving averages, the 30-period moving average is still aroun
post-image
ZEC+1.29%
BTC-0.65%
ETH-1.23%
  • 1
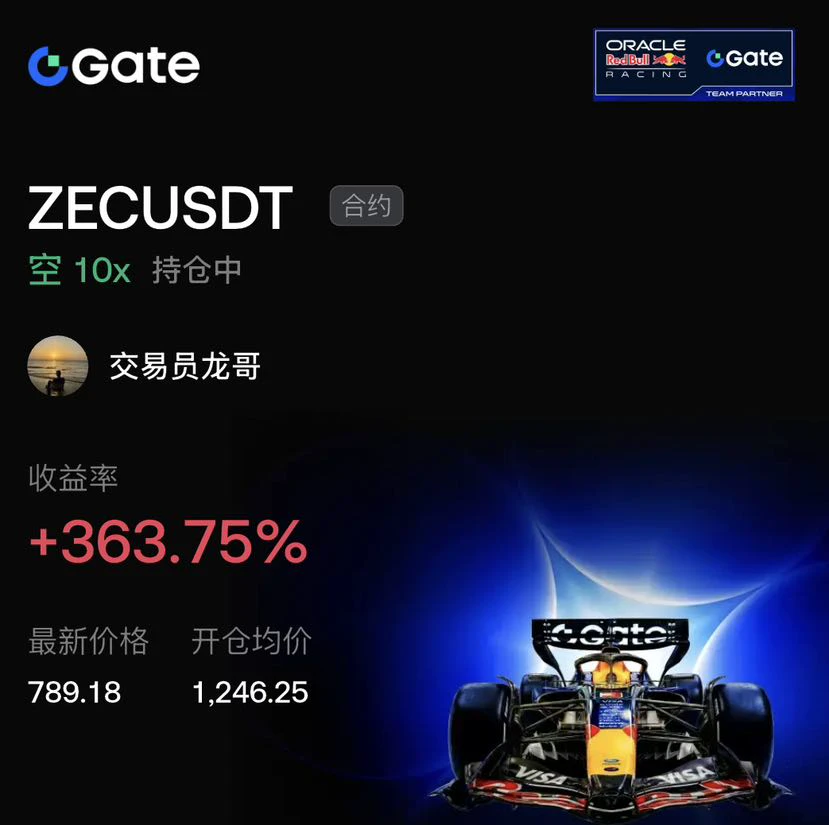
+363.75% in floating profit, thanks to precisely timing the resistance at the top.

Reviewing the trade: $ZEC After the price was rejected at 1246.25, it turned sharply lower. The 1-hour moving averages formed a death cross, and volume increased. I decisively entered a 10x short position. Bearish funds then aggressively sold off, driving the price through multiple levels to a low of 789.18, with the position's return approaching 3.6x. The entire decline came with rising volume, and the main downtrend unfolded in one smooth move. There was no meaningful rebound; bears had complete control.

The
post-image
ZEC+1.29%
BTC-0.65%
SOL-0.74%
Load More

Join 40 M users in our growing community

⚡️ Join 40 M users in the crypto craze discussion

💬 Engage with your favorite top creators

👍 See what interests you

Trending Topics

BTCBreaksBelow60K

2.1M Views29.8K Discussing

BTC fell below $60,000 on November 20 for the first time since July, alongside a tech stock selloff and broader pressure on risk assets. Will $60K become resistance, or can BTC quickly reclaim it? What price or volume signals would convince you that selling pressure is easing?

GateDirectIPOPhase3ANTAllocates92100Shares

770.5K Views4.9K Discussing

NvidiaDropsNearly14Percent

323.3K Views7.5K Discussing

View More