Share your thoughts
placeholder
Article
I went to the restroom for a moment, and when I came back, the candlestick chart had already completed the drop I was waiting for.
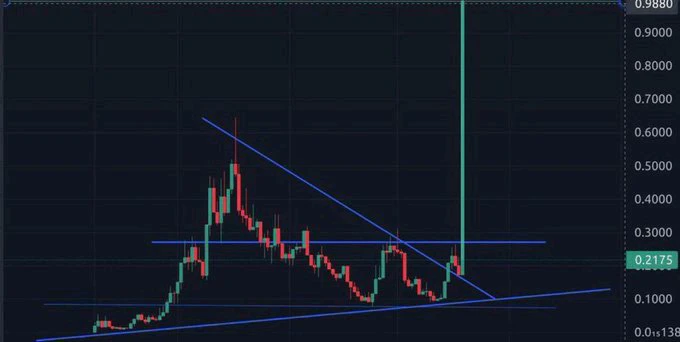
While everyone was still watching from the sidelines, $PRL made several pushes at the highs, but there was no volume. As planned, I placed a short order at 0.33936. I just refreshed the page, and the current price has already fallen to 0.13569, with the account showing +1181.3% unrealized profit. This trade feels great.
Here’s the position update: close 80% first, and move the remaining 20% to breakeven protection. If it keeps falling, let the profits run; if it r
post-image
PRL+6.81%
XRP-1.17%
LAB-2.83%
I just switched the app to the background, and it shot straight down—are you playing hide-and-seek with me? ⚡

During the repeated intraday swings, the signal I saw was crystal clear: every surge fell just short, and selling pressure was incredibly heavy. Resistance overhead was obvious; this kind of fake breakout can't fool anyone watching the trading volume.

That 0.20941 short position is now 0.04575, with +1538.53% secured. Nailed the rhythm—feels good, brothers. 📉

Markets are waited out, and profits are held onto. Panic comes from having no plan; losses come from overthinking.

Take
post-image
SNDK-0.10%
DOGE+0.58%
Nobody is talking about this hidden bearish setup in HOME.

$HOME /USDT - SHORT

Trade Plan:
Entry: 0.006 – 0.006
SL: 0.006
TP1: 0.006
TP2: 0.006
TP3: 0.006

Why this setup?
Why now? The daily trend is bearish, which sets the stage for a continuation move. The 1h price is sitting at the exact entry zone, giving us a precise trigger. The 15m RSI is at 52.13, showing just enough momentum to push lower without being overextended. The 1h ATR is 0.000053, confirming that the volatility is compressed enough for a sharp breakdown. The invalidation level is the line in the sand, and breaching it me
HOME-0.66%
Insiders are watching $LINK /USDT closely before this 4h breakout plays out

$LINK /USDT - LONG

Trade Plan:
Entry: 12.746 – 12.850
SL: 12.296
TP1: 13.175
TP2: 13.426
TP3: 13.802

Why this setup?
Why now? The daily trend is bullish, the 1h price sits at 12.798, and the 15m RSI at 41.36 shows room for upward momentum. The 1h ATR of 0.209242 defines realistic volatility, keeping the entry zone between 12.746 and 12.850 tight for a precise long. The first target at 13.175 and the second at 13.426 reward momentum, while 12.296 is the line in the sand that invalidates the setup.

Debate:
Are we
LINK+2.79%
I did nothing but use the restroom, and by the time I came back, the K-line had already done the work for me. During the intraday bottoming process, $BNB repeatedly retested the level without breaking down. I saw buying pressure gradually strengthening, so I immediately called it out and opened a long position. Entered at 641.25, now at 739.65, +1089.03%—taking off directly, perfectly catching the rhythm. This profit feels so good; staying up late was worth it, brothers. Take 80% profit first and secure the gains, then move the stop-loss on the remaining 20% to the entry price and let the prof
post-image
BNB-1.49%
SOL-1.65%
SNDK-0.10%
ETH Major Market Forecast: Steady Profits
live-cover
LIVE64
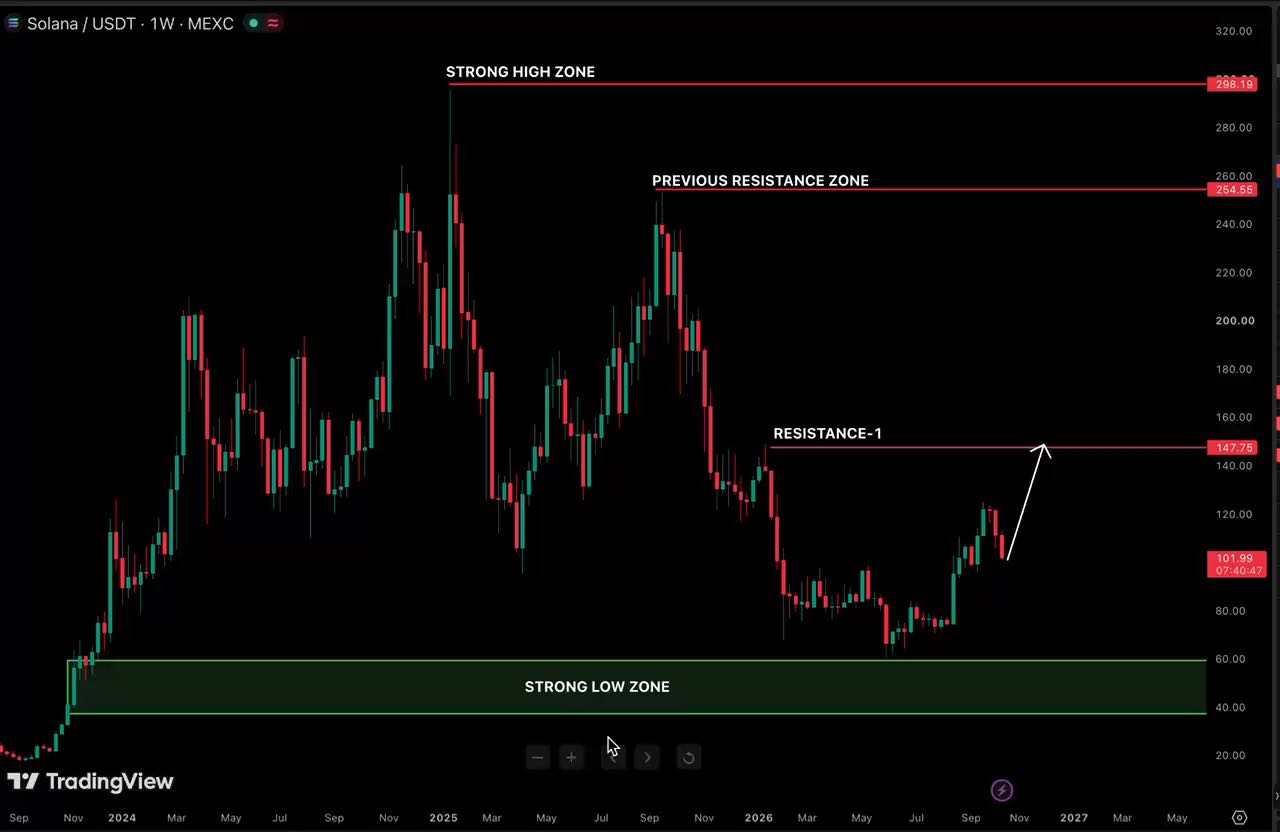
During the early session, the price pulled back to around 140.53 and stabilized, so I went long directly. The plan is simple: as long as the hourly candle body does not break down, the upside target is the high-volume trading zone, with the stop-loss placed simultaneously.

After entering, it consolidated for a short while, with one wick in between, but I held the position. Once the hourly candle closed bullish again and pushed upward on increased volume, I took 70% off at the first target, and moved the stop-loss on the remaining position directly above the breakeven line.

The subsequent m
post-image
SOL-1.65%
BNB-1.49%
I have been wrong so many times on $QNT but this sort of area on so many charts can change the direction of the chart in just a few days.
Not saying anything but it's better to be ready for a surprise $QNT rally, This chart is real sus!!!
QNT+0.30%
Insiders are quietly setting up a massive short on SOXL right now

$SOXL /USDT - SHORT

Trade Plan:
Entry: 126.17 – 126.73
SL: 129.09
TP1: 124.47
TP2: 123.15
TP3: 121.16

Why this setup?
Why now? The 1h price is sitting at 126.45 inside a tight entry zone between 126.17 and 126.73, giving us a precise trigger. The 1h ATR of 1.101089 shows the current volatility is compressed enough to expect a sharp move. The 15m RSI at 55.47 means the asset is not overbought yet, leaving room for sellers to dominate. The daily trend is range, which often breaks down violently in one direction once the rang
SOXL+1.72%
🚀 Fomo raked in $1.76M yesterday, beating $1.1M, but still lags with a staggering $57M monthly gap! 😲 Can it catch up? #CryptoInsights $FOMO $PUMP
PUMP+11.87%
Layout for Bitcoin, Ethereum, and Dogecoin
live-cover
LIVE1,423
In September, the U.S. Department of Commerce put macro data such as GDP and PCE onchain through Chainlink, alongside Wyoming stablecoin reserve verification. News sentiment is bullish, but this is essentially “expectations being fulfilled.”
After surging near 13.45, the price saw weakening support. My short thesis was that the positive news had been fully priced in, not that I was bearish on the ecosystem. After opening the position, $LINK retested 12.749; 75x leverage amplified short-term volatility, with unrealized gains of +369.81%. Trades like this are only suitable for quick, event-driv
post-image
LINK+2.79%
BTC-0.95%
ETH-0.35%
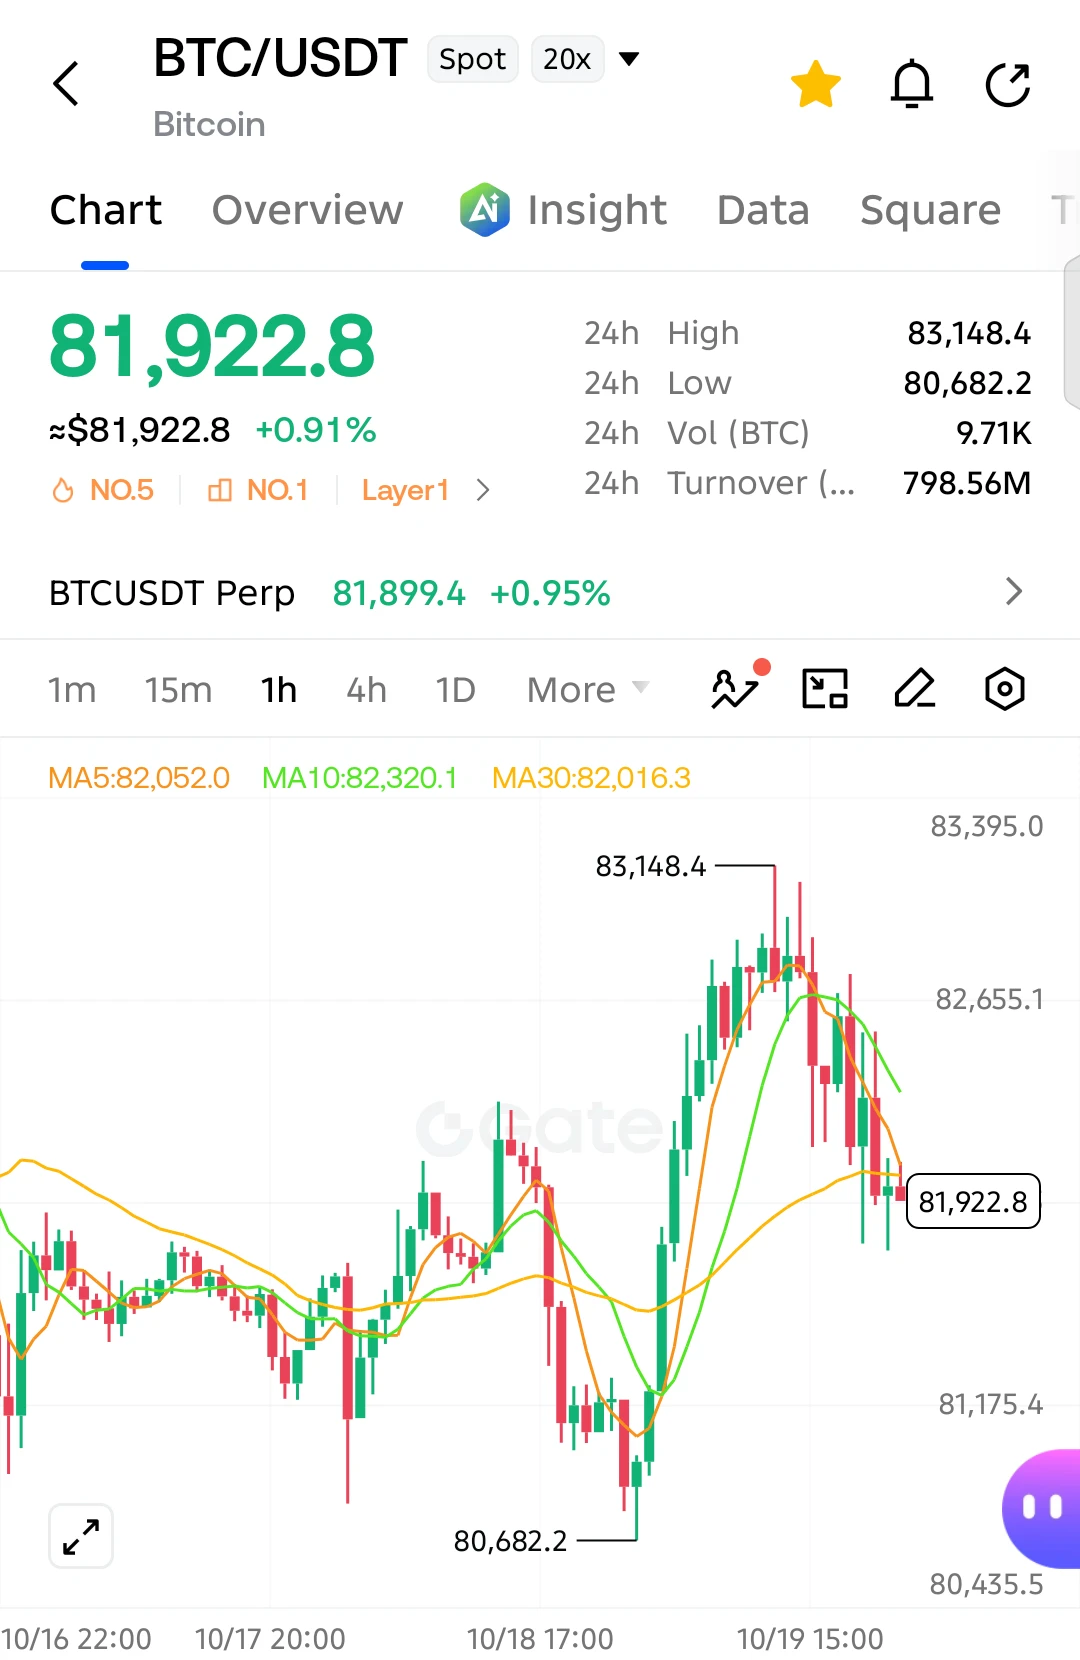
Early morning on 9.8 $BTC analysis
Yesterday morning, I was bearish from 80500 down to 78700, then turned bullish again in the evening. Bollinger Bands: The price retested the lower Bollinger Band, while the Bollinger channel has not fully converged downward. The lower band is the key short-term defense for bulls. The middle band at 79622 has turned into overhead resistance.
MACD: DIF is running below DEA, and the bearish histogram continues to expand, indicating that short-term bearish momentum is being released, which is normal during a pullback. Once the support below holds, the bearish hi
BTC-0.93%
While I was away using the restroom, I came back to find the candlestick chart had already wiped out my losses for me. $BTC This move ground people down until they had no patience left, then once it finally took off, it was fast and fierce. The position entered at 63014.1 was pushed to 79278.2, bringing in +4488.29%—feels great.

During the intraday plunge, I watched the minute chart: the key level held, the bottom moved sideways, and buying pressure kept strengthening. I had only one thought at the time: at this level, I wasn't afraid to enter again. And the market gave me the answer.

A q
post-image
BTC-0.95%
ADA-0.27%
LAB-2.83%
Bro had a bad day in the trenches, what do I tell him chat?
post-image
$RAYSOL Fifteen minutes ago, whale address 3B7x…9Qw2 just dumped 4.12 million tokens at an average price of 1.162, directly breaking through the 1.15 support. This isn’t retail panic selling—it’s early insider trading positions getting out. Another on-chain address, 9F2a…4Lk8, transferred a cumulative 2.84 million tokens to exchanges in 15 transactions over the past 48 hours, with an average cost basis of 0.87. These players are still sitting on 30% unrealized gains and could liquidate at any time. Glassnode data shows exchange net inflows have surged 320% over the past four hours, meaning sho
Everyone is about to get blindsided by SYMBOL right now.

$ADA /USDT - SHORT

Trade Plan:
Entry: 0.2184 – 0.2200
SL: 0.2270
TP1: 0.2133
TP2: 0.2094
TP3: 0.2036

Why this setup?
Why now? The daily trend is range, so the market is coiled and waiting for a catalyst. The 1h ATR of 0.003254 shows the average hourly move, giving us a realistic measure of volatility for the push. The 15m RSI at 45.93 signals the short-term momentum is neither overbought nor oversold, leaving room for a clean slide. The entry zone between 0.2184 and 0.2200 is where the 1h price sits at 0.2192, the perfect trigger f
ADA-0.27%
$SPCX /USDT is range-bound on the daily trend but the 1h ATR whispers a short is forming.

$SPCX /USDT - SHORT

Trade Plan:
Entry: 150.04 – 150.28
SL: 151.35
TP1: 149.27
TP2: 148.67
TP3: 147.78

Why this setup?
Why now? The daily trend is range, which means the 1h price of 150.16 sits at a natural magnet for mean reversion. The 15m RSI reading of 48.86 confirms the short-term momentum is neither oversold nor overbought, allowing a clean entry within the 150.04 to 150.28 zone. The 1h ATR of 0.496517 quantifies the volatility contraction before a potential snap-back toward TP1 at 149.27. If t
SPCX-0.72%
Just watch how everyone is rushing to fomo now just to become exit liquidity
You will learn 😂
post-image
This trend is so obvious I don't even need to think—the account is bouncing around on its own. 😎

With green covering the entire screen, I saw that $MAGMA 's rebound couldn't even bring in volume. The rebound was weak, and buying support at the highs was far too poor. This kind of weak bounce just gives the bears an opportunity, so I opened a position around 0.28292.

Looking at the market again just now, the current price has already reached 0.24011, and a +297.93% return is in the bag. Feeling great, brothers.

But making profits without knowing how to protect them is useless. First lock
post-image
MAGMA-7.47%
BTC-0.95%
SOL-1.65%
Load More

Join 40 M users in our growing community

⚡️ Join 40 M users in the crypto craze discussion

💬 Engage with your favorite top creators

👍 See what interests you

View More