Share your thoughts
placeholder
Article
PAIR successfully launched only 4 tokens in the past 24 hours, with the platform’s total trading volume below 400,000 U and 33,000 U worth of tokens burned in total.
PAIR’s market cap rose from over 10 million to a peak of over 50 million yesterday. Was this FOMO triggered by the burn?
Possibly, but it probably wasn’t the main reason. I think the market maker’s trading manipulation skills are simply too strong.
$RAY
RAY is up approximately 40.85% over 24 hours, currently at 1.2816 USDT, with a trading volume of approximately 3.43M USDT. On the 1-hour timeframe, it rose continuously from around 0.90, touched 1.4416, and then pulled back. For now, it looks more like high-volatility turnover than one-sided acceleration.
In the short term, watch the 1.25—1.26 support first; if it breaks, look to 1.20. Above, 1.33—1.40 is the first resistance zone, while 1.4416 is the key high for this move. Raydium is a decentralized trading and liquidity protocol on Solana, covering AMM, concentrated liquidity, LaunchL
post-image
RAY+41.63%
9.7 Su Wan Gold Morning Outlook
Overall, last week saw high-level choppy consolidation after a sharp rise, with rallies followed by pullbacks and repeated back-and-forth moves, without establishing a clear one-way trend. This morning, the market continued its mild corrective pace, with the overall pattern remaining high-level consolidation and repair.
The market is relatively subdued overall at present, with no major unexpected news. Gold prices are mainly tracking fluctuations in the U.S. dollar and U.S. Treasuries in the short term. There is pressure for a pullback above, but support below r
post-image
XAUT-0.18%
09-07
The NYSE is closed for the day;
Bitcoin
Open long around 79500, stop-loss at 78900, target 80000-81000;
Ethereum
Open short at 2525, stop-loss at 2550, target 2500-2470;
Open long at 2470, stop-loss at 2450, target 2490-2520;
ZEC
This thing is a bit crazy; be sure to set a stop-loss when chasing a long;
For a more conservative approach, open long at 1150, stop-loss at 1120, target 1200-1250;
Gold
Open short at the current price of 4420, stop-loss at 4435, target 4400-4380;
Personal opinion, not investment advice. Trade based on this at your own risk.
BTC+0.35%
ETH+1.07%
ZEC+15.97%
GLDX-0.32%
PAXG-0.22%
$SUI The next scenario
If August 18, 2026 is the lowest point of this cycle, and we go long at 0.7, the target price would be around 1.31
If there is one final pullback (expected to be no lower than 0.36), it will be considered the bottom of this cycle, and the target for the next bull market should be at least 2u
post-image
SUI+2.58%
$1000 to $100,000 Crypto Trade Challenge Today
live-cover
LIVE1,636
Everyone’s long gold at 4434—but the 4h chart is quietly begging for a haircut. $XAU /USDT

$XAU /USDT - SHORT

Trade Plan:
Entry: 4432.30 – 4435.08
SL: 4446.99
TP1: 4423.72
TP2: 4417.07
TP3: 4407.10

Why this setup?
Why now? The 1D trend is *range*, not breakout—so buying strength here is hope, not edge.
- RSI 15m at 54.87 shows zero momentum surge; we’re mid-range, not launching.
- ATR 1h at 5.54 means a weak pulse—perfect for a fade, not a chase.
- Short ref 4433.69 sits right at resistance with TP1 at 4423.72 (a 10-point drop) before TP2 at 4417.07.
- Conf 55% isn’t screaming, b
XAU-0.25%
$RAY Signal】Long | 1H support holds after pullback
$RAY Pullback to near the 1H EMA20, with clear buy-side support orders on the order book and a 17.5% bullish depth imbalance. The 4H MACD histogram is contracting but remains above the zero line, while the price holds the key 1.24 level. The 1H RSI is 58, with most overbought pressure already released. The funding rate is a moderate 0.005%, showing no signs of overheating. The current risk-reward ratio is approximately 1.5, making it worth a try.
🎯 Direction: Long
⚡ Entry/limit orders: Enter in batches within the 1.243758 - 1.247500 range
post-image
RAY+41.69%
The direction was right; the only question left was whether I could hold on. The $BNB rally I caught took roughly two or three false breakouts from structural confirmation to a decisive breakout on volume before it truly held above the level. The floating profit retraced for a while after entry, but once that bullish candle appeared, I knew the buyers had the upper hand.

Technically, I prioritize the coordination between price and volume. The breakout candle had sufficient volume, and the pullback did not erase the gains, which is a relatively healthy sign. The price repeatedly tested the 75
post-image
BNB-2.06%
XRP+0.35%
ZEC+15.99%
MARKET ALERT - XAUUSD
#Gate60MillionUsers
Trend Analysis
Timeframe 15 Minutes (M15): Dominant trend Bearish. Price is moving below all EMA lines (EMA5: 4428.51, EMA20: 4429.85, EMA50: 4436.57, EMA200: 4434.75). A narrow consolidation is occurring around the previous low support area (4365.56).
Timeframe 1 Hour (H1): Dominant trend Bearish/Downward Correction. A breakdown has occurred below the EMA support area. The price position (4425.80) is now below EMA5, EMA20 (4439.95), EMA50 (4437.54), and EMA200 (4461.86).
Trading Opportunities & Strategy
Primary Option (Sell on Rallies):
Entry: Sell w
Cryptocurrency_ALERT
GIVEAWAY FOR MY SUBSCRIBERS🥳
PART 1
XAUUSD-0.37%
  • 5
  • 1
September 7 Strategy Plan
Priority ranking, for regular followers only
Operation priority ranking
Priority 1: Go long on a pullback to 2498-2502
The win rate/risk-reward ratio is relatively balanced, making this the ideal long entry zone today.
Priority 2: Go long on a shallow pullback to 2510-2513
Suitable for a strong market, but since the current price is relatively high, keep the position light.
Priority 3: Chase long after a pullback following a firm hold above 2523
Only trade after a confirmed breakout; do not blindly chase near 2520.
Priority 4: Short under pressure at 2531-2535
A quick
post-image
ETH+1.17%
I was quite comfortable holding this BTC long position. The reason for entering was that a strong bullish candle appeared on the hourly chart and directly broke through the upper boundary of the previous consolidation range. I judged at the time that this was not simply a wick spike, but genuine capital entering the market, so I decisively followed up with a long position after the pullback confirmation.

After entering, the market did not put me through much of a grind and basically moved upward along the moving averages. I closed 70% of the position around +594.43%, and left the rest with a
post-image
BTC+0.38%
SOL+2.77%
LAB-5.46%
24 hours ago I was talking shit about Zcash and now it’s up another 20% in a day.
It can’t keep this up, right? 😅
(I don’t own this trash)
post-image
ZEC+15.97%
No vision, can't hold on—the profits on this move are as thin as paper, but I love it to death. During the repeated intraday swings, $ETH never broke the key level at 2473.40, while buying pressure kept growing stronger. I said right then that a pullback holding this level would be an opportunity. I had just switched the app to the background when it suddenly shot up. I'm now bullish toward 2515.54, with +295.24% in unrealized profit already on the books. Isn't this just playing hide-and-seek with me? In terms of execution, don't be greedy: take profit on 80% first and lock it in, protect the
post-image
ETH+1.17%
DOGE+0.91%
ADA+2.65%
  • 1
#Gate60MillionUsers
Reaching 60 million users is not simply a number on a dashboard. It represents millions of individual decisions, experiences, conversations, and moments of trust. Every user who joins a platform brings a different story, a different expectation, and a different reason for becoming part of the community. Together, these individual journeys create something much larger than a user base: they create a global movement shaped by participation, innovation, and shared ambition.
The milestone represented by #Gate60MillionUsers is a powerful reminder of how quickly technology can co
post-image
9.7 ZEC Analysis
ZEC staged a bullish probe—after testing the vacuum zone above, the main force actively pulled back to flush out weak holders. The pullback stopped right above the Bollinger middle band and the Alligator’s teeth, which can only be described as a textbook breakout retest. As long as the middle band holds, this is a bullish continuation pattern, not a top.
Driven by massive capital inflows, the price has fallen only about 4.7% from its high, indicating that the main force is not distributing but using high-level consolidation to facilitate a change of hands. The Bollinger Bands
post-image
ZEC+15.97%
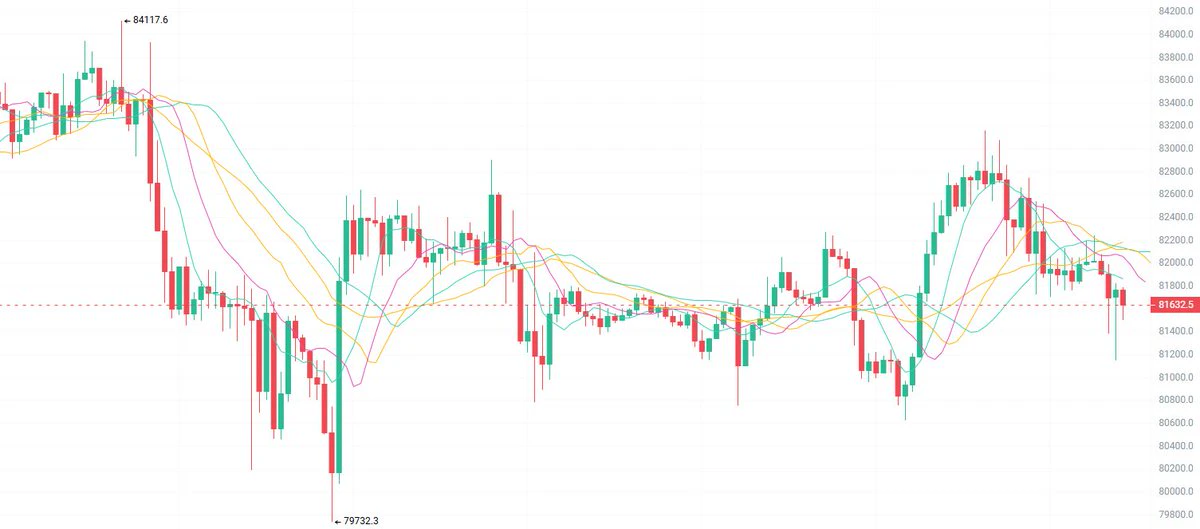
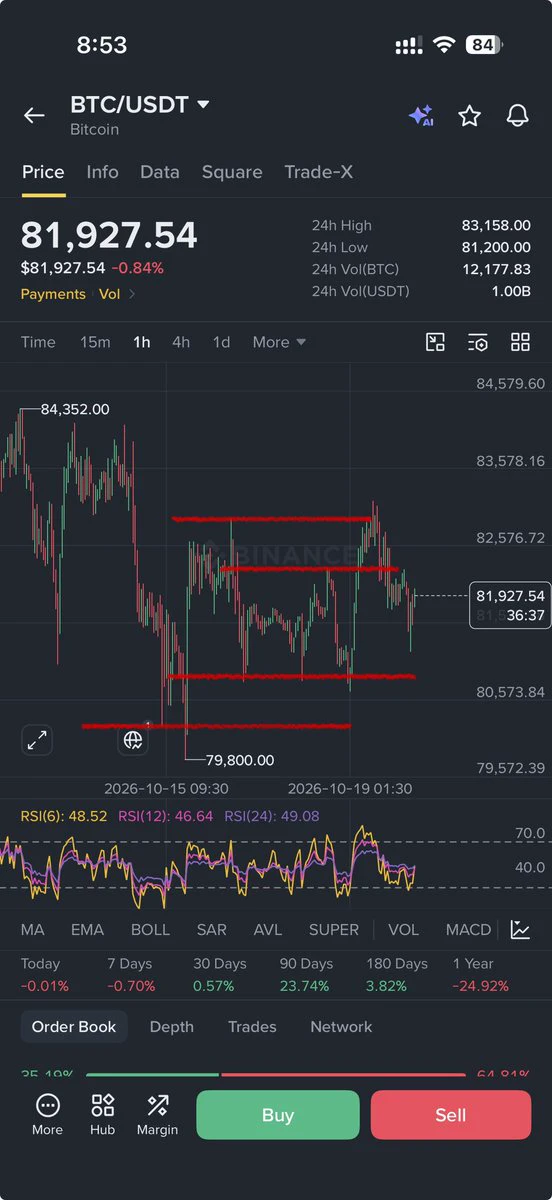
Those willing to short can gradually enter positions starting this week. Be sure to set a stop-loss around 84,000–85,000. Entries between 80,000 and 83,000 are acceptable. Use limit orders with light positions; place an order near 80,000 with a position no larger than 1%. If the price rises, add gradually; if it reaches around 83,000, make the final addition and then wait for the direction to emerge. If you have patience, you can short at 82,000–83,000 with an appropriate position size. It is hard to say, but this is how I plan to trade. A stop-loss must always be used.
Long positions must als
post-image
Financial News, Crypto Updates, Real-World Strategies
live-cover
LIVE1,416
Proper capital management is crucial when trading options! Do not use more than 1.5x leverage at most. Here is some advice for everyone trading options!
📉 Three warning levels for the equity curve📈
Plot the account's net value as a line chart and monitor three levels:
1️⃣ Yellow line (10% drawdown): Stop adding to positions; only reduce, never add. Review the three most recent losing trades
2️⃣ Orange line (20% drawdown): Cut each position size in half; only trade the setups you know best. Return to normal only after two consecutive bullish candles
3️⃣ Red line (30% drawdown): Stay completel
post-image
Load More

Join 40 M users in our growing community

⚡️ Join 40 M users in the crypto craze discussion

💬 Engage with your favorite top creators

👍 See what interests you

View More