Square
Following
Hot
News
Profile
Share your thoughts
placeholder
Article
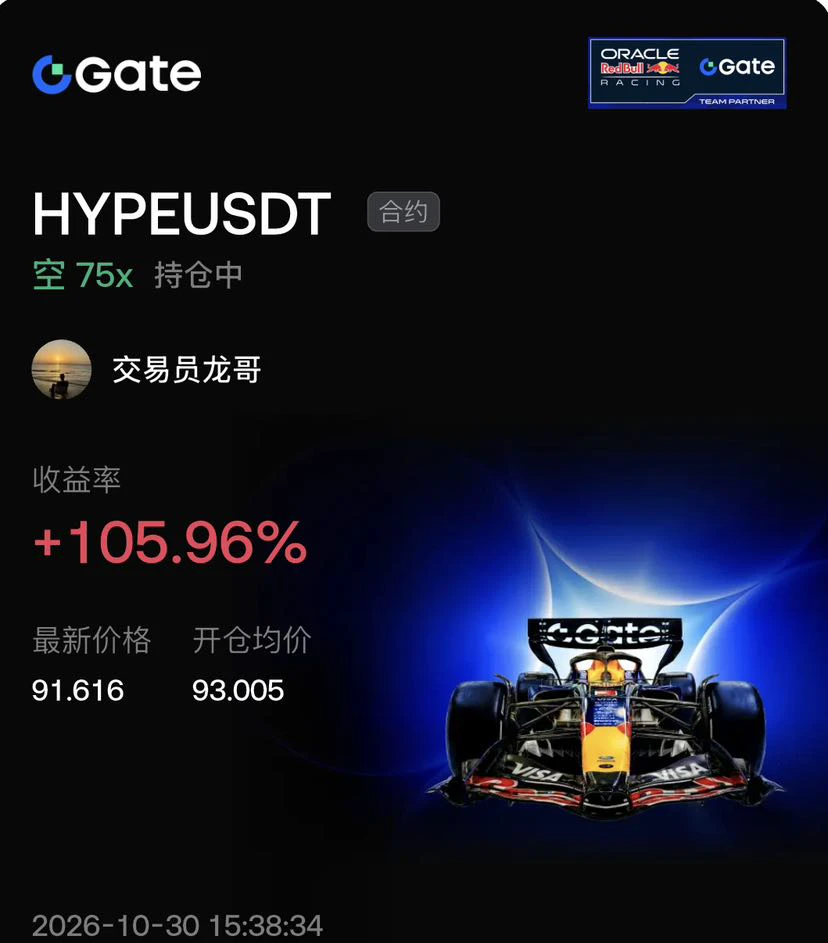
Folks, this HYPE sell-off is so satisfying! Riding the short trend, I used 75x leverage to score a 105% return!
Look at the chart: the HYPEUSDT contract plunged from an average entry price of 93.005 to the latest price of 91.616. I precisely positioned a short on Gate, and the return shot up to +105.96%! In a highly volatile market, going with the trend and taking profits is this powerful.
Trading ultimately means going against human nature. Keep your hands in check during a crash instead of blindly buying the dip, follow the trend and dare to act, and use discipline to lock in profits. No mat
post-image
HYPE+0.33%
BTC-0.65%
ETH-1.23%
BTC ETFs continue attracting inflows, while ETH ETFs see outflows! Why are institutional investors b
live-cover
LIVE2,250
Trenches
BNCB
B
bade
b
BNCB
0x49...ec3f
Market Cap
$.
Change
.
24h Vol
$.
Holders
.
ENA
E
bade
b
ENA
0x57...6061
Market Cap
$.
Change
.
24h Vol
$.
Holders
.
PEPE
P
bade
b
PEPE
0x69...1933
Market Cap
$.
Change
.
24h Vol
$.
Holders
.
GTA6
G
bade
b
GTA6
4kjr...zDnz
Market Cap
$.
Change
.
24h Vol
$.
Holders
.
XDP
X
bade
b
XDP
0x07...91d0
Market Cap
$.
Change
.
24h Vol
$.
Holders
.
I just opened a quick short trade on $BEAT and am entering now. Sell at 0.09900 or 0.10200. First target: 0.09700; second target: 0.09500; third target: 0.09300; final target: 0.09100++. Set the stop-loss above 0.10800
post-image
BEAT-1.19%
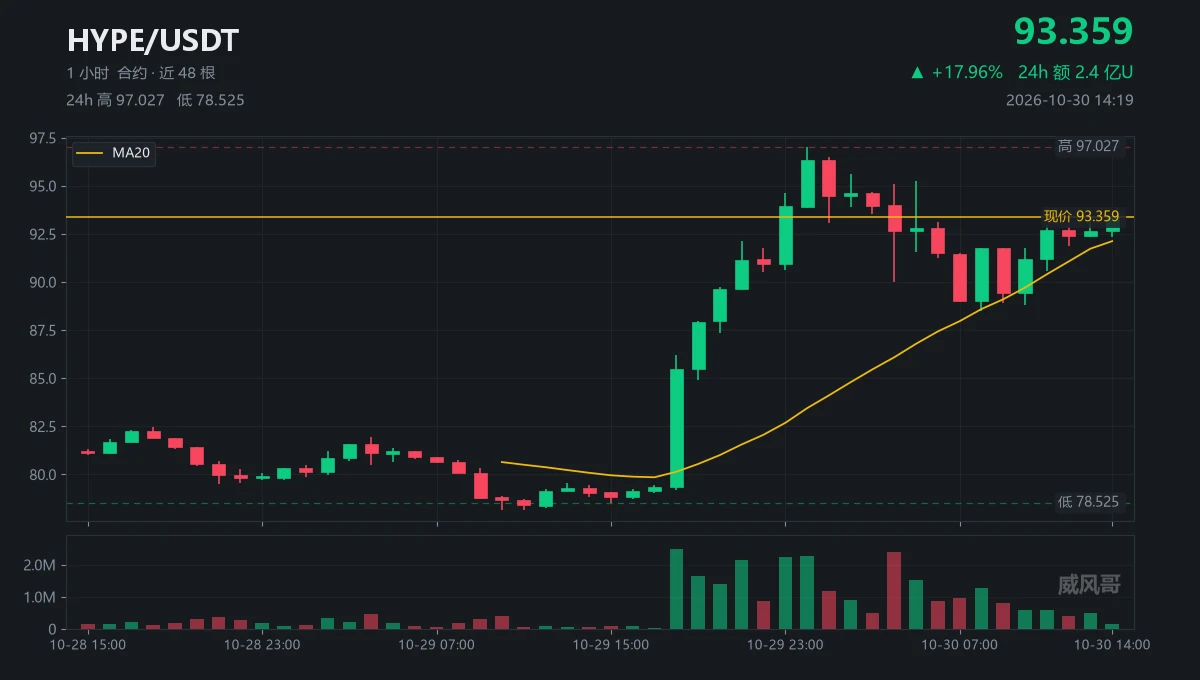
88.9 got tested twice, and that's it?
Once at 07:00, once at 09:00, five cents apart.
It held both times, then climbed back to 93 in five hours.
Now $HYPE 93.59; the chart closed at 93.359, both above MA20.
Yesterday's 18:00 candle was where it all started.
From 79.33, one candle shot up to 85.5.
2.47 million contracts, versus 43,000 on the previous candle—57 times as much.
In 13 hours, it went from 78.159 to 97.027.
24.2.
After such a big rise, nobody wants to buy in at 97.
It hit the top at 00:00, then plunged back to 89.995 by 04:00.
The current 93 is the top of the range, not a new high.
I
post-image
HYPE+0.33%
$IDOL It's about to crash, and some retail traders can't push it back up. The rich man's fool of a son just loves pumping the market.
IDOL-6.71%
  • 1
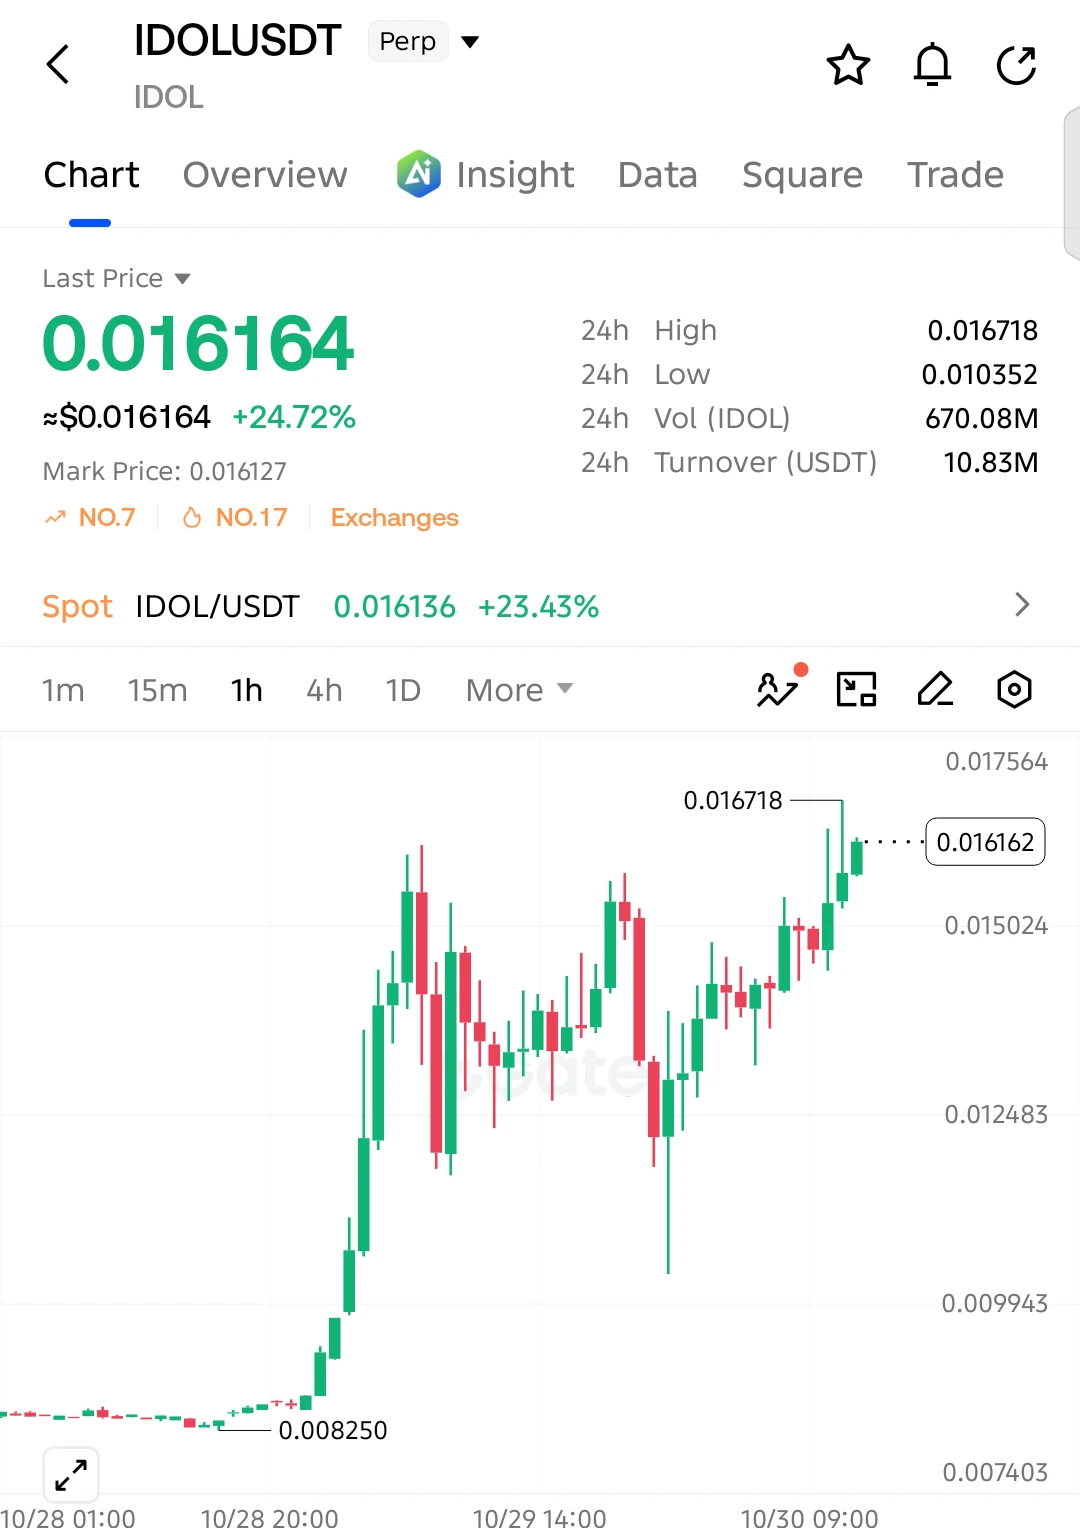
$IDOL LONG SETUP — BULLS ARE TAKING CONTROL!
$IDOL is showing strong bullish momentum on the 1H chart, gaining over 24% in 24 hours. Buyers are forming higher lows and pushing toward the recent high of 0.016718. A breakout above this resistance could trigger another upward move.
Entry: 0.016164
SL: 0.015350
TP1: 0.016718
TP2: 0.017200
TP3: 0.017800
Extended Target: 0.018500
The bullish structure remains intact above 0.015350. A confirmed breakout above 0.016718 would strengthen the continuation setup, while rejection could lead to a short-term pullback.
Can $IDOL break its recent high and cont
post-image
IDOL-6.71%
  • 2
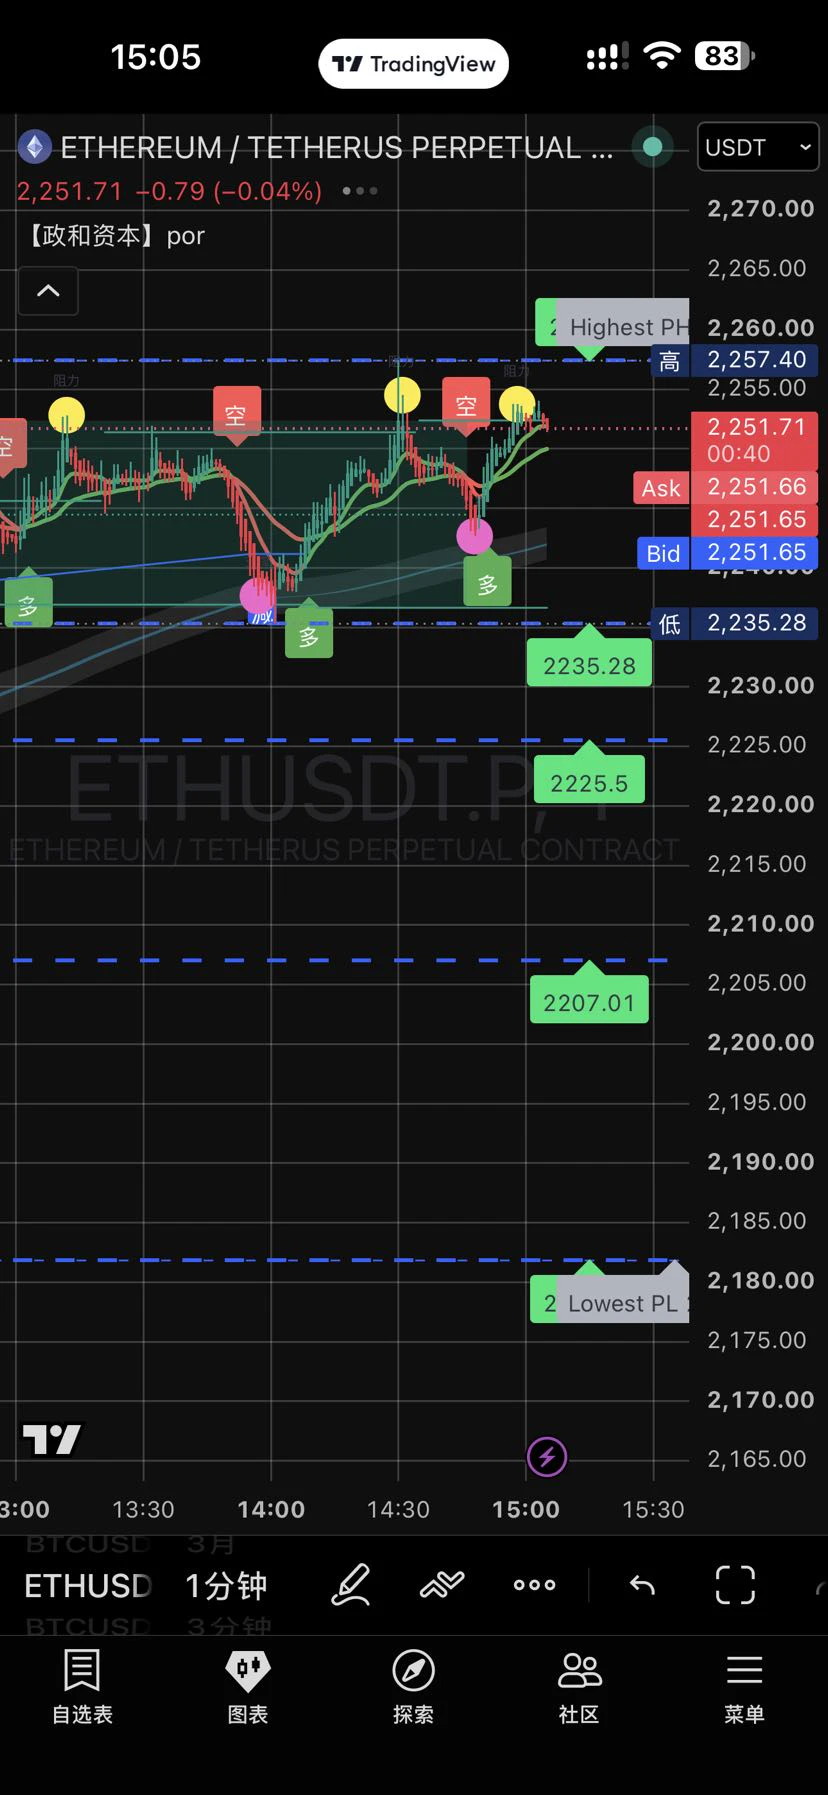
Today’s ETH Market Outlook: A Trend Down, Not a Routine Pullback

Unlike BTC, which was hit by a sudden event, ETH’s weakness today is the result of structural pressure and multiple bearish factors converging. As of October 30, ETH was trading around $2,200–$2,250, with its 24-hour decline at one point exceeding 7%. Technicals have confirmed a break below several key defenses:‌
• The lower boundary of the daily ascending channel has been decisively breached, and the short-term moving averages (7-day 2,346, 20-day 2,412, 50-day 2,532) are in a standard bearish alignment, with price under broa
post-image
ETH-1.23%
#StrategySTRCNears100ParValue
Strategy (STRC) Preferred Stock Surges Toward Its Historic $100 Par Value: A Landmark Moment of Strength, Resilience, and Investor Triumph
In a powerful display of market confidence and corporate engineering excellence, Strategy Inc’s Variable Rate Series A Perpetual Stretch Preferred Stock (Nasdaq: STRC) is trading at approximately $99.99, just a single penny away from its $100 stated par value / nominal value / liquidation preference. This is not a minor technical move. This is STRC standing at the threshold of its designed price anchor after a dramatic recover
  • 5
Wallet balance hasn’t refreshed—are my coins gone?
When I open my wallet and suddenly see no balance, it’s easy to panic. But first, I’ll check whether the assets have actually changed or the page just isn’t loading the data correctly.
The wallet needs to retrieve on-chain information through a node. Connection issues or slow data updates can affect what’s displayed, so I won’t draw conclusions based on just one page.
I’ll first check the network and address, then go to the relevant block explorer to check the balance and transfer history for the same token contract. One detail to keep in mind
post-image
Is launching a testnet enough to make it a finished product?
When researching a blockchain project and seeing the words “network launch,” I first check the full picture: was it the testnet or the mainnet that launched?
This directly affects how I interpret the data that follows.
Transaction counts, participating addresses, and performance in a test environment can help assess functional testing, but they cannot be taken as evidence that the finished product has already attracted real demand on the same scale. Test-token balances also cannot be valued at mainnet asset prices.
In my notes, I sep
post-image
GM Everyone
Stay strong. Stay patient. The market will bounce back.
post-image
Intel's earnings clearly beat expectations, yet its stock plunged 23%! What exactly is Wall Street afraid of?
These days, a publicly traded company can make money without its stock rising, and getting top marks doesn't necessarily earn you a reward. Intel just gave the market a real-world lesson in investing: third-quarter revenue was $16.51 billion, up 21% year over year, and adjusted earnings per share were $0.52, beating market expectations. Yet its stock plunged as much as about 23% in after-hours trading!
Where did things go wrong? The answer lies in next quarter's report card.
Intel expe
INTC-3.60%
GOOG-12.46%
  • 12
Doing the same button clicks, browsing the same webpages, and copying the same files every day? These 8 GitHub tools can help you do less repetitive work.
1. Automa | Make your browser work step by step
Open webpages, fill out forms, click buttons, extract text—link these fixed actions into a workflow, then trigger it on demand or run it on a schedule.
Install the browser extension to get started. The browser needs to stay running; if a webpage's layout changes, you may need to update the workflow.
2.
No need to refresh pages one by one every day to track prices, restocks, or announcements. S
$DOGE Boldly copy the bot below and go for it. Increase profits, reduce risks. Please follow me, thank you.#BTC跌至7.7万美元 #ETH回落2200美元
DOGE-0.22%
Google shares suffer a record plunge after earnings! The more it spends on AI, the more worried the
live-cover
LIVE1,931
Intel’s earnings beat expectations, yet the stock plunged 23%! I’m outright bearish this time, and the reasons go beyond disappointing earnings.
Intel reported Q3 results last night, and the stock briefly fell to around $70 after hours. It had closed at $92.07 the day before. One earnings report later, the stock was down more than 20%.
① The earnings actually weren’t bad
Q3 revenue was $16.5 billion, up 21% year over year, and adjusted earnings per share were $0.52, above the market expectation of $0.40.
Revenue from its data center and AI businesses grew 78% year over year.
Looking at these f
INTC-3.60%
Pairing a spot position with a short—is that enough to hedge?
Holding spot in one coin and opening a short on another doesn’t make me assume the risk has already been offset.
Just because two assets often rose and fell together in the past doesn’t mean they’ll move in sync through every market move ahead. Especially when news specific to one project breaks, the gap between them could suddenly widen.
Take a hypothetical example: holding $1,000 worth of spot in one coin while shorting another coin with a notional value of $1,000. If the first falls 10% and the second falls only 3%, then, ignorin
post-image
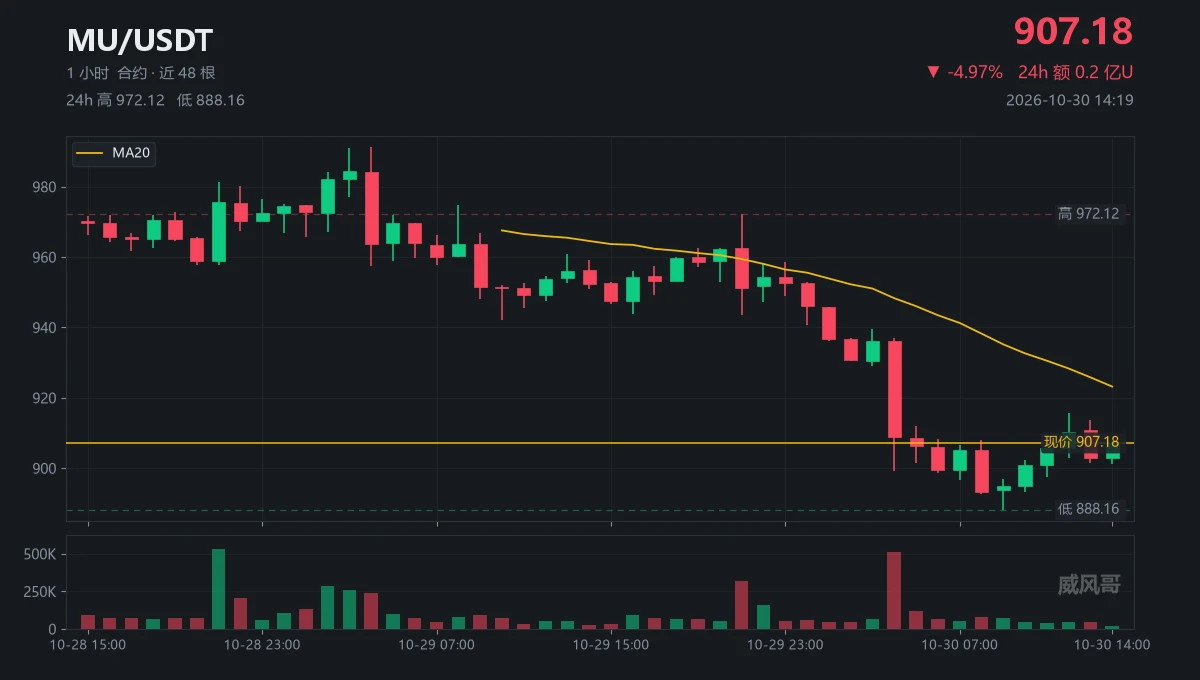
At 04:00, one candle saw volume of 509,000, while the first four totaled 219,000.
It opened at 936.08 and closed at 908.77, dropping 27 bucks in a single candle.
05:00: 906, 06:00: 899, 08:00: 893.
At 09:00, it hit 888.16, with volume down to just 76,000.
From 09:00 to 13:00, it took four candles just to climb back to 910.18.
It took one candle to dump, but four to recover—a fourfold difference in efficiency.
Now $MU 907.18, with MA20 at 923.20, still weighing on it by 16 bucks.
The 24-hour range is 972.12 to 888.16, a 9% swing.
It's 2 a.m. ET in Beijing right now, and the U.S. stock market is
post-image
MU-0.63%
something is happening on hyperevm
$317m in DEX volume yesterday
ON+4.77%
Load More

Join 40 M users in our growing community

⚡️ Join 40 M users in the crypto craze discussion

💬 Engage with your favorite top creators

👍 See what interests you

Trending Topics

BTCDropsToward77000

61.01k Views39.2k Discussing

$BTC briefly fell below $77,000 and remains under pressure around the $77K zone, with its 24-hour decline still above 4%. With risk appetite weakening and Fed uncertainty rising, where is the next key support after losing $80K?

IntelBeatsEarningsButStockPlunges

3.68k Views581 Discussing

StrategySTRCNears100ParValue

4.72k Views3.97k Discussing

View More