
Share your thoughts
placeholder
Article
I did nothing—just went to the restroom, and when I came back, the candlestick chart had already done the work for me😳

During the repeated intraday swings, $ARB kept retesting 0.10885 without breaking below it, while volume failed to pick up. I judged that funds were accumulating at this level, so I directly opened a long position.

When I came back, the price had shot straight up to 0.17025, giving me +3232.92% in unrealized profit. This move gave us the answer, brothers🔥

First take profit on 80% and put the bulk of it in my pocket; move the stop loss on the remaining 20% to around the
post-image
ARB-10.71%
SOL-2.21%
BTC-1.31%
[New Streamer] Market Prediction
live-cover
LIVE75
ethereum:native
Higher low or one thousand US dollars
post-image
ETH-1.00%
I was just thinking about heading up front to complain about the broader market, but then I looked down at the unrealized PnL on my short position—never mind, the market is always right. That rebound candlestick a few days ago before bed looked pretty intimidating, but I was watching the key levels above; the volume simply didn’t follow through—a classic low-volume bull trap. While everyone else was rushing out, I stayed calm and directly placed a short order, entering at 266.18. I just refreshed the chart, and it has already moved to 255.66, with unrealized gains of +77.81%. I timed this move
post-image
SNDK-0.21%
ETH-0.98%
boner-coin:native so stronks
Is it breaking out
0x98096d17e191b3da1d5f99a6d7b3584351b11e18
#crypto $btc $sol
post-image
BTC-1.32%
SOL-2.21%
PROLOGUEThis long position was quite comfortable to hold. I entered because a strong bullish candle appeared on the hourly chart and directly broke through the upper boundary of the previous consolidation range. At the time, I judged that this was not just a simple wick but genuine capital entering the market, so I decisively went long after the pullback confirmation.

After entry, the market did not put me through much grind and basically moved upward along the moving averages. I closed 70% of the position around +205.42%, and set a protective stop for the remainder to continue holding, hopi
post-image
PROLOGUE+17.67%
SOL-2.21%
DOGE-0.21%
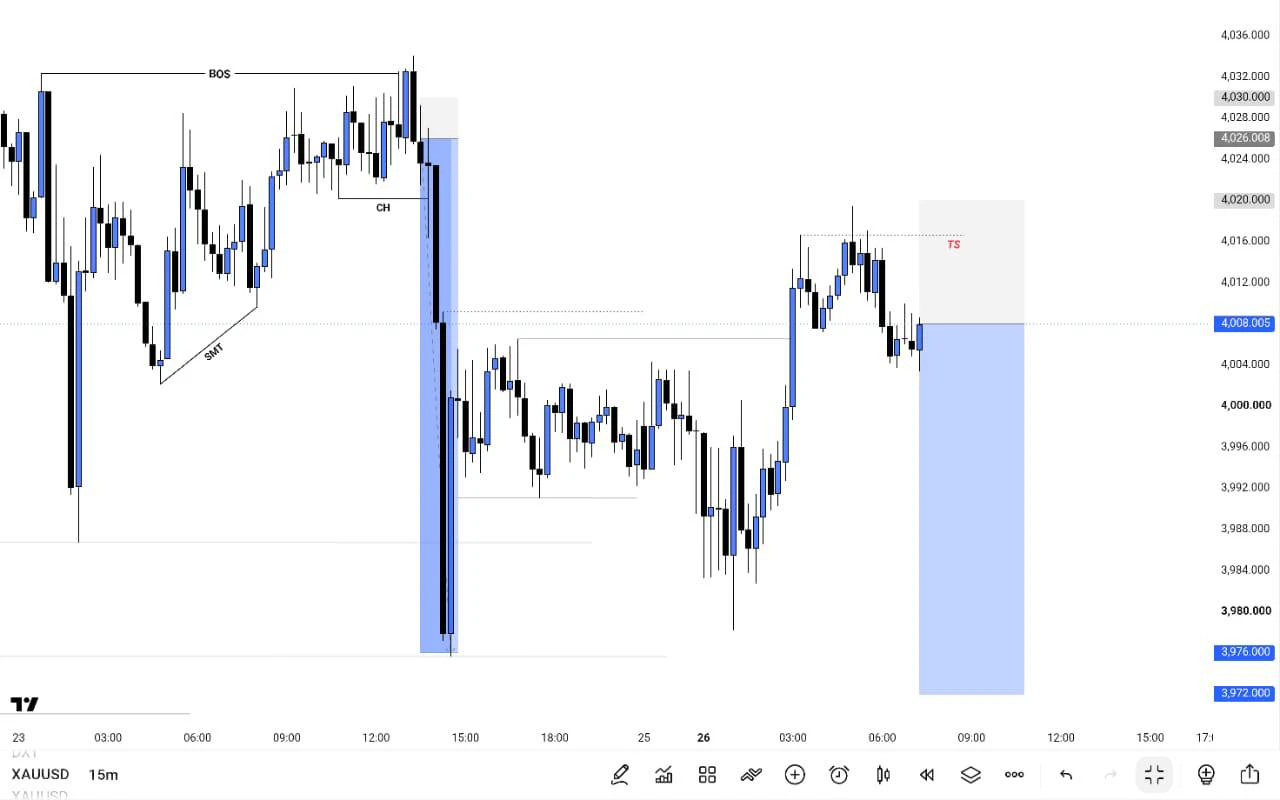
9.8 Jince Gold Morning Review: Gold in wide-range consolidation with repeated tug-of-war; intraday bull-bear dividing line about to be confirmed

Intraday spot gold formed a wide-range consolidation on the 15-minute chart. After rising to around 4435 in the early session, prices came under pressure and pulled back, then fluctuated lower to hit a stage low of 4381. Buying subsequently entered and drove a rebound, with prices recovering to around 4414 at the high before encountering resistance again and falling back to around 4407. Short-term bulls and bears are engaged in repeated battles, wit
post-image
GLDX+0.02%
PAXG-0.42%
Smart money is quietly setting up a short on $XAU /USDT while most traders are still chasing highs.

$XAU /USDT - SHORT

Trade Plan:
Entry: 4414.30 – 4419.14
SL: 4439.92
TP1: 4399.32
TP2: 4387.72
TP3: 4370.32

Why this setup?
Why now? The daily trend is range-bound, which often precedes a directional breakdown, and the 1h ATR of 9.666413 confirms enough volatility to fuel a meaningful move. The 15m RSI at 57.09 shows the asset is not yet overbought, leaving room for the short to develop. Entry is anchored at 4416.72 with a tight zone between 4414.30 and 4419.14, offering a precise risk-defi
XAU-0.54%
I didn’t chase when that bullish candle pushed upward with a wick; I didn’t participate from the launch to the high, because before the top of the range breaks out and holds with increased volume, most breakouts are bull traps. Only after the price pulled back and broke down did I add to the short in line with the trend.

The core entry logic was the rapid sell-off after the false breakout. The price fell back inside the range, showing that selling pressure overhead remained heavy. The lower-timeframe bulls’ advances had been blocked at the same level three consecutive times, so chasing longs
post-image
LAB-2.71%
BTC-1.31%
Insiders are quietly pressing SHORT on BNB before the next leg down.

$BNB /USDT - SHORT

Trade Plan:
Entry: 738.6 – 740.6
SL: 749.4
TP1: 732.2
TP2: 727.3
TP3: 719.9

Why this setup?
Why now? The daily trend is range-bound, but the 1h price sits at 739.6 inside a tight entry zone between 738.6 and 740.6, giving us a precise trigger. The 15m RSI at 46.78 shows mild bearish momentum without being overextended, allowing room for a clean move. The 1h ATR of 4.101084 tells us volatility is compressed, so a breakout should be sharp once price acts. The invalidation level at 729.3 is the line in t
BNB-1.77%
I didn’t chase the first push higher because the price was too far above the moving average, and entering then would have made it easy to get stopped out by a wick. After waiting for a pullback to stabilize, I entered at 0.5045 for this $EDGEX long.

After entry, the market went into weak consolidation, with the range gradually narrowing and volume shrinking sharply. This kind of setup is the biggest test of patience, and many people get worn down into manually stopping out. I held my core position without moving it, only gradually tightening my stop-loss.

When the consolidation range broke
post-image
EDGEX-6.75%
ZEC-7.65%
LAB-2.71%
BTC, Gold, and Crude Oil Analysis
live-cover
LIVE66
Everyone is sleeping on $LINK /USDT while the daily trend screams bullish and the 1h ATR hints at a massive move.

$LINK /USDT - LONG

Trade Plan:
Entry: 12.726 – 12.830
SL: 12.282
TP1: 13.150
TP2: 13.398
TP3: 13.770

Why this setup?
Why now? The 1D trend is firmly bullish, the 15m RSI sits at 41.78 showing room to run, and the 1h ATR of 0.206653 signals an explosive impulse is building. With the 1h price anchored at 12.778 inside the entry zone between 12.726 and 12.830, the setup targets TP1 at 13.150 and TP2 at 13.398, but the trade invalidates hard if the 1h price breaks below 11.785. T
LINK-2.62%
$HYPE /USDT is about to break out but nobody is watching.

$HYPE /USDT - LONG

Trade Plan:
Entry: 84.964 – 85.384
SL: 83.160
TP1: 86.684
TP2: 87.691
TP3: 89.202

Why this setup?
Why now? The daily trend is bullish and the 1h price is holding steady at 85.174, setting up a clean entry zone between 84.964 and 85.384. The 15m RSI at 42.28 shows just enough weakness to avoid a crowded long, while the 1h ATR of 0.839155 confirms the move has real momentum behind it. With TP1 at 86.684 and TP2 at 87.691, the risk reward is stacked in our favor. The trade is invalidated the moment price closes bel
HYPE-2.67%
XRP is range bound but smart money is positioning for a sharp drop.

$XRP /USDT - SHORT

Trade Plan:
Entry: 1.3963 – 1.4019
SL: 1.4256
TP1: 1.3792
TP2: 1.3660
TP3: 1.3461

Why this setup?
Why now? The daily trend is range, but the 1h ATR of 0.011034 signals a volatility expansion that often precedes a directional break. The 15m RSI at 52.32 shows mild bearish momentum, while the entry zone between 1.3963 and 1.4019 offers a precise setup for the short bias. TP1 at 1.3792 and TP2 at 1.3660 represent measured targets from the current 1h price of 1.3988, with the invalidation level at 1.4101 a
XRP-2.11%
The hand that set the stop-loss a few days ago trembled slightly; this morning I realized that was unnecessary filial piety. My last glance before bed showed the bottom moving sideways, with funds quietly entering. I felt it was about to take off, so I casually placed a long order. Entered at 96.30, and today it shot straight to 116.04, for a +503.02% return—feels incredible. I’ve closed 75% first, and set the remaining 25% to protect the entry price, letting it run on its own. I’d rather miss a limit-up move than catch a falling knife and end up covered in blood. Don’t chase the trade now; th
post-image
ADA-1.36%
ETH-0.98%
Nobody is talking about the quiet move forming in NEAR right now.

$NEAR /USDT - LONG

Trade Plan:
Entry: 2.2933 – 2.3171
SL: 2.1908
TP1: 2.3910
TP2: 2.4482
TP3: 2.5340

Why this setup?
Why now? The daily trend is bullish with the 4h structure turning higher, the 1h ATR at 0.047666 showing enough volatility to fuel a clean push, and the 15m RSI at 45.87 proving we are not yet overbought. The entry zone at 2.3052 aligns with the 1h price, giving a precise reference for a long position with targets at 2.3910 and 2.4482. The invalidation level of 2.0649 is the hard line that would wipe out the
NEAR-5.81%
Hey @vladtenev would you wear this hat?
post-image
9.8 Gold Morning Strategy
On the hourly chart, gold prices are generally fluctuating at low levels after the decline, trading below the middle Bollinger Band under pressure. The upper Bollinger Band continues to exert downward pressure, and multiple rebounds have failed to break through effectively. Bears have the upper hand in the short term, while the pace of the decline has slowed somewhat. Do not blindly bottom-fish in the morning; focus on opportunities to short when rebounds encounter resistance.
Key Levels
Resistance: 4420, 4440
Support: 4405, 4385
Strategy:
Short on resistance in the 4
post-image
XAUT-0.44%
This return has me feeling both flattered and terrified, afraid the market will catch on tomorrow and blacklist me. During the repeated intraday swings, $VIRTUAL ’s sell wall stayed heavy, and every rebound looked weak and listless, like it hadn’t eaten. I figured this kind of low-volume rebound wouldn’t hold, so I went straight short, entering at 0.8145.

I didn’t expect the current price to be 0.732, with a return of +721.31%. Everyone on board must be laughing in their sleep. This round of waiting wasn’t in vain—feeling great, brothers.

As for the trade, I’ll first close 80% and lock in
post-image
VIRTUAL-0.43%
BTC-1.31%
SOL-2.21%
Load More

Join 40 M users in our growing community

⚡️ Join 40 M users in the crypto craze discussion

💬 Engage with your favorite top creators

👍 See what interests you

View More