Share your thoughts
placeholder
Article
I was just about to go to the forum and cuss people out, but then I saw my balance and thought, never mind—the market is always right.

With the whole screen glowing green, $XRP clearly lacked enough support at the highs, and every rebound was a bull trap. At the time, I was practically ready to paste the words “resistance above” right in everyone’s face. Friends who followed me into a short at 1.3836 should all be laughing in their sleep by now.

The current quote is 1.3493, with +230.44% already secured. Take 80% off the table first, move the stop-loss on the remaining 20% to around the e
post-image
XRP-2.78%
ADA-1.71%
SOL-1.60%
slowly grinding my way back by aping every gay penis and butt coin
honest work
post-image
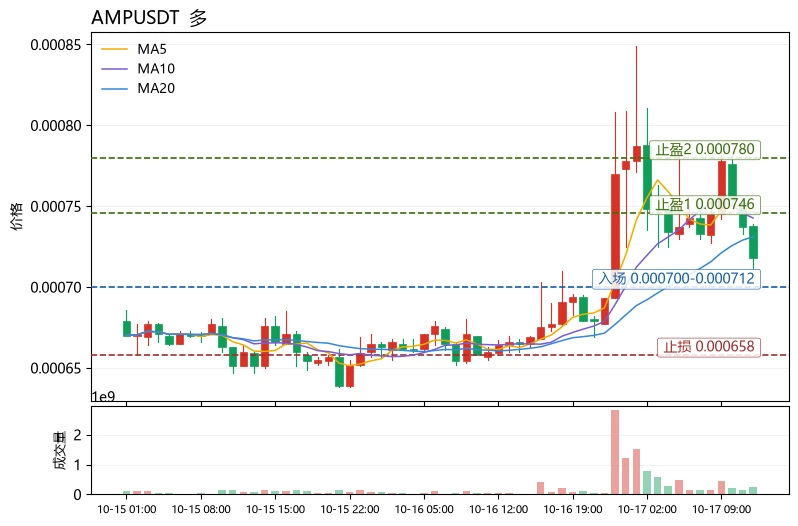
Everyone is missing the obvious bearish setup forming on $SKYAI /USDT right now.

$SKYAI /USDT - SHORT

Trade Plan:
Entry: 0.05083 – 0.05145
SL: 0.05412
TP1: 0.04890
TP2: 0.04741
TP3: 0.04518

Why this setup?
Why now? The daily trend is bearish with the 1h price at 0.05114, placing us inside a high-confidence short entry zone. The 15m RSI sitting at 52.56 shows neither overbought nor oversold, meaning momentum is neutral and ready to follow the lower timeframe trend. The 1h ATR of 0.001242 confirms volatility is compressed enough for a decisive move. We target TP1 at 0.04890 and TP2 at 0.04
SKYAI-6.93%
What’s up fam?
post-image
Yea this is bad
Really bad
post-image
No group like this 🙏🏻
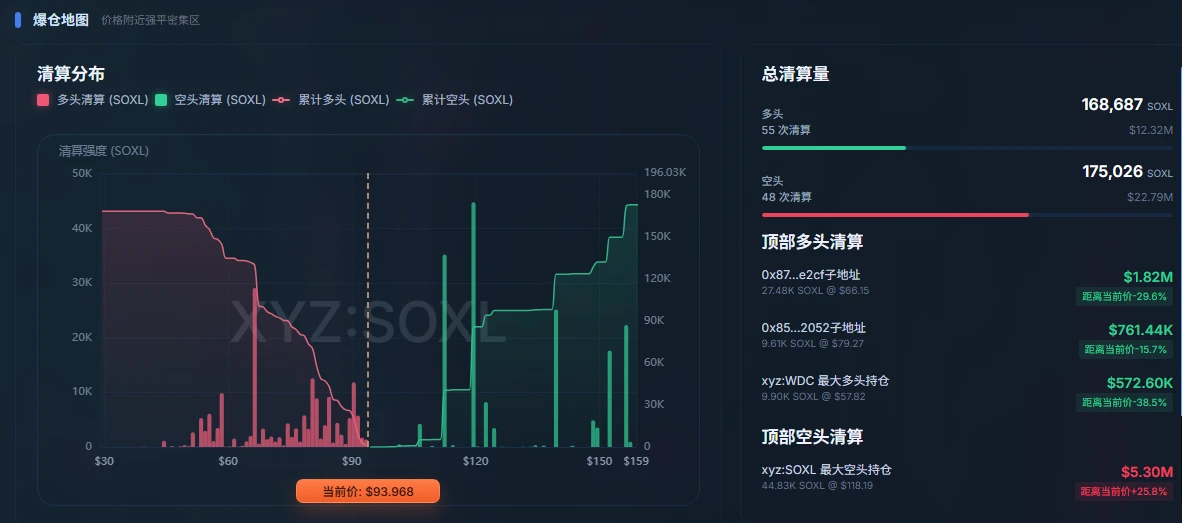
This move is so straightforward I don’t even need to think—the account is out there dancing on its own. I opened the chart this morning, and $SKHYNIX held firm after one pullback. Buying pressure was clearly getting stronger, and I knew at a glance that this move wasn’t over yet. The message at the time was: get in once it holds; don’t wait until it takes off and then kick yourself.

Don’t lose patience grinding through the range, only to try to regain your dignity in a one-way move.

1235.91 to 1346.01, unrealized profit +631.68%—nailed it. No trades, no analysis, just pure luck? No, the e
post-image
SKHYNIX-5.85%
ADA-1.71%
DOGE-2.28%
Gold is currently in a period of consolidation after the decline, with the market awaiting Friday’s CPI inflation data. The data will directly affect expectations for Federal Reserve policy, and the market will likely experience significant volatility.
From the candlestick structure, the support area below remains fairly resilient. As long as key support holds, there is room for a rebound and recovery, so the strategy is mainly to go long on pullbacks.
Once the price pulls back to the 4300-4320 support range and stabilizes, consider a short-term long position, targeting 4350-4380. If support a
post-image
XAUT-1.68%
just another 287 more fumbles chat before we make it fr fr
post-image
No execution, no analysis, just pure luck. Even I feel embarrassed saying these results out loud. When the market first dumped in the early session, I was still hesitating over whether to go long, but $HEMI immediately told me to stop dreaming.

When the market plunged intraday, each rebound was weaker than the last, volume failed to follow, overhead resistance was obvious, and the lack of buying support was glaring. Following the bullish signal, I called a short, entering around 0.015588, thinking I would just take a small bite.

Instead, it went all the way down to 0.007219, and the +1058
post-image
HEMI+6.29%
ADA-1.71%
ZEC-10.57%
Layout for Bitcoin, Ethereum, and Dogecoin
live-cover
LIVE1,432
Damn, I really cooked
post-image
By the time I got back from a quick bathroom break, the candlestick chart had already wiped out my losses for me. A few days ago, I checked $JCT before bed. The rebound lacked volume, and every push upward fell just short—this wasn’t a breakout, but a bull trap. The level I gave was around 0.002429, and this was exactly the downward move I was waiting for.

The current price has already dropped to 0.001445, sending my unrealized profit straight to +990.36%. I’ve taken 80% profit off the table, moved the stop-loss on the remaining 20% to breakeven, and will keep holding if it continues to fall
post-image
JCT-6.92%
XRP-2.78%
BNB-0.90%
Gate Enters the CEX Top 4! How Much Weight Does Its 60 Million Users Carry?
If an exchange surpasses 60 million users and enters the mainstream CEX Top 4, how would you view it?
I believe this at least shows that Gate has gradually grown from a simple trading platform into an important asset and trading gateway for crypto users worldwide.
For CEXs, user scale is extremely important. The more users there are, the richer the trading demand, and the easier it is for product iteration to create a positive feedback loop. Of course, user numbers are not the only metric, but they can reflect a platfo
MEME-1.92%
RWA-1.86%
  • 39
Insiders are watching $HYPE /USDT like a hawk right now.

$HYPE /USDT - LONG

Trade Plan:
Entry: 80.069 – 80.673
SL: 76.600
TP1: 83.199
TP2: 85.085
TP3: 87.914

Why this setup?
Why now? The daily trend is bullish, giving the 1h price of 80.371 a clear upward backdrop. The 15m RSI sits at 37.31, showing the asset is not overbought and has room to run before exhaustion. The 1h ATR of 1.208753 tells us volatility is active enough to push toward the first target of 83.199 and the second target of 85.085. The entry zone between 80.069 and 80.673 offers a defined risk window, and the invalidation
HYPE-3.92%
Nobody is talking about the SYMBOL setup hiding inside a daily range right now.

$SOL /USDT - SHORT

Trade Plan:
Entry: 99.76 – 100.30
SL: 102.57
TP1: 98.12
TP2: 96.85
TP3: 94.94

Why this setup?
Why now? The 1h price is pinned at 100.03 inside a tight range, and the 15m RSI has dropped to 39.62, signaling weak momentum before a potential breakdown. The 1h ATR sits at 1.06038, which means the average hourly move is small enough that a breach of the entry zone between 99.76 and 100.30 could accelerate quickly. The daily trend is range-bound, so the bias favors fading any push toward the uppe
SOL-1.60%
Intraday, XAU rebounded again to around 4438 before coming under pressure, then fluctuated lower all the way, reaching a low of 4319 in the early morning. We called for shorts around 4330 and once again secured 120 points of downside, with prices currently fluctuating at low levels!
From the current chart, the daily timeframe shows a surge followed by a retreat, with the price falling below support at the Bollinger middle band, which has turned into a strong resistance level. Bearish momentum continues to exert downward pressure, weakening the broader trend.
On the 4-hour timeframe, the price
post-image
XAU-1.78%
XRP is about to expose the weak hands hiding at 1.35

$XRP /USDT - LONG

Trade Plan:
Entry: 1.3493 – 1.3557
SL: 1.3120
TP1: 1.3829
TP2: 1.4031
TP3: 1.4335

Why this setup?
Why now? The 1h price is pinned at 1.3525 inside a tight range, and the 15m RSI has cratered to 26.19, signaling extreme oversold exhaustion that often precedes sharp reversals. The 1h ATR of 0.012975 shows volatility is compressed, meaning a single catalyst can explode the range violently. The entry zone sits between 1.3493 and 1.3557, giving precise risk control for a long positioned at 1.3525. The first target of 1.382
XRP-2.78%
I had just switched the software to the background when it suddenly plunged—are you playing hide-and-seek with me? The last time I checked a few days ago, $CYS was at 0.4520, facing heavy resistance above, with clearly insufficient buying support.

My message at the time was simple: bullish, but the rebound was weak—don't become exit liquidity. Those who listened should understand.

Now at 0.1399, with +1358.25% secured, getting the timing right is really that simple. Time to enjoy a good meal.

Take 70% off the table first, and move the protective stop on the remaining 30% to the entry pri
post-image
CYS-1.83%
XRP-2.78%
ZEC-10.57%
Load More

Join 40 M users in our growing community

⚡️ Join 40 M users in the crypto craze discussion

💬 Engage with your favorite top creators

👍 See what interests you