Share your thoughts
placeholder
Article
Everyone’s eyeing BNB at 750—but the 4h chart is silently screaming “trap” while the daily range holds its breath.

$BNB /USDT - SHORT

Trade Plan:
Entry: 749.30 – 751.40
SL: 760.45
TP1: 742.77
TP2: 737.72
TP3: 730.14

Why this setup?
- Price is pinned at 750.35 with a 1D range, yet the SHORT bias (conf 55) targets a clean drop to 742.77 first.
- RSI on the 15m is only 56.1—no overheated bounce fuel, while ATR (4.2) shows volatility is compressed, priming a snap.
- Why now? The “waiting” status means the entry zone (749.30–751.40) is the exact battlefield; a rejection here flips momentu
BNB-1.65%
#GateEventContractTradeSharingChallenge
🎯 WHAT IF TRADING WASN’T ONLY ABOUT PRICE?
Crypto trading has always been about trying to understand what comes next.
Will Bitcoin break higher?
Will Ethereum hold its momentum?
Can Solana continue outperforming?
Will a major event push the market in one direction?
These questions are at the center of every trader’s decision.
Now, Gate is giving users another way to express those market expectations through its Event Contract Trading & Sharing Challenge, which is currently live through September 10.
What makes this campaign different is that it combine
BTC+0.50%
ETH+1.33%
SOL+3.11%
GT-1.61%
ZEC+20.15%
Financial News, Crypto Updates, Real-World Strategies
live-cover
LIVE1,454
Gold Pulls Back to Build Momentum, Awaiting a Breakout Amid Rate-Hike Expectations
The four-hour chart shows that gold prices pulled back after touching a high of $4,696 and are currently trading near the middle Bollinger Band. The RSI is in neutral territory, indicating that buying and selling forces are temporarily balanced, with the short-term direction awaiting breakout confirmation.
At the news level, the market is closely focused on the Federal Reserve’s September interest-rate decision, with expectations of whether to raise rates repeatedly shifting. Various U.S. economic data continue
post-image
XAU-0.14%
This return has me feeling nervous, worried the market might come to its senses tomorrow and blacklist me.
With the screen glowing green, $SNXX consolidated around 13.489. No matter how I looked at it, it seemed ready to break down. But I noticed that every dip was met with buyers, while volume was quietly cooperating; it was moving sideways at the bottom without breaking down—this structure wasn’t bearish, so I should be watching for longs instead. Once the market stabilized a little, I opened a long.
I didn’t expect it to surge straight to the current 18.223, with unrealized gains of +1693.
post-image
SNXX+1.85%
ETH+1.32%
LAB-3.68%
Most traders missed NEAR's 84% short signal because the 1D trend screamed bullish.

$NEAR /USDT - SHORT

Trade Plan:
Entry: 2.4312 – 2.4610
SL: 2.6323
TP1: 2.3065
TP2: 2.2134
TP3: 2.0737

Why this setup?
- The 4h timeframe is flipping bearish against the daily uptrend—this is the classic “bull trap” setup.
- RSI 15m at 55 shows weak momentum, not enough fuel to break 2.4610 resistance.
- Entry zone 2.4461 with TP1 at 2.3065 gives a 5.7% move before the daily trend reasserts.
- ATR 1h (0.0597) means volatility is compressed—breakouts are violent. Why now? Price is stalling under supply
NEAR+11.60%
Everyone’s staring at TRUMP’s 2.322—but the 4h chart is quietly building a trapdoor.

$TRUMP /USDT - SHORT

Trade Plan:
Entry: 2.315 – 2.329
SL: 2.388
TP1: 2.272
TP2: 2.239
TP3: 2.190

Why this setup?
Why now?
- 1D range + 4h SHORT bias = mean reversion, not breakout.
- RSI 15m at 50.82 = no momentum fuel; price is stalling mid-range.
- ATR 1h (0.0275) shows thin volatility—easy to slap down to TP1 (2.272) before news hits.
- Entry 2.322 with SL 2.388 gives you a 2.8:1 reward-to-risk if TP2 (2.239) prints.
- Confidence 55% isn’t screaming, but the range’s lower half is the path of
TRUMP-1.44%
$DOOD Signal】Long setup: 1H spike and pullback stabilization, 4H bullish expansion
$DOOD The 1H rally to 0.002001 encountered selling pressure, then quickly recovered after dipping to 0.001724; the current price is 0.001861. RSI is showing high-level stagnation at 84.48 on 4H, while remaining strong at 70.76 on 1H. Sell-side depth has a slight edge, MACD shows bullish expansion on 4H, and the 1H histogram is shortening, indicating short-term turnover consolidation.
🎯Direction: Long
⚡Entry/Limit order: 0.00185542 - 0.00186100 (snipe directly near the current price)
🛑Stop-loss: 0.00184239
🚀T
post-image
DOOD+29.89%
BTC+0.50%
ETH+1.33%
SOL+3.11%
#USELESSSurgesAnother67% USELESS Surges Another 67%
USELESS Surges Another 67% — Momentum Takes Center Stage
The crypto market has once again reminded traders that momentum can appear when least expected. USELESSSurgesAnother67 has become a headline-grabbing move, with the token recording another 67% surge and attracting fresh attention from traders and the wider crypto community.
A move of this magnitude naturally raises an important question:
What is driving the momentum, and can it continue?
Momentum Is Back in Focus
A sharp price increase can bring a wave of new market participants. Tra
post-image
USELESS-17.18%
I originally wanted to cut my losses and sacrifice the flesh to heaven, but heaven never got its offering—the meat roasted itself. A few days ago, I was still staring at the chart before bed, worried and thinking this move was completely over, but in the middle of the night $ZEC gave the answer directly.
During the bottoming phase, I said that once the pullback held, buying pressure was quietly strengthening, so don’t let intraday decoys trick you into selling. Those who got in around 610.37 are now looking at a price of 1219.29, up +7085.23%—that’s a satisfying piece of meat, right? The key
post-image
ZEC+20.11%
XRP+0.60%
BTC+0.51%
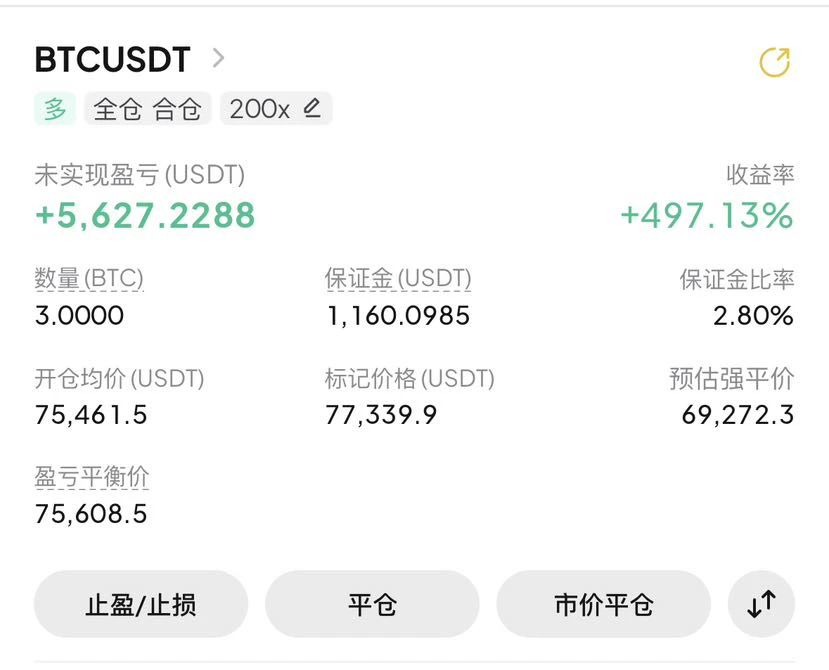
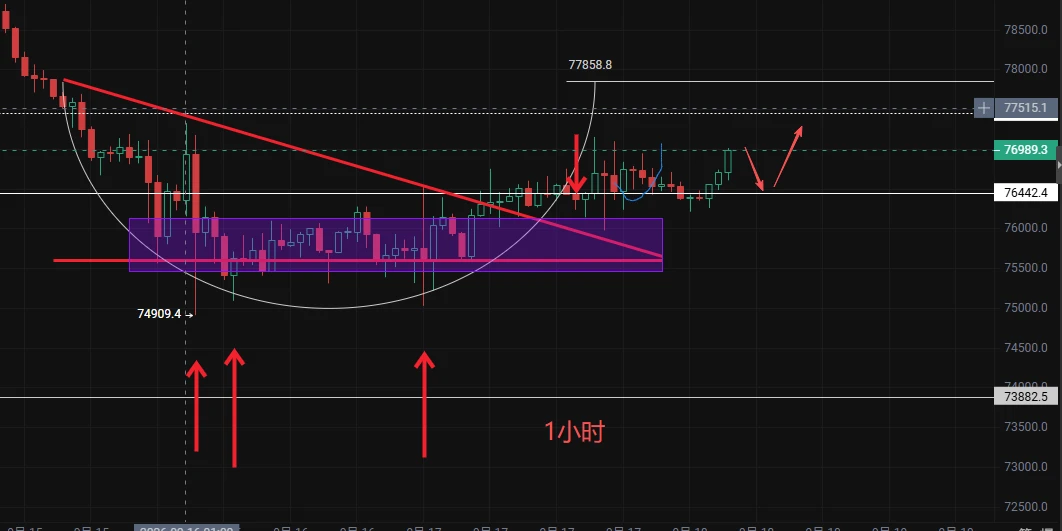
I just took profit on my long position, so I’m reviewing it while the memory is still fresh. The market was moving sideways at the time, with the moving averages on the hourly chart converging, volatility narrowing further, and the chips clearly being compressed. I judged that the direction would most likely break upward, so I first positioned part of my long near the lower boundary of the range.

The move started a little later than I expected, with even several false dips in between. However, none of the dips broke down the range structure, and the key levels were actually moving higher. Th
post-image
ZEC+20.11%
BNB-1.65%
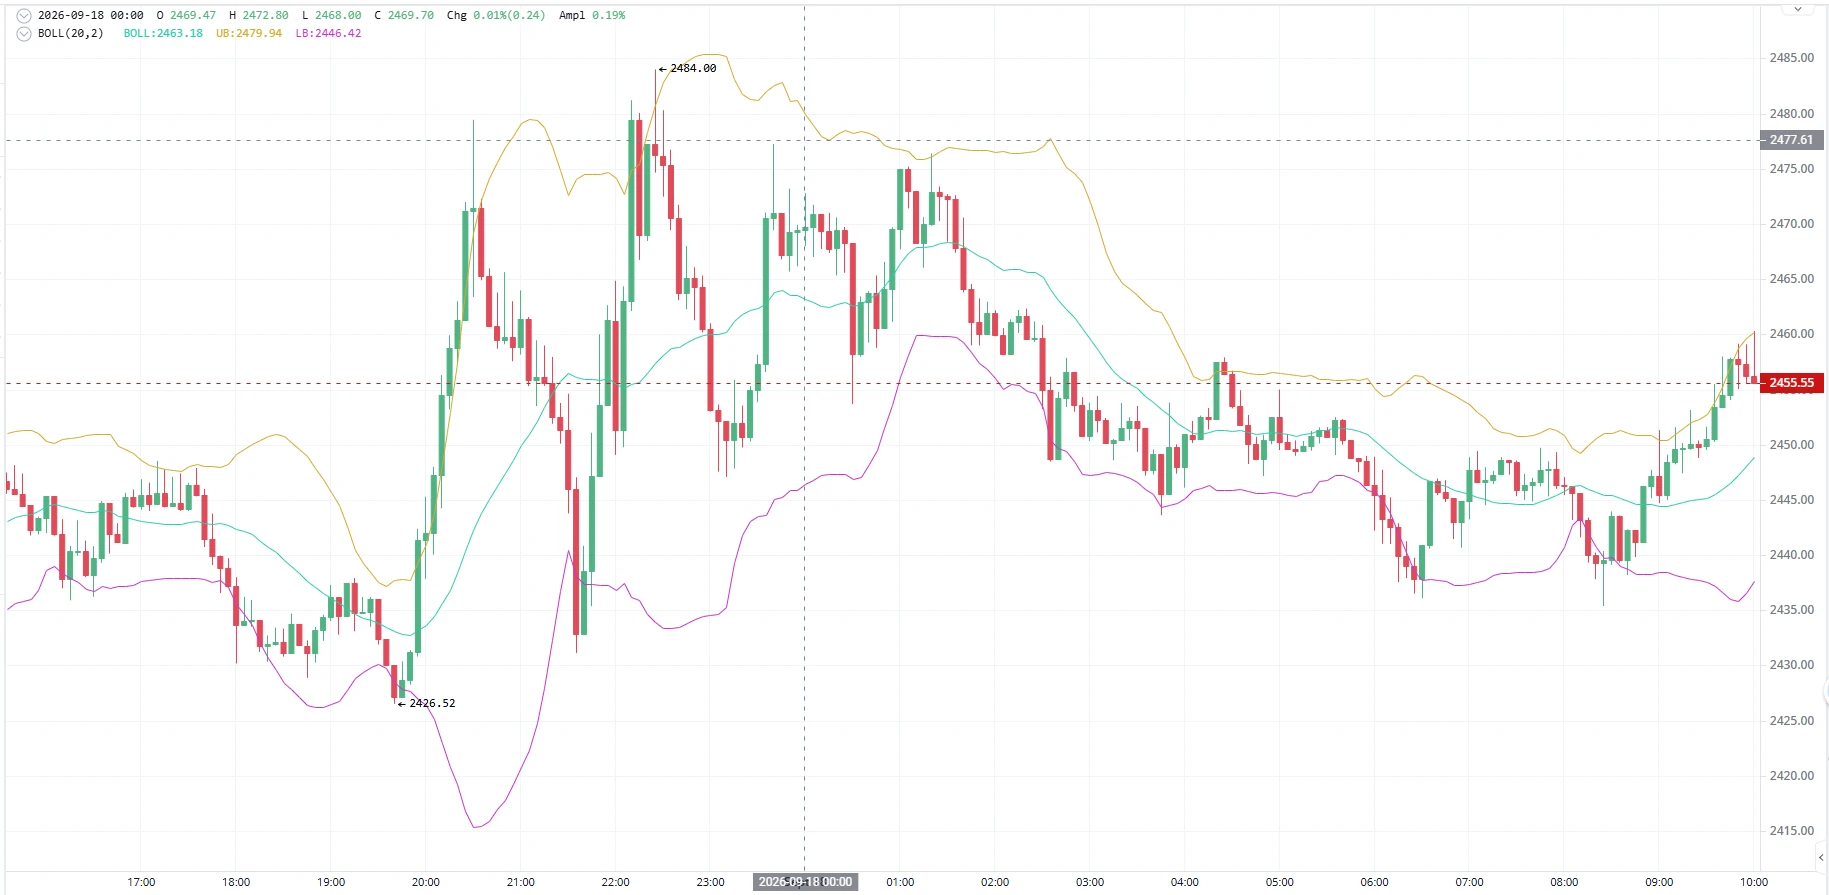
$ETH Signal】1H pullback long + 4H momentum support
$ETH Order-book sell pressure skewed -57.52%, yet the price is pinned at 2496.32. The 1H EMA20 at 2492.43 provides short-term support, while the 4H MACD histogram is expanding at 1.64, with the broader trend intact. The 1H MACD histogram is contracting at -0.32, indicating a short-term pullback.
🎯Direction: Long
⚡Entry/Limit order: 2489.64-2496.32
🛑Stop-loss: 2462.92
🚀Target 1: 2546.41
🚀Target 2: 2571.46
🛡️Trade management:
- Execution strategy: After reaching Target 1, reduce the position by 50% and move the stop-loss up to breakeven. I
post-image
ETH+1.32%
BTC+0.50%
SOL+3.11%
$JASMY held the horizontal support + the 50 daily moving average like a pro.
I can’t wait for tomorrow to explain how bullish this is 😊📈🚀
post-image
JASMY+0.36%
Rewards are being distributed! Open your mystery box now and win up to 100 USDT worth of tokens! https://www.gate.com/referral/earn-together/invite/UFRFAQ0M?ref=UFRFAQ0M&ref_type=103&utm_cmp=rXJBDjtJ&activity_id=1788357807948
post-image
  • 2
Everyone’s long BULLA—but the 4h tape is quietly screaming for a 25% flush.

$BULLA /USDT - SHORT

Trade Plan:
Entry: 0.074149 – 0.077421
SL: 0.091493
TP1: 0.064004
TP2: 0.056150
TP3: 0.044369

Why this setup?
- 1D trend is **range**, not uptrend—so longs are fighting gravity.
- SHORT bias at 55% while RSI (15m) sits at 51.96—no oversold bounce fuel left.
- Entry ref 0.075785 with TP1 at 0.064 (-15%) and TP2 at 0.056 (-26%).
- ATR (1h) is tight (0.0065)—breakout below 0.074149 could trigger a fast cascade.
- Why now? Price is stalling inside a weak range with shorts stacked above—wa
BULLA-10.34%
I originally just wanted to freeload a breakfast, but the market ended up making me eat dumplings for half a year🥟. A few days ago at dawn, $SNDK /SNDK was still grinding around that level, but buying pressure was quietly strengthening, so I opened a long position and went in directly without hesitation.

Now the bullish thesis has played out crystal clear. The price went from 1586.74 all the way to 1785.04, netting +887.24%. Feeling good, brothers—the harder it grinds beforehand, the more satisfying the breakout.

Take off 75% first, and place the remaining 20% above 1586.74 to protect the
post-image
SNDK+0.79%
LAB-3.68%
ETH+1.32%
This $ETH trade was handled relatively steadily, using a strategy of taking profits in batches. The entry premise was simple: the higher timeframe was still in a bullish structure, while the lower timeframe was merely undergoing a rapid shakeout, trapping those who chased shorts before quickly recovering. I judged this to be a shakeout rather than a reversal, so I opened a long position at a key panic level. After the market confirmed the move, I did not rush to exit everything, but first took profits on 80% to lock in the existing unrealized gains, while using a protective level to trail the
post-image
ETH+1.32%
BTC+0.51%
ZEC+20.11%
Everyone’s staring at DASH at 71.41—but the range just whispered a secret the bulls missed.

$DASH /USDT - SHORT

Trade Plan:
Entry: 70.72 – 72.10
SL: 77.99
TP1: 66.48
TP2: 63.19
TP3: 58.26

Why this setup?
Why now? The 1D trend is *range*, not breakout—so we’re playing mean reversion, not momentum.
- 4h bias: SHORT (Conf 55.4) with entry zone 70.72–72.10.
- RSI 15m at 57.38 shows a weak bounce—no fuel for a push above 72.10.
- ATR 1h (2.74) says volatility is contracting—tight stops, fast move.
- Targets: TP1 66.48, TP2 63.19. Invalidation only if price closes above 55.29 (wait—tha
DASH+6.84%
A few days ago, my hand trembled as I set the stop-loss; this morning I realized that was unnecessary filial piety. During the repeated intraday swings, $MU /MU kept making scary fake drops, but it held firm after every pullback, so I went long with my eyes closed.
I checked the market this morning and saw that staying up late hadn't been in vain. With a cost basis of 946.09, it's now at 1020.44, +558.01%. This move climbed up step by step from the bottom—solid and reassuring.
I’ve pocketed 80%, and raised the protection on the remaining 20%. Let the remaining profits run; even if it turns bad,
post-image
MU+0.45%
BNB-1.65%
SOL+3.10%
Load More

Join 40 M users in our growing community

⚡️ Join 40 M users in the crypto craze discussion

💬 Engage with your favorite top creators

👍 See what interests you

View More