Share your thoughts
placeholder
Article
$LAPTOP ​📉 $LAPTOP Undergoing a Sharp Correction!
​Hunter Biden's Laptop ($LAPTOP) futures traded on Gate.io experienced a sharp 43.52% pullback over the last 24 hours.
​Current Price: $0.353
​24h High: $0.630
​24h Low: $0.326
​24h Volume: 3.82M USDT
​On the 15-minute chart, a downtrend prevailed after the 0.517 peak, and there is currently consolidation near the 0.326 low. Holding the 0.326 support is critical for a rebound! 📊
#LAPTOP #Crypto #MemeCoin #Gateio
post-image
LAPTOP-40.55%
Looks like it’s time to return the computer. This Golden Dog was 200u when it first launched, but it has now surged to 600 dollars. It would take me 5 days to mine it.
Mining:
Market:
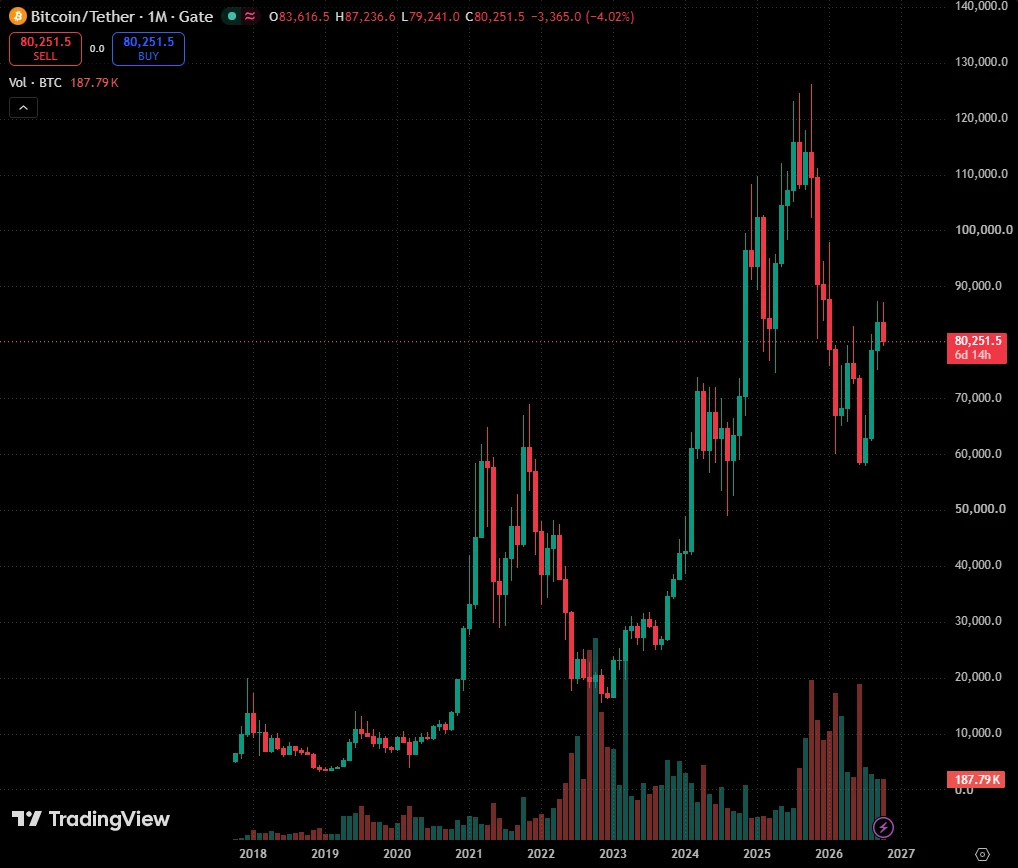
$BTC Bitcoin's sister-in-law has led the bros to profits😀
#8月核心CPI超预期
BTC+0.14%
I would expect something liken this for $ETH .
Everyone losing their minds over inflation, hikes, OIL, war, clarity...
It doesn't matter bros.
The chart is telling you how all of that news is being interpreted.
Crypto is back in a bull market, that's it.
We're gonna get chop, we're gonna get swings...
But the regime has changed and higher is now the play.
Don't get shaken out.
post-image
ETH+2.94%
#GateMeme
The Market Has Its Own Sense of Humor 😂
Crypto has a special way of reminding us that the market does not always follow the plan we made five minutes ago.
You open Gate with a simple idea: check the market, look at the charts, understand what is moving, and maybe discover something interesting.
Then BTC starts moving up. 📈
You get excited.
You check your favorite coin.
It starts moving down. 📉
You refresh the chart.
Still down.
You check again.
Somehow, another coin is pumping instead. 😂
That is crypto in one picture.
The funny part is that every trader and crypto enthusiast has
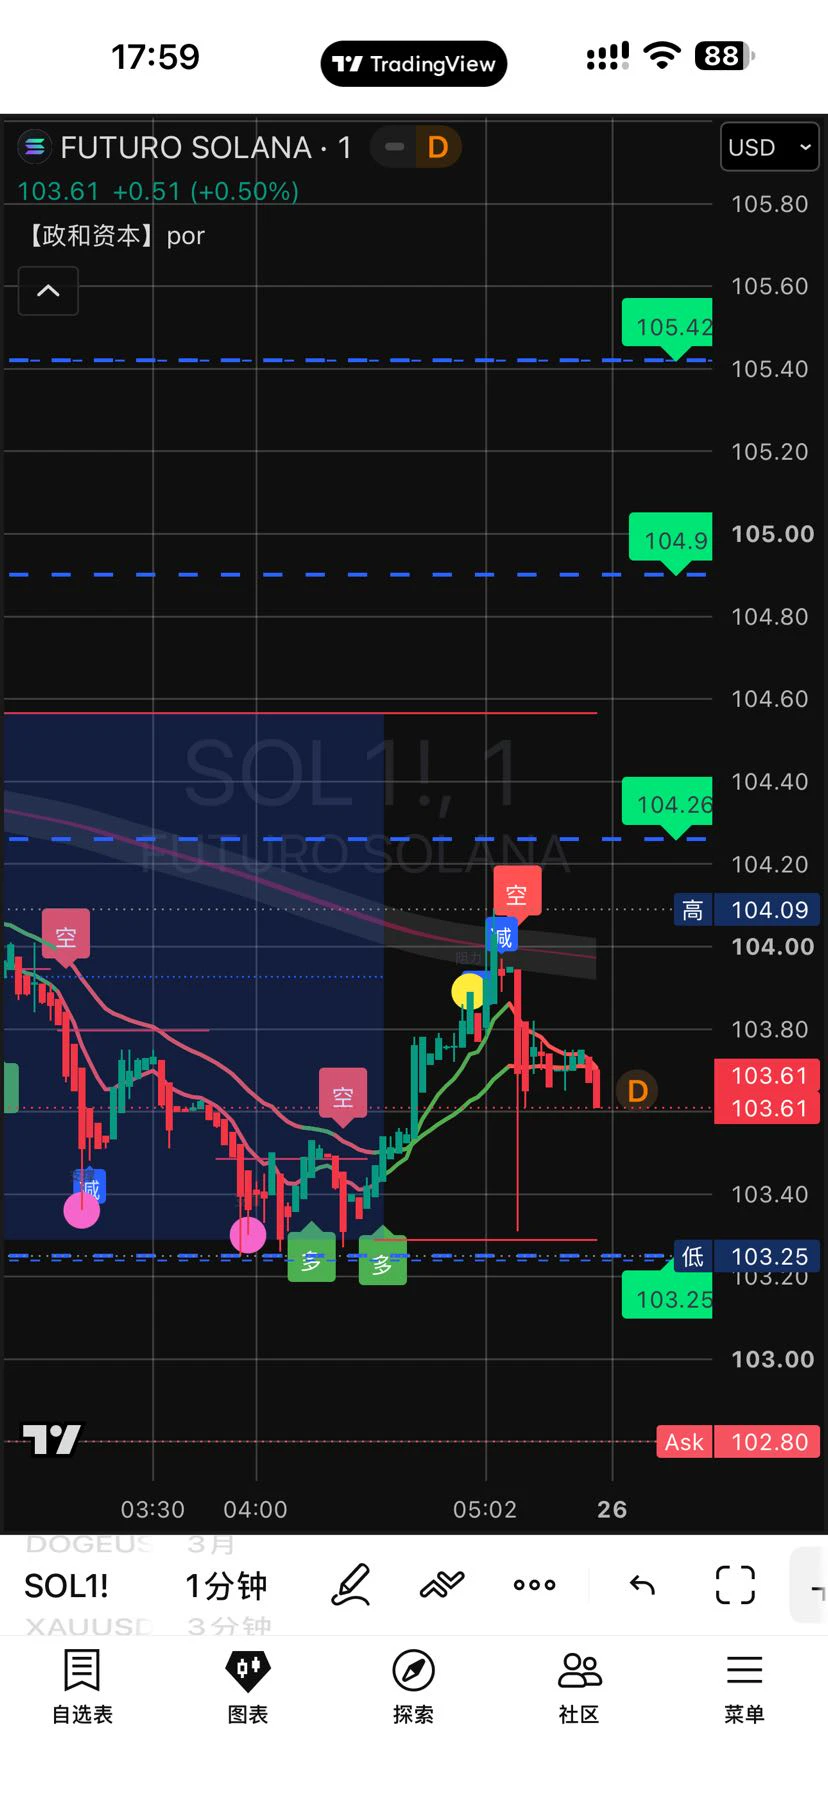
I just sent the app to the background, and it started dumping on its own—is this playing hide-and-seek with me?

First, let me report the results: $DOGE short position, entered at 0.08597, now at 0.08444, a steady +126.27%.

With the screen glowing green, plenty of people were still trying to catch the bounce. I watched the chart for ages—every push upward fell just short, while sell orders kept pressing down wave after wave. With this structure, if you don't short this, what would you short?

Panic comes from having no plan; losses come from overthinking.

Position management is the same
post-image
DOGE+0.18%
BTC+0.14%
SOL+2.61%
Everyone's sleeping on this SHORT setup while SYMBOL sits trapped in a range.

$LTC /USDT - SHORT

Trade Plan:
Entry: 53.43 – 53.75
SL: 55.12
TP1: 52.45
TP2: 51.68
TP3: 50.54

Why this setup?


Debate:
Are we getting a clean move to TP2 or will the range trap the shorts first?

⚠️ Personal market analysis only. NFA — manage risk and DYOR.
Educational content, not investment advice or a recommendation to buy, sell, deposit, or withdraw any asset. No paid promotion or referral/affiliate links.
LTC+1.79%
$LTC /USDT is quietly setting up for a move most traders will miss.

$LTC /USDT - SHORT

Trade Plan:
Entry: 53.22 – 53.52
SL: 54.85
TP1: 52.26
TP2: 51.52
TP3: 50.40

Why this setup?
Why now? The 1h price sits at 53.37, right inside a tight entry zone between 53.22 and 53.52, which gives us a precise reference point for a short bias. The daily trend is range-bound, meaning momentum is coiled and a directional break is overdue, and the 4h higher-timeframe trend reinforces this compression. The 15m RSI at 47.62 shows neither overbought nor oversold conditions, suggesting room to fall before ex
LTC+1.79%
Why is everyone sleeping on this range-bound setup that could explode overnight?

$SPCX /USDT - SHORT

Trade Plan:
Entry: 150.50 – 151.20
SL: 154.25
TP1: 148.30
TP2: 146.60
TP3: 144.06

Why this setup?
Why now? The daily trend is range, which means the market is coiling and ready to snap. The 1h price sits at 150.85, right on the entry_ref level, giving us a precise trigger. The 15m RSI reading of 61.44 shows momentum is neutral but leaning bullish, so a short entry at 150.50 to 151.20 catches the bounce. The 1h ATR of 1.415337 tells us the average hourly move is about 1.4, so targeting TP1
SPCX+1.89%
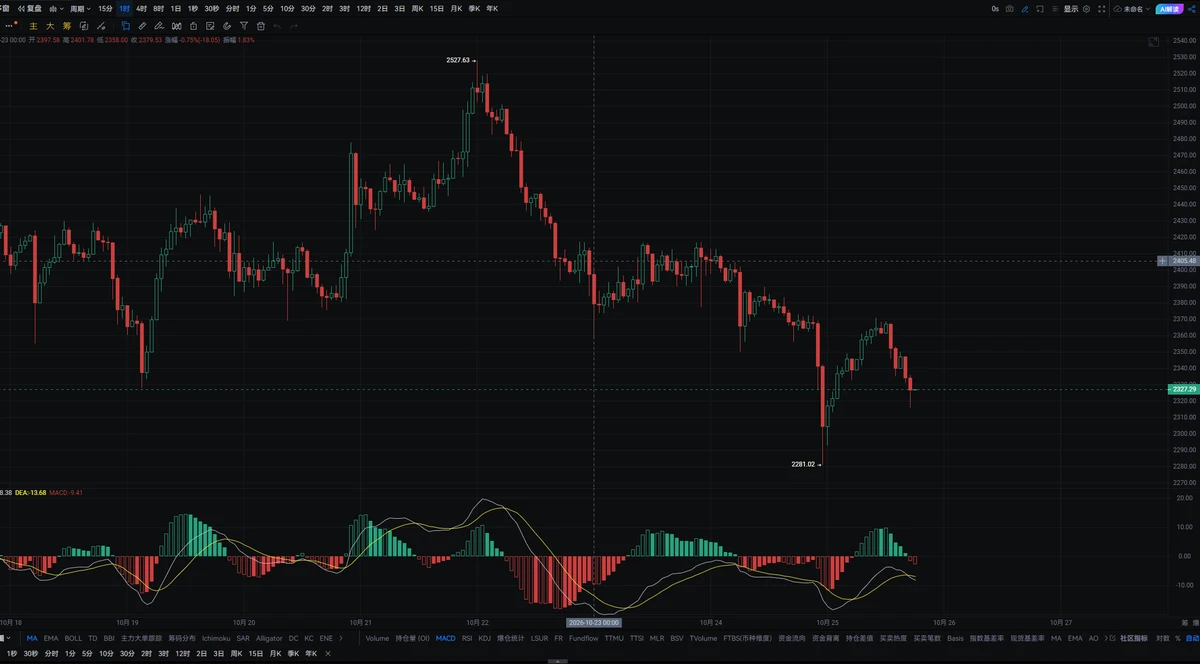
$ETH looks ready for the next leg up
post-image
ETH+2.94%
  • 1
#ShareWeekly
XRP/USDT is trading near $1.35–$1.39, consolidating directly around its 200-day Exponential Moving Average (EMA) near $1.355. Following an August expansion toward the $1.45 region, short-term momentum has decelerated into a range-bound structure as traders de risk ahead of key macroeconomic events, including the mid September FOMC decision.
Derivatives open interest currently sits near 2.17 billion XRP, indicating a decline in speculative leverage that reduces short-term cascade risks while market participants wait for a directional trigger.
Key Technical Levels
The 14-day Re
post-image
XRP+0.34%
  • 3
  • 1
$IOST dropped from 0.0011 to 0.0009, and the little profit in my account evaporated by 40% in three days. Honestly, this feeling is all too familiar—the same “it won’t fall much further” illusion buried me last year.
But today I’m not talking about emotions, only the data. A 24h trading volume of 159.9M is unusual for an old coin whose market cap ranking has fallen outside the top 200. A normal gradual decline wouldn’t bring such heavy turnover, which means someone is buying—and buying aggressively. The 0.0009 level happens to be the neckline of the rally that started last November. Breaking
IOST-12.15%
$MET Signal】Long | Buy the 1H pullback, target the 4H upper band
$MET 4H Bollinger upper band resistance at 0.2738, 1H RSI 65.20, order book depth imbalance -8.32%.
Current price 0.2687 is near-term support, 4H MACD red bars narrowing, 1H MACD also contracting. Bid/Ask 0.85, with sell orders slightly heavier. The risk/reward for this pending order is acceptable, but there is limited room to chase at the current price.
🎯Direction: Long
⚡Entry/Pending order: 0.267894 - 0.268700
🛑Stop-loss: 0.266013
🚀Target 1: 0.272730
🚀Target 2: 0.274746
🛡️Trade management:
- Execution strategy: After reac
post-image
MET+15.10%
This return makes me nervous, and I’m worried the market will come to its senses tomorrow and blacklist me. During the repeated intraday swings, $XAU /XAU hit a wall every time it tried to push higher. The resistance above was obvious—there was simply no one buying up there, and volume kept shrinking. I deliberately waited for two candlesticks to confirm it couldn’t break through before trying a short position around 4510.00.
Now it’s at 4357.68, with floating profit at +313.79%. It feels great—after grinding for so long, these few candlesticks made it all back.
I’ve taken the profit first and
post-image
XAU+0.68%
DOGE+0.18%
SNDK-3.32%
$SAGA This 14-point bearish candle was created with my own real money.
Yesterday at 0.0186, I cleared half my position and bought it back at 0.0160 today. This isn’t hindsight—the market signals had been obvious three days ago: it failed to break through around 0.019 four times in a row, while volume shrank below 80M, a classic sign of market makers trading among themselves to distribute. Look at the 24h trading volume of 53.2M, nearly 40% below the peak. Retail investors were still dreaming of a breakout, so I locked in my profits first.
Here’s the trading strategy: First, push up the price t
SAGA-14.31%
Layout for Bitcoin, Ethereum, and Dogecoin
live-cover
LIVE1,703
Dim777 & BTC & LTC & GT
👜European banking giant UniCredit is preparing to enter crypto — the bank is selecting infrastructure for the custody and trading of digital assets
Stablecoins and tokenized bonds are also in the plans, but the project is still at an early stage.
post-image
Dim777
Dim777Dimzon777
Gate.Fun
MC:$70.49KHolders:8
100%
BTC+0.15%
LTC+1.79%
GT+0.63%
Why is everyone suddenly looking to sell $ADA /USDT right now?

$ADA /USDT - SHORT

Trade Plan:
Entry: 0.2057 – 0.2075
SL: 0.2156
TP1: 0.1998
TP2: 0.1953
TP3: 0.1885

Why this setup?
Why now? The 4h trend is range-bound and the 1h RSI sits at 45.83, suggesting the bounce is fading just as the 1h ATR of 0.003765 shows volatility compressing. The entry zone between 0.2057 and 0.2075 aligns with the current 1h price of 0.2066, giving a clean short setup with defined targets at 0.1998 and 0.1953. The 1D range means the move is not yet confirmed as a breakdown, so the invalidation level of 0.215
ADA-1.53%
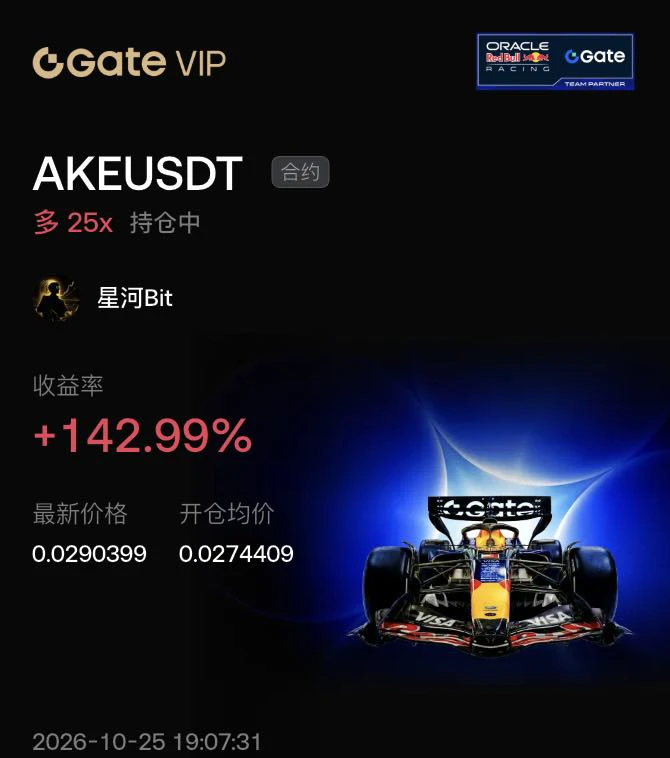
I had just switched the app to the background, and it suddenly dropped—are you playing hide-and-seek with me? This morning, when I opened the chart, $TOSHI was clearly under pressure at the highs, with insufficient buying support; the overhead pressure was suffocating. I said then to stay bullish and look for shorts at high levels—the timing was spot-on.

Hold as long as the trend remains intact; run if it breaks down. Don't fall in love with a stock.

From 0.0001166 to 0.0001131, the short position wasn't held in vain: +144.55%. That feels amazing. It dragged its feet at first, but the mov
post-image
TOSHI+0.62%
ETH+2.90%
XRP+0.32%
Load More

Join 40 M users in our growing community

⚡️ Join 40 M users in the crypto craze discussion

💬 Engage with your favorite top creators

👍 See what interests you

View More