



Share your thoughts
placeholder
Article
No action, no analysis, just pure luck—this result is embarrassing even to talk about. A few days ago, I took one last look before bed and saw $ETH consolidating at the bottom around 2086.30. It had been grinding sideways for several days without breaking down, so I thought, wasn’t this the perfect time to pick up a bargain? I opened a long and placed the order. When I opened the chart in the morning, it was at 2453.28, up +3057.29%—that was a satisfying chunk of profit. Staying out of the market isn’t a sin; opening positions recklessly is. I took profit on 80% of the position first, and mov
post-image
ETH-1.97%
BTC-1.89%
SOL-2.35%
The biggest change at present is that BTC pulled back after rising back to around $82,000, while ETH failed to break above its previous high, indicating that ETH's short-term strength relative to BTC remains insufficient. On September 4, U.S. nonfarm payrolls added 162,000 jobs in August, significantly above expectations, while the unemployment rate was 4.1%; the strong employment data led the market to raise expectations for a September rate hike again, and the 2-year U.S. Treasury yield briefly rose to 4.38%.
Therefore, my current assessment of ETH is:
Short term: Range-bound with a bearish
BTC-1.86%
ETH-1.93%
This profit has me feeling apprehensive and nervous, afraid the market will come to its senses tomorrow and blacklist me. When the entire screen was glowing green, I was thinking: when others are fearful, I am greedy—this isn’t something I’m saying casually. The price had moved sideways at the bottom for a long time, volume had contracted to an extreme, and sell-side pressure had clearly dried up. How much lower can it go from a level like this? I went long directly, with an entry price of 140.56. The current price is 147.77, with a return of +475.83%—that says it all, brothers. Don’t let prof
post-image
LAB-0.12%
ADA-4.93%
Something about $link that brings back good memories of 2020..
Anyway its leaving the accumulation zone..
post-image
This is a support level for $CATE on a high timeframe. I don't think the price will spend much time here, as it showed strength during this pullback
post-image
CATE-11.75%
USELESS TROLL PUMPING
$TROLL will follow $USELESS
The only 2 memes I'm gambling on right now. Been sharing double bottom entries with the subscribers.
USELESS at $0.34-0.4
TROLL at $0.015 and the higher low $0.04
Not financial advice
Meme coins are high risk gambles
USELESS+30.86%
TROLL+38.12%
MEME+1.87%
Financial News, Crypto Market Updates, Real Trading Strategies
live-cover
LIVE1,213
When I was checking the charts after lunch, the price action felt off. When $CTR plunged in the morning session, I stared at the chart for a long while—the buying support was too weak. Every rebound was just feeding fuel to the bears; not shorting this setup would have been doing myself a disservice.
And the result? The short entered at 0.02063 has now dropped to 0.00986, bringing in a juicy +1026.01% profit. It feels so good—the market practically insisted on feeding me, and I simply opened my mouth and took it.
Operationally, 70% of the position has already been taken in profit, while the st
post-image
CTR-2.67%
LAB-0.12%
DOGE-3.36%
$MEMECOIN bleeding
post-image
MEMECOIN-47.14%
$VELVET is mainly shorting; always shorting, making a killing—feels great.
post-image
VELVET-19.06%
Q Market Projection
A very good medium- to long-term buying opportunity will form before the end of October.
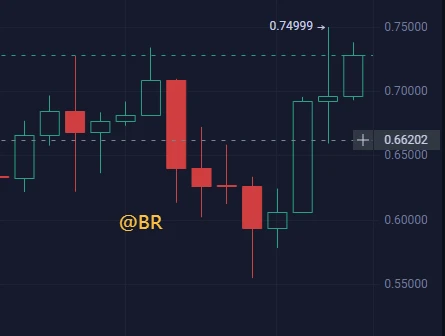
Figure 1 shows the trading range from October 2025 to March 2026.
Figure 2 shows the recent consolidation range.
The false breakdown and recovery on November 21, 2025, correspond to our false breakdown and recovery on July 29, 2026.
After moving sideways and consolidating for some time, the high of 748 above will most likely see a false breakout before falling back to the lower boundary of the range at 686, then rebounding to the range midpoint at 714. After fluctuating between 686 and
BTC-1.86%
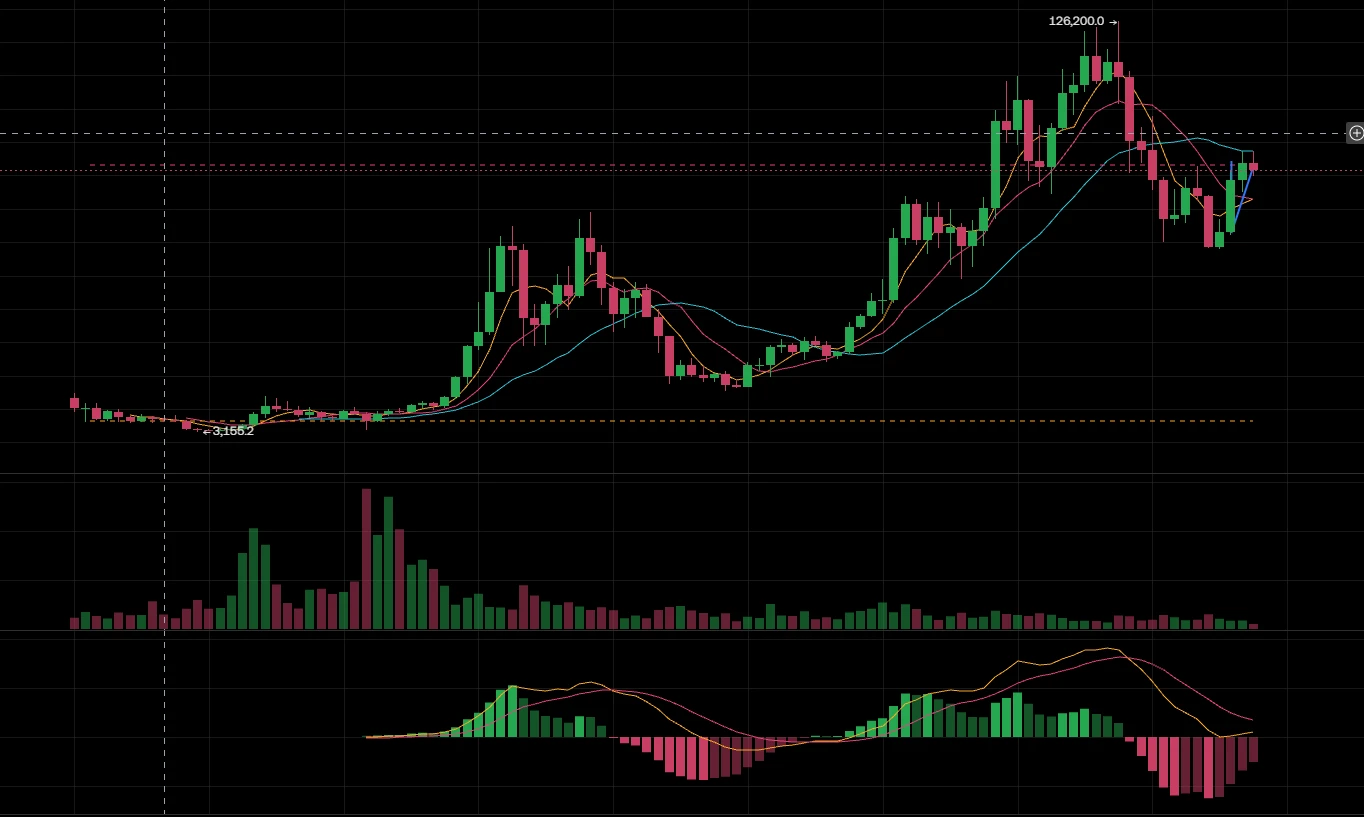
A deeper correction sub 58k would be a movie 🍿📺
$BTC
post-image
BTC-1.86%
  • 2
I’m watching $AAVE for a short here.
AAVE got rejected hard from the $136 area, and the 1H chart is now printing lower highs while price keeps slipping below $131. Sellers still look in control unless that level gets reclaimed.
Entry: $129.70–$130.30
Targets:
TP1: $128.60
TP2: $127.90
TP3: $126.20
Stop: $131.30
For me, $131 is the key level. As long as AAVE stays below it, I’m looking for continuation lower. A clean reclaim above $131.3 would invalidate the short idea.
#Gate60MillionUsers #BTCReclaims80K
post-image
AAVE-1.90%
( new streamer) market overview
live-cover
LIVE333
Just jumped in on this $HYPE long on the double bottom and bullish retest of the breakout.
Just running around town getting tings ready for the next job.
NFA, DYOR ⚠️
#HYPE #Crypto #Trading
post-image
HYPE-2.12%
I originally wanted to cut my losses as a sacrifice to the heavens, but the sacrifice never happened—the meat roasted itself. 🤯
While everyone else was running, I didn’t move. It formed a base without breaking down, volume shrank to the extreme, yet funds quietly entered. I’ve seen this setup far too many times—cutting losses would just be handing my chips to someone else.
When I checked the market after lunch, $BTC had already risen from 78263.6 to 79650.6, with +305.76% realized. Staying up was worth it—I really nailed this move.
As for the trade: take 75% off first, and move the stop-loss
post-image
BTC-1.89%
LAB-0.12%
ZEC+7.78%
Hello everyone, this is my account
This is also my
fundamental reason for leaving this world.
post-image
$FLOCK Signal】Long|4H MACD histogram expanding, momentum awaiting release
$FLOCK Order book depth imbalance -5.88%, selling pressure has a slight edge, current price 0.05125. The 4H MACD histogram at 0.0017 is expanding, while the 1H MACD histogram at 0.0008 is contracting. Funding rate 0.0050%, OI stable, with no obvious leverage buildup.
🎯 Direction: Long
⚡ Entry/limit order: 0.0510962 - 0.0512500
🛑 Stop-loss: 0.0486875
🚀 Target 1: 0.0550937
🚀 Target 2: 0.0570156
🛡️Trade management:
- Execution strategy: Reduce the position by 50% after reaching Target 1, and move the stop-loss up to
post-image
FLOCK+33.31%
BTC-1.86%
ETH-1.93%
SOL-2.34%
Everyone’s long NEAR because the daily is “bullish”—that’s exactly when the 4H trap snaps.

$NEAR /USDT - SHORT

Trade Plan:
Entry: 2.10 – 2.12
SL: 2.27
TP1: 1.99
TP2: 1.91
TP3: 1.79

Why this setup?
- RSI 15m is overheated at 68.87 while price hugs 2.11—a classic bull-trap micro-structure.
- My model flags 84% confidence for a SHORT against the 1D uptrend: mean-reversion plays on the 4H are brutal.
- ATR 1h (0.0516) shows room to bleed; first target 1.99 is only a 5.7% drop, but TP3 at 1.79 is a 15% vacuum if support cracks.
- Invalid below 1.95 means risk is defined—but the “waiting
NEAR+8.87%
$MARSCOIN Signal】Long — High funding rate + short squeeze brewing
$MARSCOIN Funding rate 0.0618%, with longs facing relatively high holding costs and a short-squeeze setup emerging. The 1H RSI is 64.42, while the MACD histogram has narrowed to 0.0025, indicating weakening momentum. The 4H Bollinger upper band is at 0.1998, leaving 7% room above.
🎯Direction: Long
⚡Entry/limit order: 0.1849136 - 0.1854700
🛑Stop-loss: 0.1833925
🚀Target 1: 0.1885863
🚀Target 2: 0.1901444
🛡️Trade management:
- Execution strategy: Reduce the position by 50% after reaching Target 1, and move the stop-loss up to
post-image
MARSCOIN+74.58%
BTC-1.86%
ETH-1.93%
SOL-2.34%
Load More

Join 40 M users in our growing community

⚡️ Join 40 M users in the crypto craze discussion

💬 Engage with your favorite top creators

👍 See what interests you

View More