
Square
Following
Hot
News
Notifications
Profile
Share your thoughts
placeholder
Article
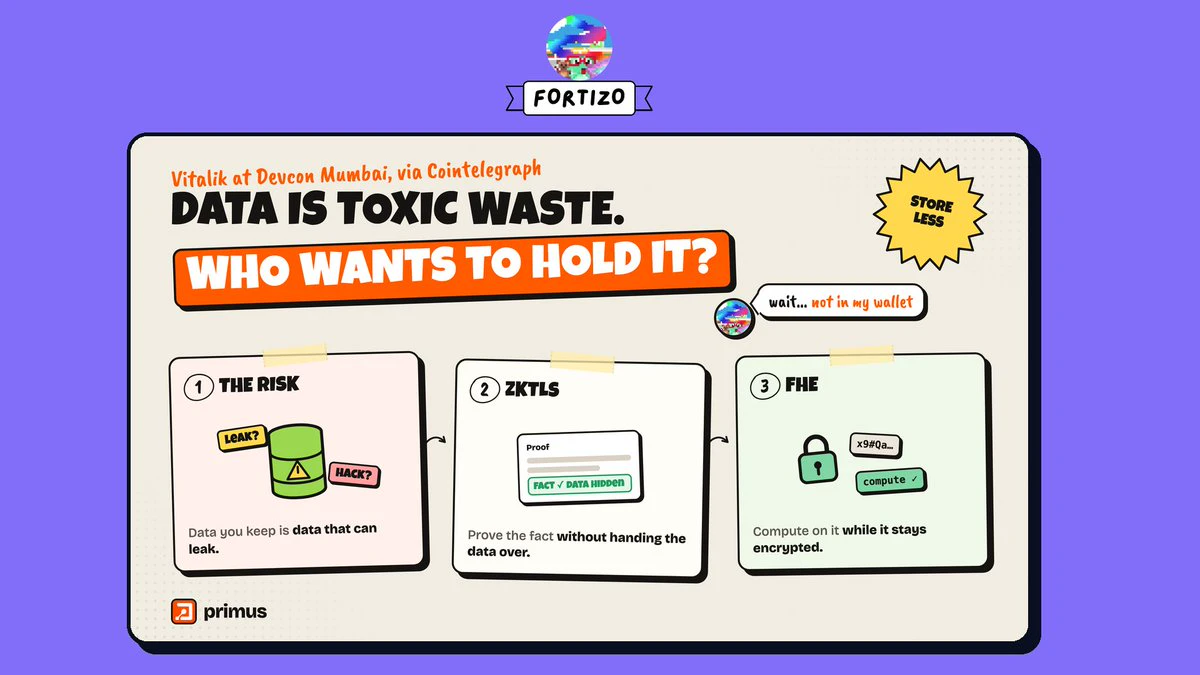
Vitalik says treat data as toxic waste. So who wants to hold it?
Institutions still have to prove things.
@primus_labs' answer: zkTLS proves the fact, FHE computes on it encrypted. Store less, expose less, still verify.
➙
post-image
FHE-3.50%
$BTC
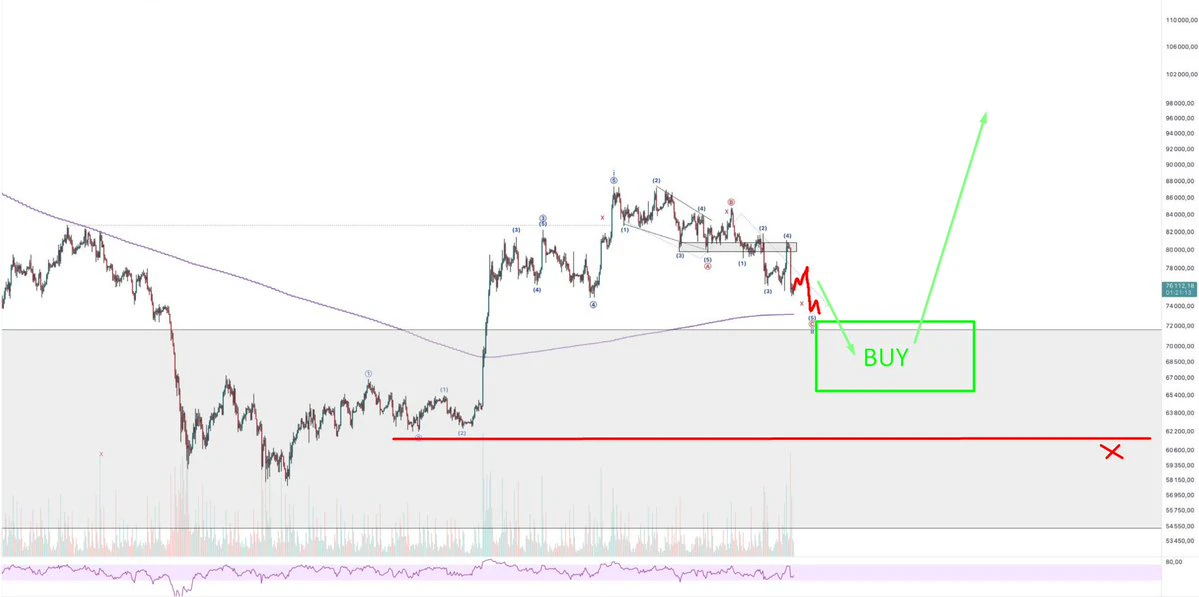
My mid-term setup for #BTC: still waiting for one more dip down into the target zone before looking for long entries.
Bullish setup is invalidated on a clean close below 62k
post-image
BTC-0.67%
  • 1
Trenches
ZIG
Z
bade
b
ZIG
0x8c...1145
Market Cap
$.
Change
.
24h Vol
$.
Holders
.
BTC
B
bade
b
BTC
C5xp...pump
Market Cap
$.
Change
.
24h Vol
$.
Holders
.
STONK
S
bade
b
STONK
6GmA...UNgx
Market Cap
$.
Change
.
24h Vol
$.
Holders
.
José
J
bade
b
José
87CQ...1UJT
Market Cap
$.
Change
.
24h Vol
$.
Holders
.
IDOL
I
bade
b
IDOL
0x3b...ab07
Market Cap
$.
Change
.
24h Vol
$.
Holders
.
A bull market unfolds in three stages in chronological order, and the people fooling you are different at each stage. Stage 1: Recovery (the longest and most grueling). Prices move sideways near the lows for 3-6 months, with volatility narrowing until it drives you crazy. Every time the price rebounds to the same level, it gets slammed back down, forming a “ceiling.” Bad news comes out and prices no longer plunge—negative news losing its impact is the first real signal. On-chain: long-term holders start accumulating, and exchange balances slowly decline. This stage has no rush of excitement. M
post-image
BTC-0.65%
ETH-1.23%
BULLS ARE TRAPPED $XRP USDT SHORT SETUP IS READY TO GO

$XRP /USDT

Trade Direction: SHORT

Entry Range: 1.1612

Take-Profit Levels:
🔹 TP1: 1.1462
🔹 TP2: 1.1362
🔹 TP3: 1.1212

🛑 Stop-Loss: 1.1812

$XRP ‌
XRP-1.12%
OpenAI CFO: Data center investments will not change due to the midterm elections.
live-cover
LIVE41
Copy Trading Live Profit Show
live-cover
LIVE32
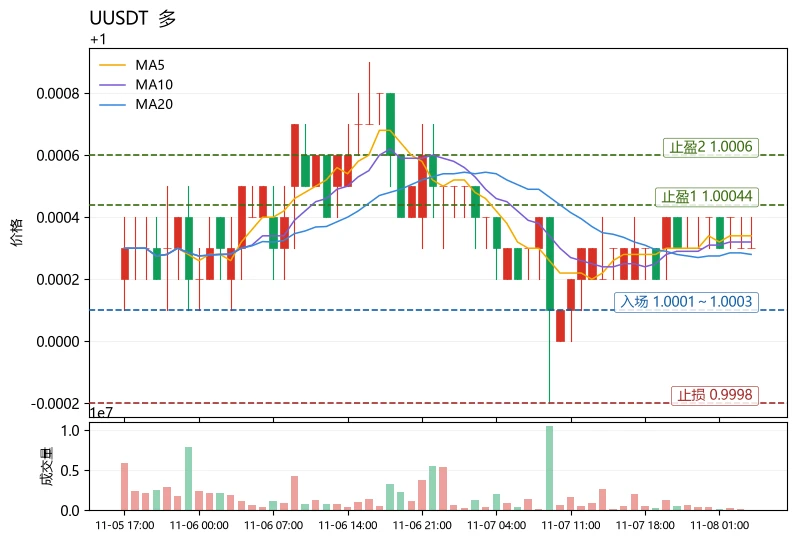
$U The market is currently in extreme fear territory (index 25), but the price is almost pinned at 1.0003. MA5 has edged above MA20, the MACD histogram has turned positive, RSI is neutral at 48.9, and the 30-candle range is only 0.07%, a typical low-volatility sideways structure. When broader market sentiment is subdued, capital tends to cluster in stable assets; $U ’s resilience and tight consolidation make it a natural destination for this rotation. While BTC’s direction remains unclear, it is more likely to follow passively than lead a decline. The bias is bullish, but only buy dips near th
post-image
MET-0.33%
SUI-1.05%
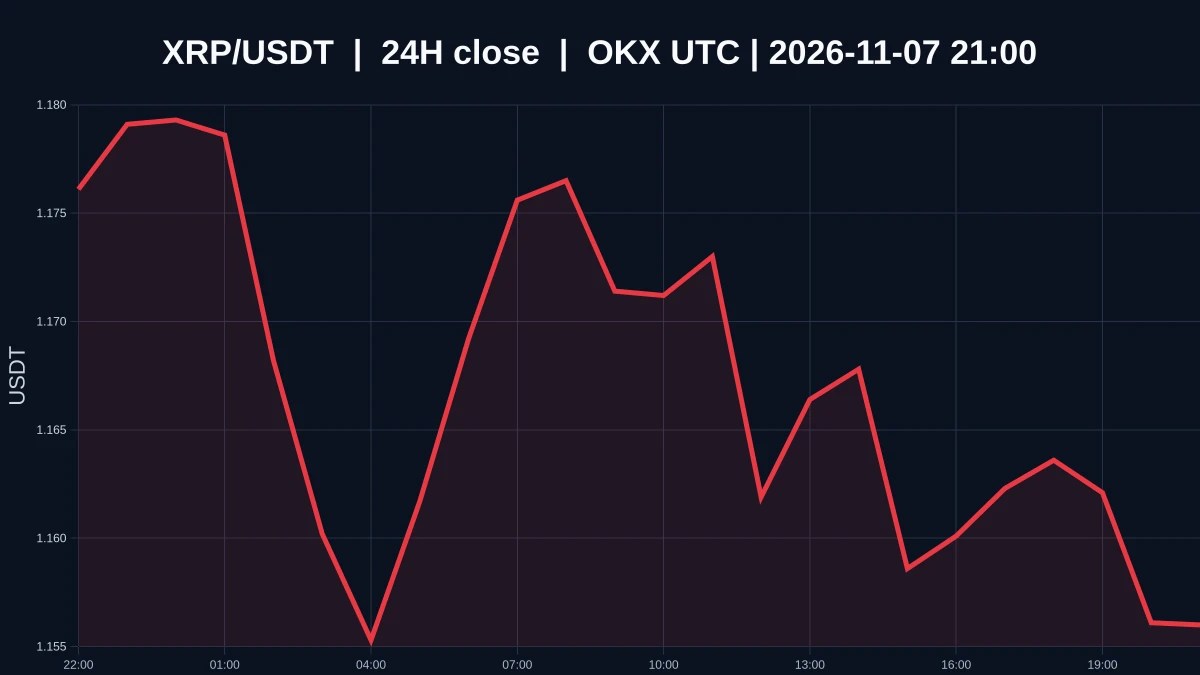
$XRP Is Weak on Low Volume at 1.1567. What’s Still Missing Between Oversold and a Bottom?
$XRP is currently priced at 1.1567, down about 1.44% over the past 24 hours, with an intraday low of 1.151 and high of 1.1853. The 1-hour and 4-hour trends are both weak, and the volume ratio is around 0.0429, indicating low market participation. Oversold describes a condition; a bottom is a confirmed outcome. A steep decline only shows that selling pressure has occurred. It does not automatically mean the price is cheap, much less prove that buyers are actually defending the area around 1.151. Demand for
post-image
XRP-1.15%
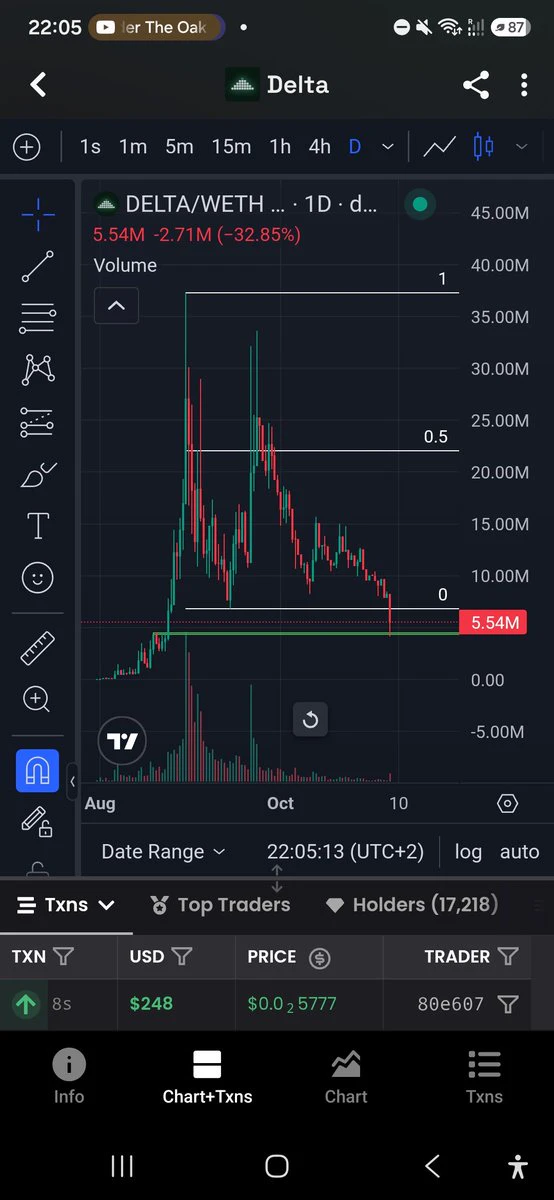
Bought $DELTA @deltaliquidity here on the capitulation/FUD
post-image
Anthropic has established itself as one of the most productive enterprises globally, capitalizing on the deployment of its Claude AI models across direct channels and cloud service providers. Cloud partnerships - including $AMZN , $GOOGL , and $MSFT - accounted for 48% of the company’s revenue in the first half of 2026.
AMZN-0.44%
GOOGL+0.72%
MSFT-0.95%
I don't day trade.
I don't sell covered calls.
I don't sell cash secured puts.
I don't buy weekly options.
I don't run spreads.
I don't watch screens all day.
I don't trade on the news.
I don't care what the market does day to day.
What I do:
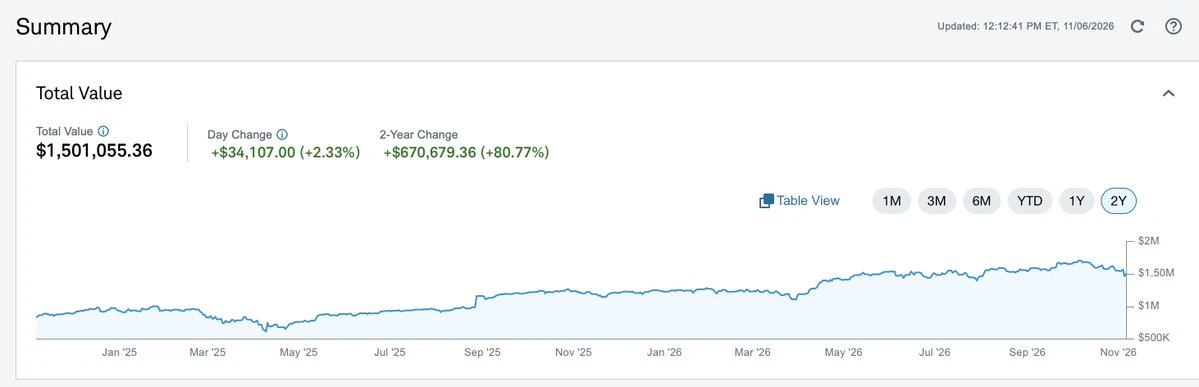
$3M+ in $VOO + $Q + Elite companies that never gets sold.
1+ year portfolio secured puts on great companies below fair value, secured by that base.
Every premium goes back into the base.
Ratios in check so a 50% crash can't force my hand.
$25k+ a month. 10 minutes a day. Don't complicate it.
post-image
VOO+0.33%
  • 1
$TUT /USDT RANGE FADE Sellers Testing Resistance

$TUT /USDT

Direction: SHORT

Entry: 0.0169700

Stop Loss: 0.0174889

Targets
TP1: 0.0165808
TP2: 0.0163214
TP3: 0.0159322

TUT has been chopping in a wide range after the sharp mid-week drop, with price now sitting right around MA7 (0.01703), MA25 (0.01707) and MA99 (0.01706) essentially glued to all three averages. This is a fade of the recent bounce attempt rather than a clean trend short.

$TUT ‌
TUT-1.66%
$BTC Testing The Neckline Of AKA Trigger Line Of The Head & Shoulder Reversal Pattern
A breakdown below will activate the target and lock it in.
NFA, DYOR ⚠️
#Crypto #Trading #BTC
post-image
BTC-0.67%
I just entered a short (sell) trade on $SWARMS
Stop loss: 0.00779 Take-profit targets: 0.00670 - 0.00665 - 0.00643 Start trading here 👇👇👇👇👇👇
post-image
SWARMS-3.61%
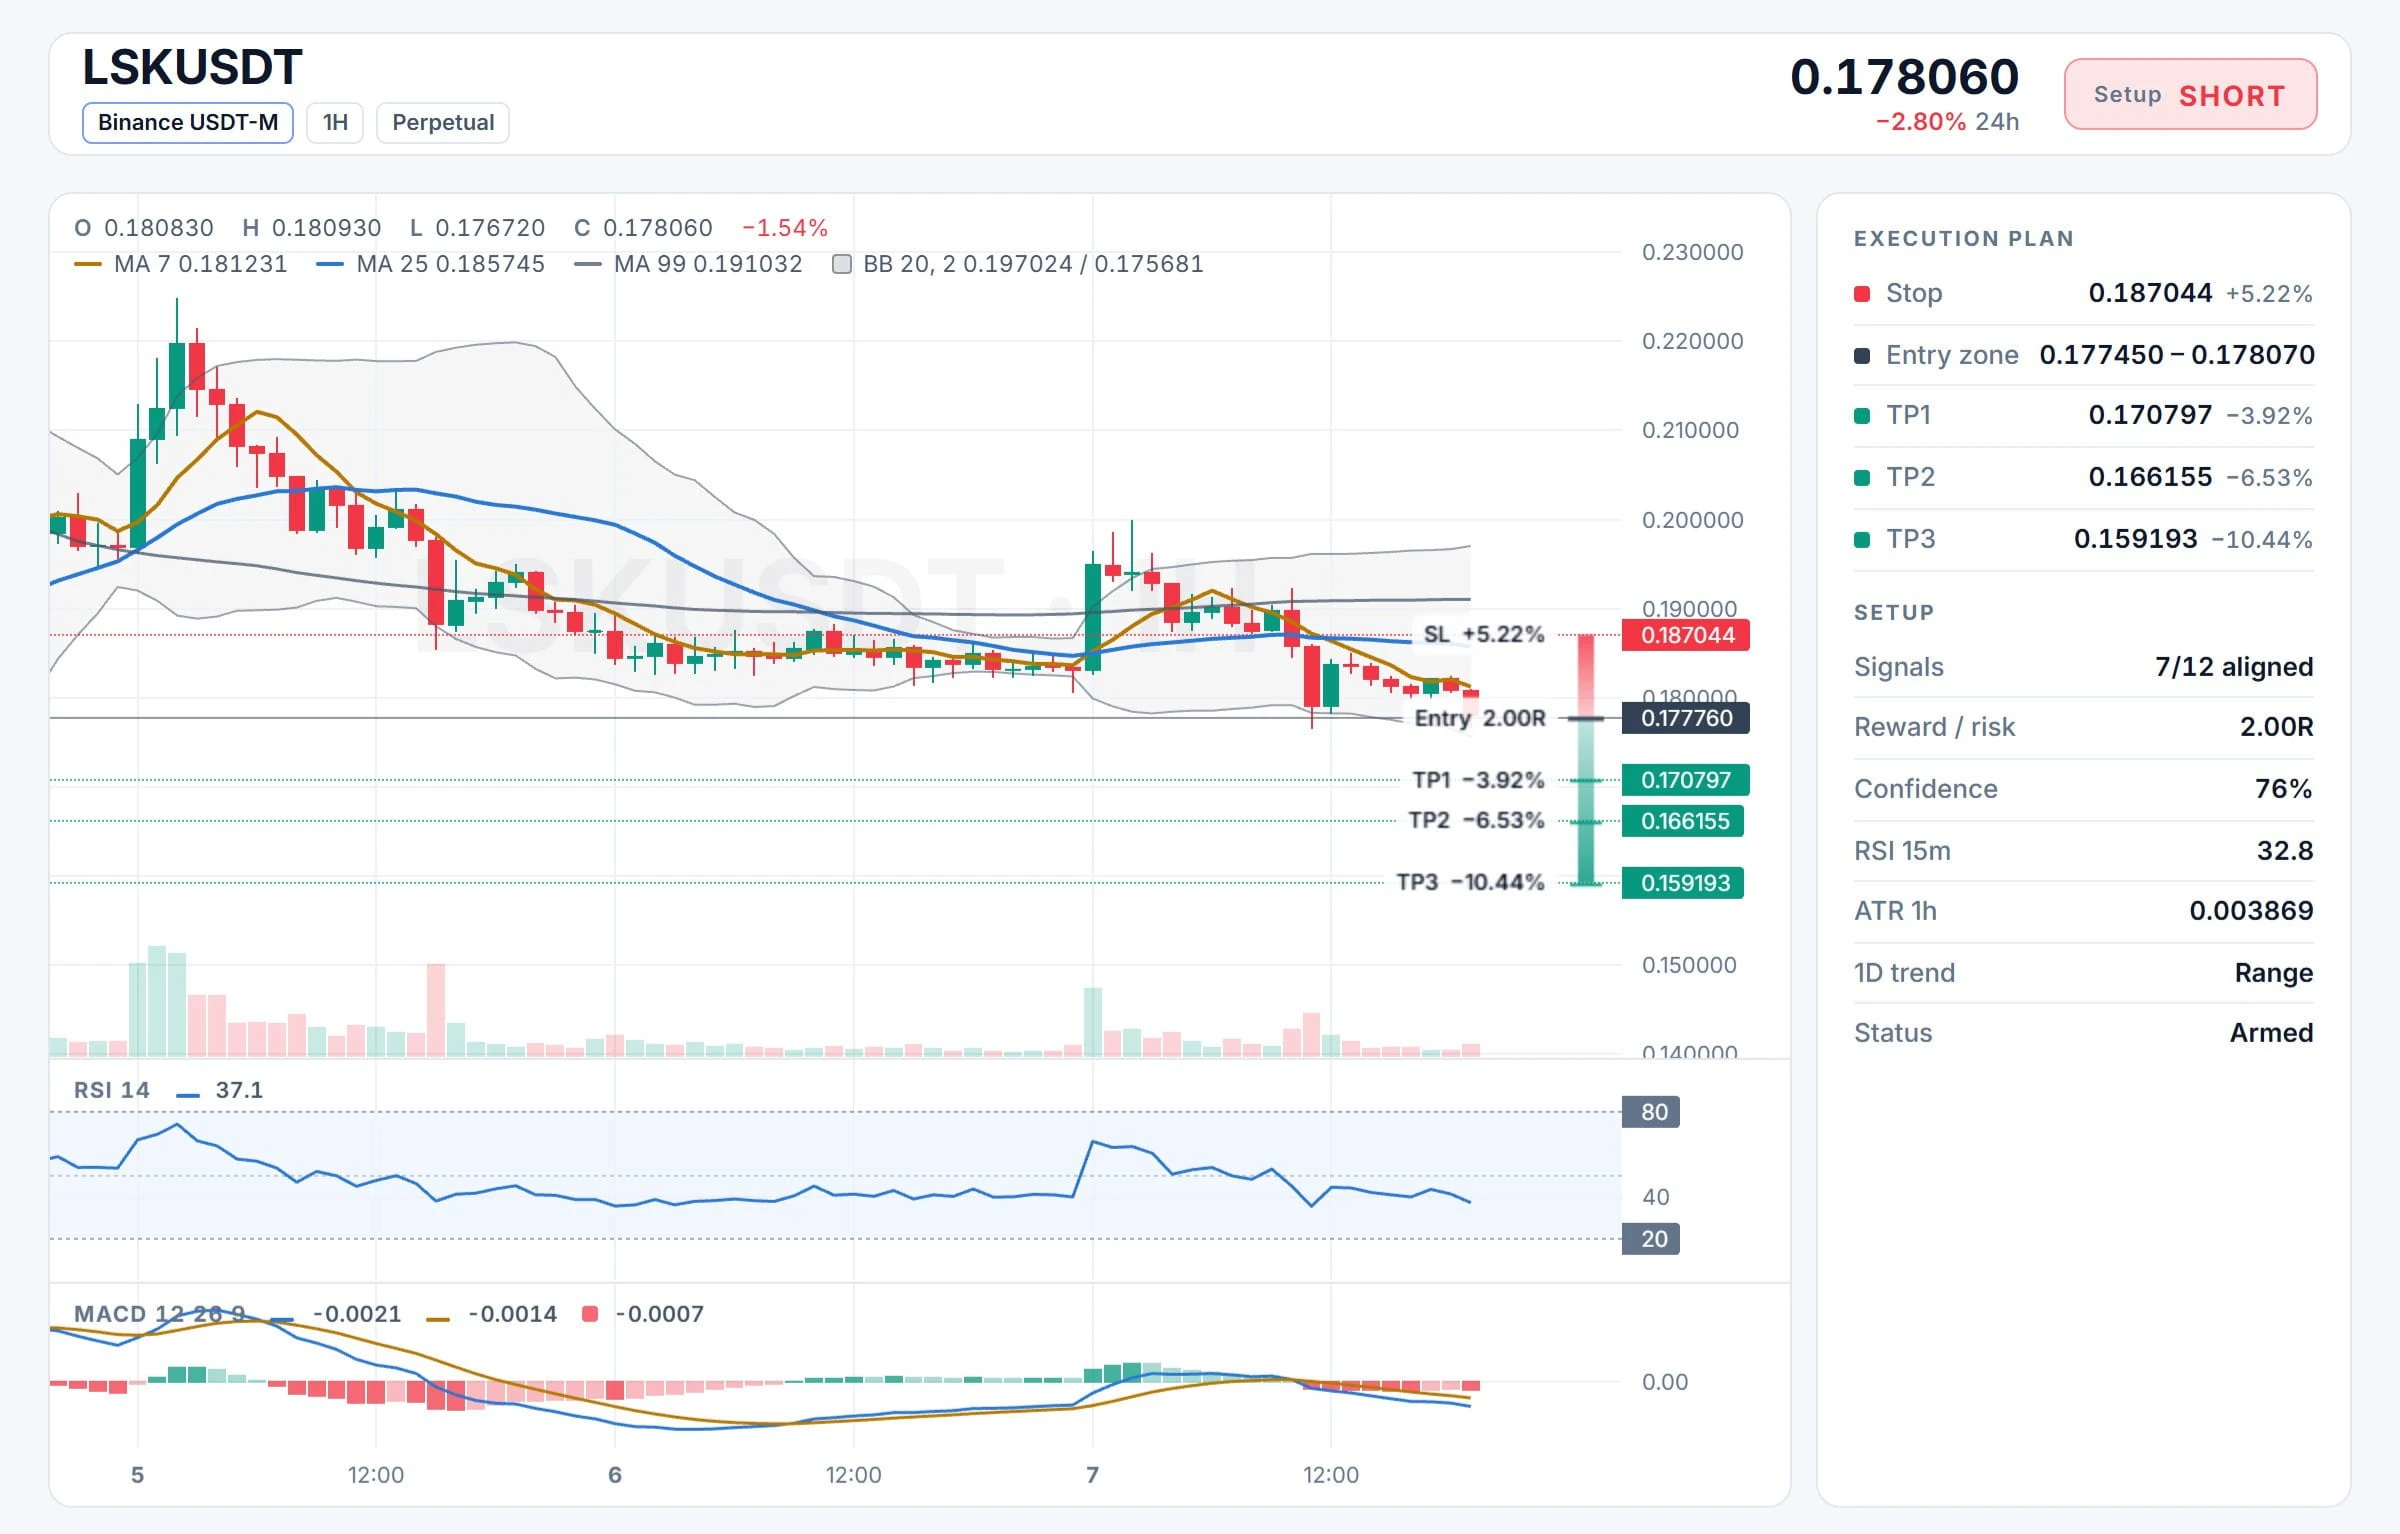
$LSK /USDT BREAKDOWN CONTINUES Clean Sell Signal

$LSK /USDT

Direction: SHORT

Entry Zone: 0.177450 – 0.178070

Stop Loss: 0.187044

Targets:
TP1: 0.170797
TP2: 0.166155
TP3: 0.159193

LSK rejected from the recent bounce high near 0.195 and is now trading below MA7 (0.18123), MA25 (0.18575) and MA99 (0.19103) a full bearish MA stack. Price just broke down sharply from the consolidation right at current levels, confirming sellers back in control.

$LSK ‌
post-image
LSK-5.22%
$YB SHORTYB hasn't managed to defend its earlier price levels. Sellers still have an opportunity to push this market lower.entry: 0.05113tp1: 0.05021tp2: 0.04928stop: 0.05266
post-image
YB+2.91%
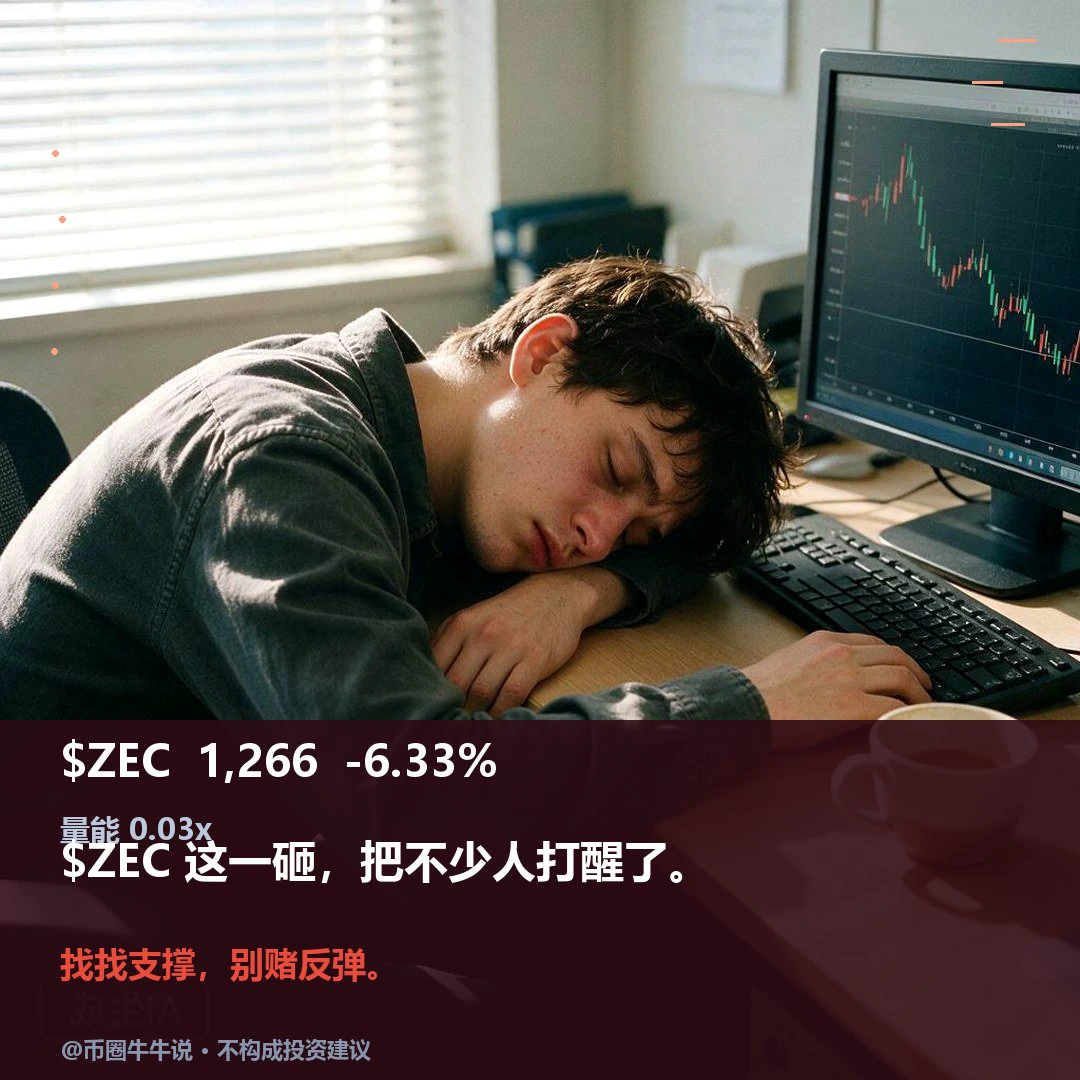
$ZEC Currently trading at 1265.91, down 6.33% over 24H (range: 1250.67–1364.08). The 1H trend is weak, with RSI at 24.79, price below the EMA20 at 1288.50, and a volume ratio of 0.03. The 4H trend is weak, with RSI at 55.38, price below the EMA20 at 1284.75, support at 1159.00, and resistance at 1387.89. A sustained move above resistance at 1364.08 could signal continuation; a break below support at 1250.67 would weaken the structure. Review whether 1364.08 holds and 1250.67 is reclaimed; volume is only 0.03x. A low-volume hold or a breakdown without a subsequent reclaim invalidates the setup.
post-image
ZEC+1.16%
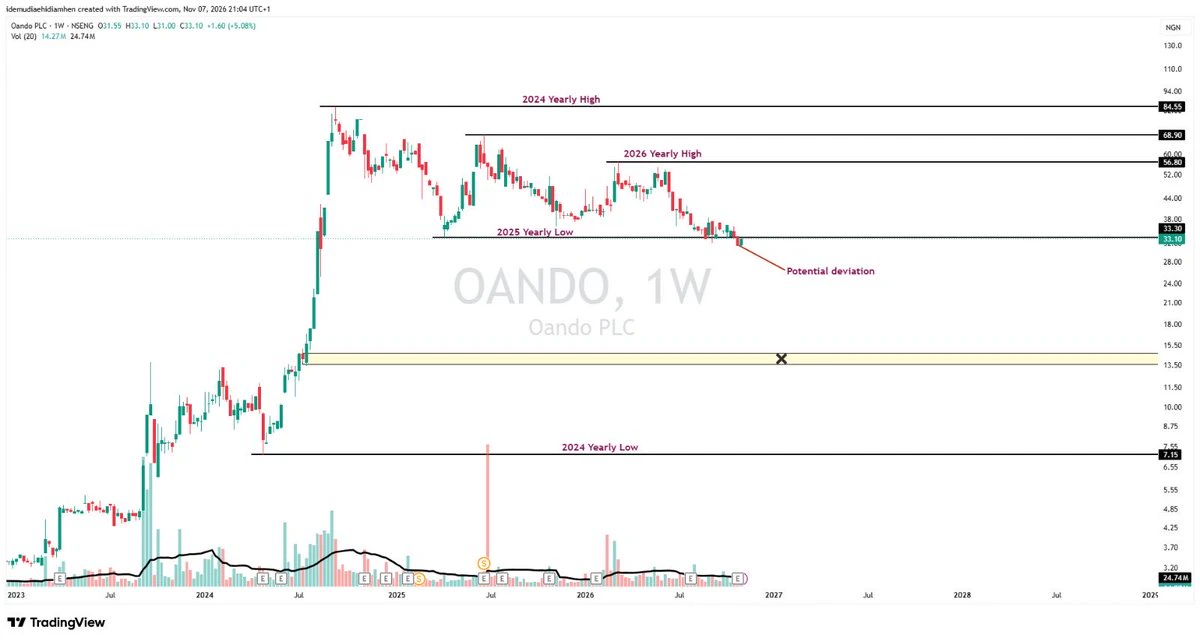
OANDO
Warning: OANDO's fundamentals are shite; I am gonna only focus on technicals.
Last week, we formed a potential deviation, and I expect a potential bounce to come next week. All I wanna see is the bulls reclaiming the 2025 yearly low of N33.1/share.
Failure to reclaim the 2025 yearly low; then the next zone is the X market zone in the region of N13.6-N14.7 per share, which I doubt the market makers of OANDO will want to happen.
Personally, I will never trade this company till I see the right momentum, but this is a memestock
#NFA
post-image
Load More

Join 40 M users in our growing community

⚡️ Join 40 M users in the crypto craze discussion

💬 Engage with your favorite top creators

👍 See what interests you

Trending Topics

USAIStocksHitHard

21.24k Views3.67k Discussing

U.S. stocks sold off sharply on Thursday, November 5 (UTC). The Nasdaq closed down around 5.5%, entering correction territory, while the Philadelphia Semiconductor Index plunged roughly 12%, with chip stocks including $NVDA and $AMD posting steep losses. Beyond profit-taking, investors are growing concerned about the pace of AI data center construction, capital spending, and future returns on investment. The key question now is whether the AI sector’s lofty growth expectations need to be repriced. Where do you think the next opportunities will emerge: chip stocks, tech giants, or other sectors?

USNonfarmPayrolls

34.98k Views4.34k Discussing

StakeOnLaunchpoolToShare450KVLX

10.25k Views828 Discussing

View More