
Square
Following
Hot
News
Profile
Share your thoughts
placeholder
Article
$SOL /USDT Short Trade Setup
Direction: Short 📉
Entry Price: 95.8600
Take-Profit Targets:
TP1: 94.7899
TP2: 94.0764
TP3: 93.0063
Stop-Loss Price: 97.2869
$SOL ‌
SOL-0.74%
[NEW SREAMER] market update
live-cover
LIVE939
Trenches
Q
Q
bade
b
Q
0xc0...0589
Market Cap
$.
Change
.
24h Vol
$.
Holders
.
DESSA
D
bade
b
DESSA
npz2...pump
Market Cap
$.
Change
.
24h Vol
$.
Holders
.
GTA6
G
bade
b
GTA6
4kjr...zDnz
Market Cap
$.
Change
.
24h Vol
$.
Holders
.
ZIG
Z
bade
b
ZIG
0x8c...1145
Market Cap
$.
Change
.
24h Vol
$.
Holders
.
IDOL
I
bade
b
IDOL
0x3b...ab07
Market Cap
$.
Change
.
24h Vol
$.
Holders
.
If you had a $10M networth. Would you spend $250k on a Porsche 911?
post-image
#StrategySTRCNears100ParValue #ShareWeekly
STRC Climbs to $99.24: Just $0.76 Away From $100 – Is Strategy Building a New Standard for Digital Income?
In my view, Strategy's STRC is entering an interesting phase. With its latest price reaching $99.24, the preferred security is now just $0.76 below its $100 stated value. That represents a discount of only 0.76%, bringing it closer to the price level Strategy wants to maintain.
However, I believe the bigger story is not simply STRC approaching $100. It is the financial structure, dividend strategy and market-support mechanisms that Strategy is d
STRC+0.00%
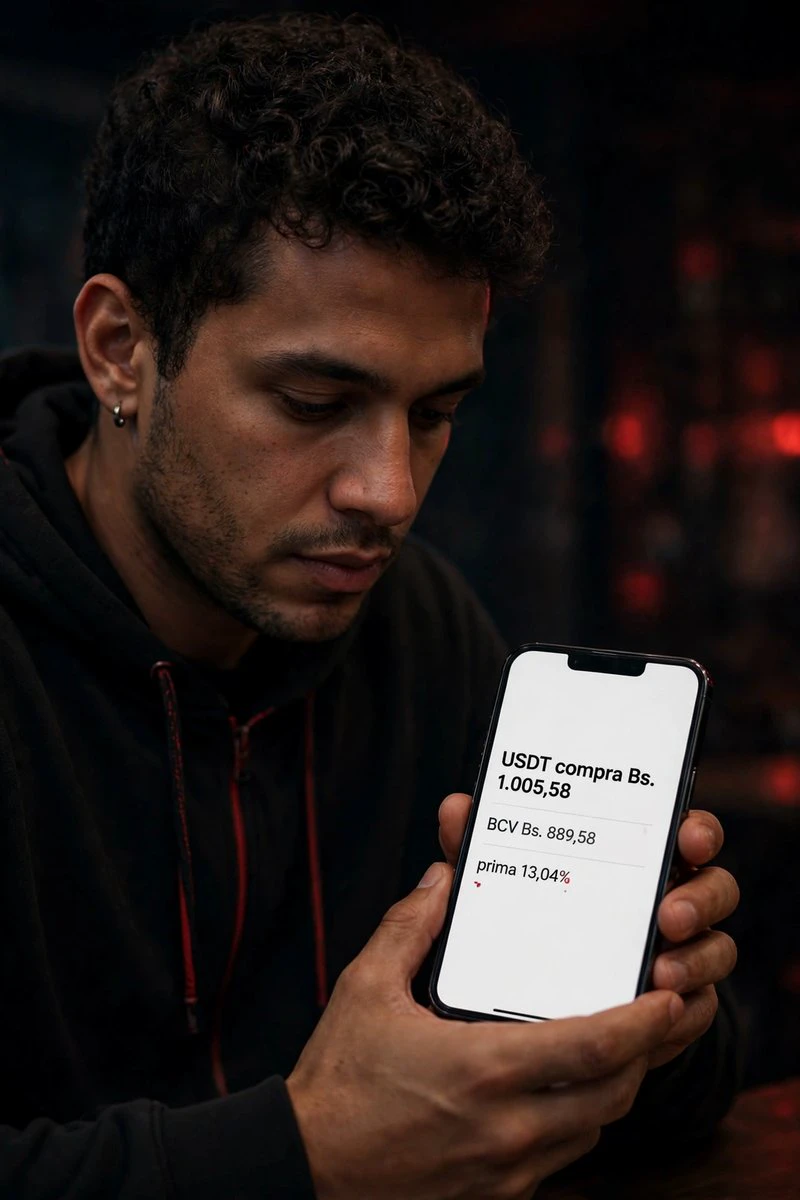
📊 BCV at 889.58 Bs and P2P USDT at 1,005.58: the premium is 13.04%. But the order book shows a spread of just 0.08%.
So where does that 13% come from? Not from a single quote, but from three different measurements being treated as if they were the same. Here’s a breakdown using data from the October 31 P2P Radar.
Three figures that measure different things:
• Official BCV rate: 889.5754 Bs per USD.
• Aggregated P2P USDT buy price: 1,005.5815 Bs, a premium of 13.04% over the BCV rate. The aggregated sell price is 974.6518 Bs.
• Order book spread: 0.08%, between the best ask at 981.79 Bs and th
post-image
I knew he’d try to pull a fast one. Those who’ve read the article know exactly what to expect. Treat the breakout as fake for now, and focus on the 2310~2320 range: if it shoots straight up, hold; if it gets stuck there, short,
UchihaUltraShort
Today is Saturday. The crypto market moved sideways all day with little volatility. From the sidelines, it feels like bulls don't dare to buy, profitable shorts don't want to take profit, and losing shorts don't want to close their positions. After bottoming at 2173 yesterday, the price held above 2230 and hasn't pulled back much since. Compared with yesterday, today has been a sideways move with an upward bias. Trading volume is thin, which does feel a bit like the end of a bear market, judging by trading volume and market performance over the past two months.
First, let's analyze the market structure over the past two days.
Around 2173, a considerable portion of leveraged bulls were liquidated, and high-level shorts have also taken profit on more than half of their positions. Buyers are now weak, while among sellers, some shorts are in profit and a moderate number are at a loss.
The most likely scenario
In this market, I think it's easy for the big players to pull a fast one. It's the weekend, there are few market shorts, and retail trading volume is relatively low. They can provide some capital to push the price up, with the rest coming from short stop-losses and liquidations.
They could push it up 50 or 60 points, but not too high, then quickly pull back after the rally, leaving an upper wick. They only need to trigger some shorts' stop-losses and panic take-profits to drive the price up quickly, while trapping those who chase the rally!!!
Conclusion: Shorting at 2311 is the safest option. Chasing longs between 2260 and 2290 could easily leave you trapped. You can chase longs in the short term to catch the turning point, but you'll definitely be too late. As I'm writing this, I recommend that my followers short at 2311,
with 60x leverage and 6% of their position, add 4% at 2320, and set a stop loss at 2330!!!

repost-content-media
  • 3
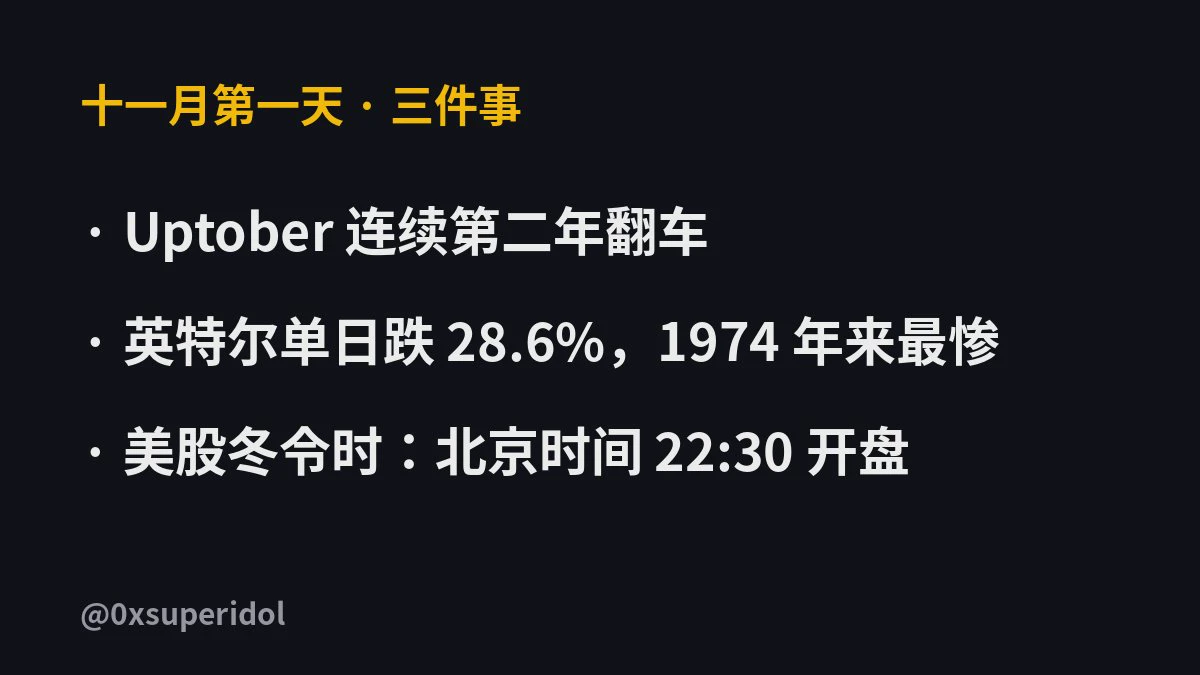
October $BTC got hammered, Intel plunged, and in November we still have to stay up an extra hour for US stocks. Money’s hard to make, and they won’t even let us sleep 😑
Uptober has failed two years in a row, with October $BTC getting hammered all the way back to around 77,000. They’ve been talking up seasonality for a whole month—what a load of crap.
Intel plunged 28.6% in a single day on Friday, its worst drop since 1974. Beating profit expectations didn’t help; guidance was weak, and the stock still fell this much.
US stocks switch to winter time today. Starting next week, the market open
post-image
BTC-0.67%
INTC-28.49%
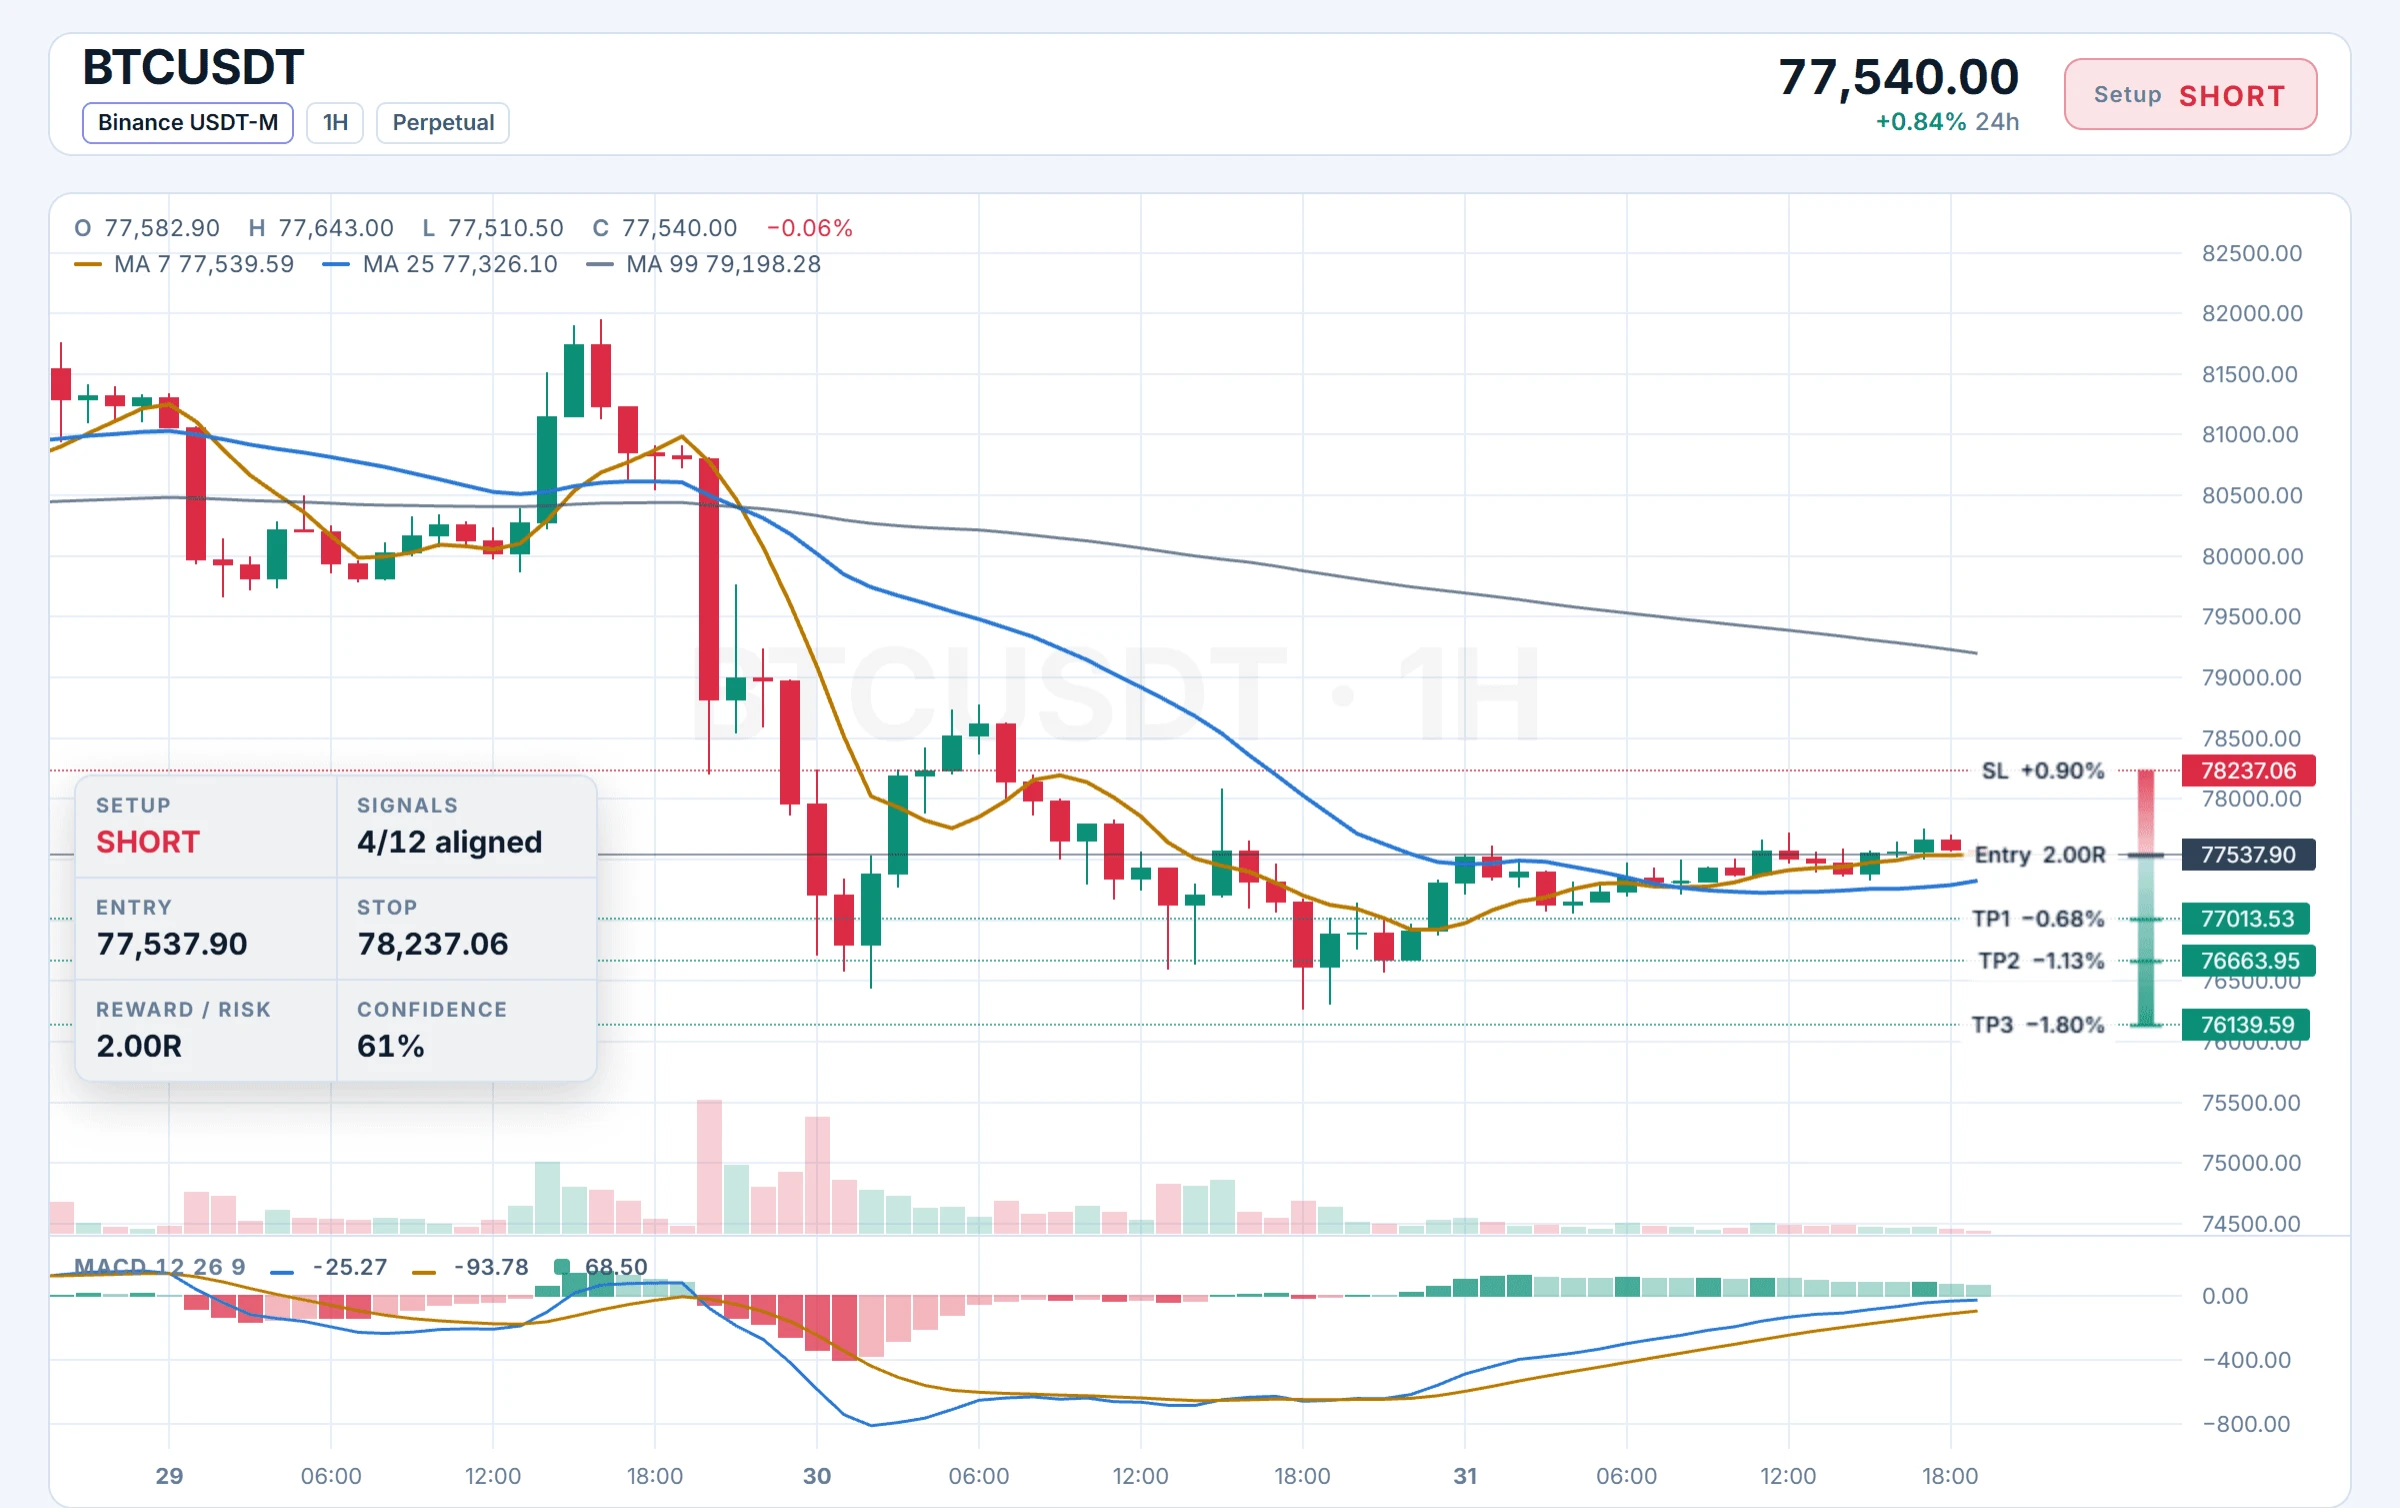
$BTC /USDT Short Trade Setup
Position: SHORT 📉
Entry Price: 77,537.90
Profit Targets:
TP1: 77,013.53
TP2: 76,663.95
TP3: 76,139.59
Stop-Loss Price: 78,237.06
$BTC ‌
post-image
BTC-0.65%
$LIT This 15.86% rally is a classic bull trap; anyone chasing the price today is just here to hold the bag. The current price is 3.1482, with 24h trading volume of 52.6M. Volume has picked up, but the price hasn't reached the daily high of 3.1679—pay attention to this detail: the high came early in the session, and since then the price has been grinding sideways around 3.14, a classic pump-and-dump pattern. From the 24h low of 2.6867 to the current price, the range is 17%, with enough turnover for early holders to exit comfortably. My take: this move was driven by short-term funds making a qui
LIT-4.56%
  • 10
  • 2
Wife spent hours making Halloween goodie bags last night. You’d be amazed how many kids took the potato instead 😂
post-image
Ahead of the Fed decision, the market is just stuck like this: the Dow is slightly higher, the Nasdaq is nearly flat, and the S&P is edging up. $VRT is surging 14%, while $FFIV is down nearly 20%—that divergence is the key. Wait until 2:30 this afternoon; don’t rush. Save this take for now and come back tomorrow to see if it holds.
post-image
NAS100-0.07%
SPX+0.33%
VRT-5.47%
FFIV-6.80%
  • 8
  • 2
🚨 GOLD IS ABOUT TO SET THE MOST BRUTAL TRAP OF THIS CYCLE.
And I believe the biggest buying opportunity hasn't even arrived yet.
Most investors are still trying to catch every dip.
I'M WAITING FOR A 32% CRASH.
Look at this chart.
Here's my roadmap for $XAU :
PHASE 1: Gold plunges 32% into major weekly support.
PHASE 2: Final capitulation. Panic takes over. Even the biggest gold bulls give up.
PHASE 3: A massive 57% recovery toward $4,659.
PHASE 4: Gold breaks toward a new all-time high at $5,597.
Now think about what this means.
The people aggressively buying gold today could be the same ones
post-image
XAU+0.38%
Golden Finance | November 1 Morning Briefing
1️⃣ Market: BTC 77586 up 0.95%, while ETH 2258 up 0.98%. The 24-hour move is a low-volume recovery, with gains coming more slowly than declines, suggesting buyers have yet to step in
2️⃣ Sentiment: The Fear & Greed Index is at 30, remaining in the fear zone for two consecutive days. It was 51 a week ago and 74 a month ago—a sharp three-step decline in sentiment
3️⃣ Event: After a leading exchange was hacked for about $6.3 billion, it has replenished about 90% of the stolen assets. Reserve coverage for 10 major tokens has returned to 100%. Withdrawal
post-image
BTC-0.67%
ETH-1.26%
  • 9
I might need a handler soon.... a lot of upcoming NFT Mint
post-image
MARKET UPDATE
live-cover
LIVE688
☀️ GM! The market has been making quite a bit of noise this week. 🔊
CPI and PPI both came in above expectations, weighing on tech stocks, while BTC is also searching for a new direction.
📌 Today, let’s discuss: What is the market signal most worth watching this week?
📊 How will changes in inflation affect the market ahead?
₿ BTC, U.S. stocks, or gold—which direction are you watching most closely?
👀 What trading plans did you adjust this week?
There has been plenty of market news, but valuable insights are worth keeping.
🎁 Come share your observations and trading recap for the week on Gate
BTC-0.67%
XAU+0.38%
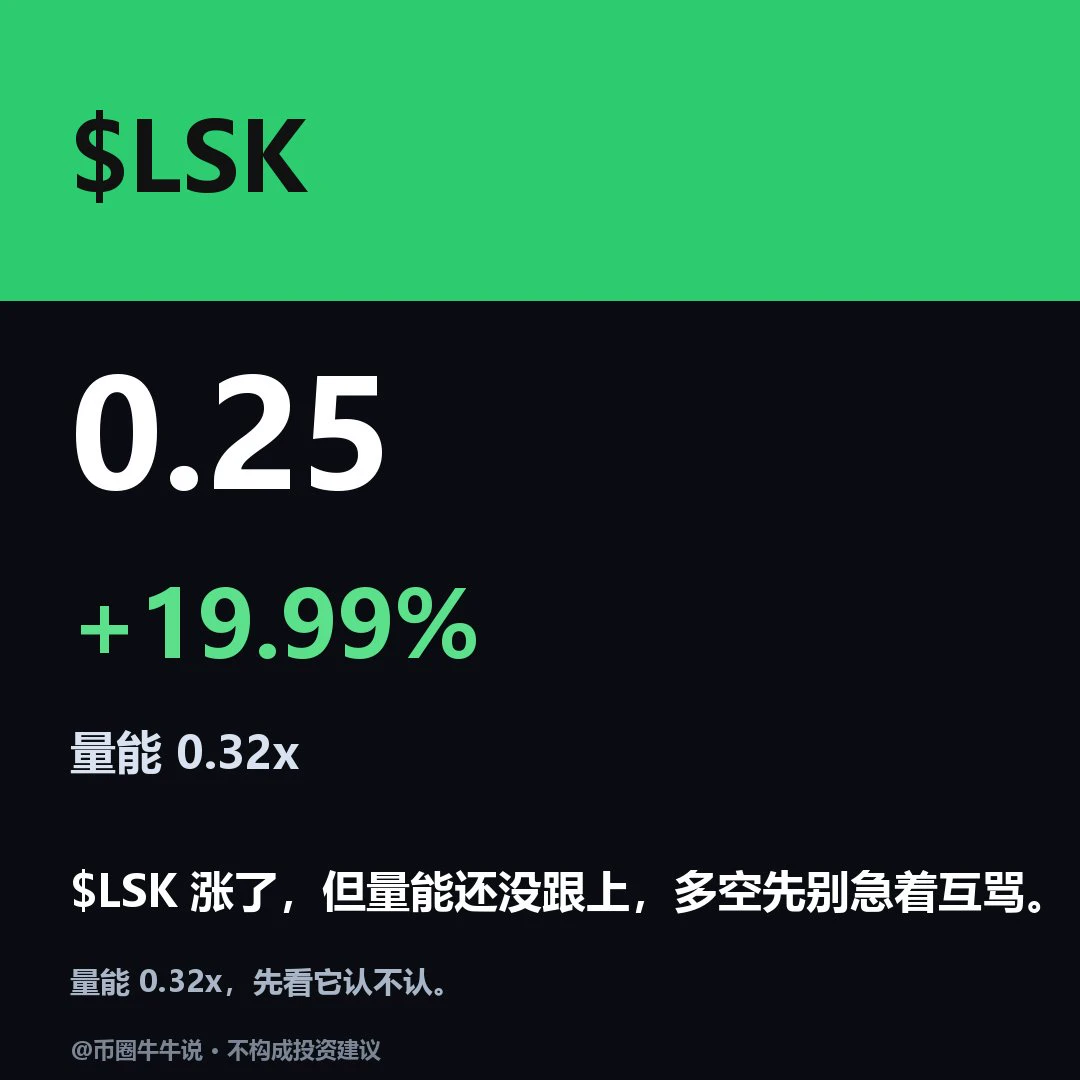
$LSK is currently at 0.2485, up 19.99% in 24H. The 1H timeframe is weak (RSI53.57), while the 4H timeframe is strong (RSI58.85), indicating a divergence. If it holds above the 0.3189 resistance level, continuation may be worth watching; if it breaks below the 0.206 support level, a pullback is possible. Going forward, watch whether it can hold above 0.3189 and whether it can reclaim 0.206 after losing it. The two timeframes remain divergent, and short-term moves do not necessarily signal a trend reversal. The market is volatile; for observation only.
post-image
LSK-5.32%
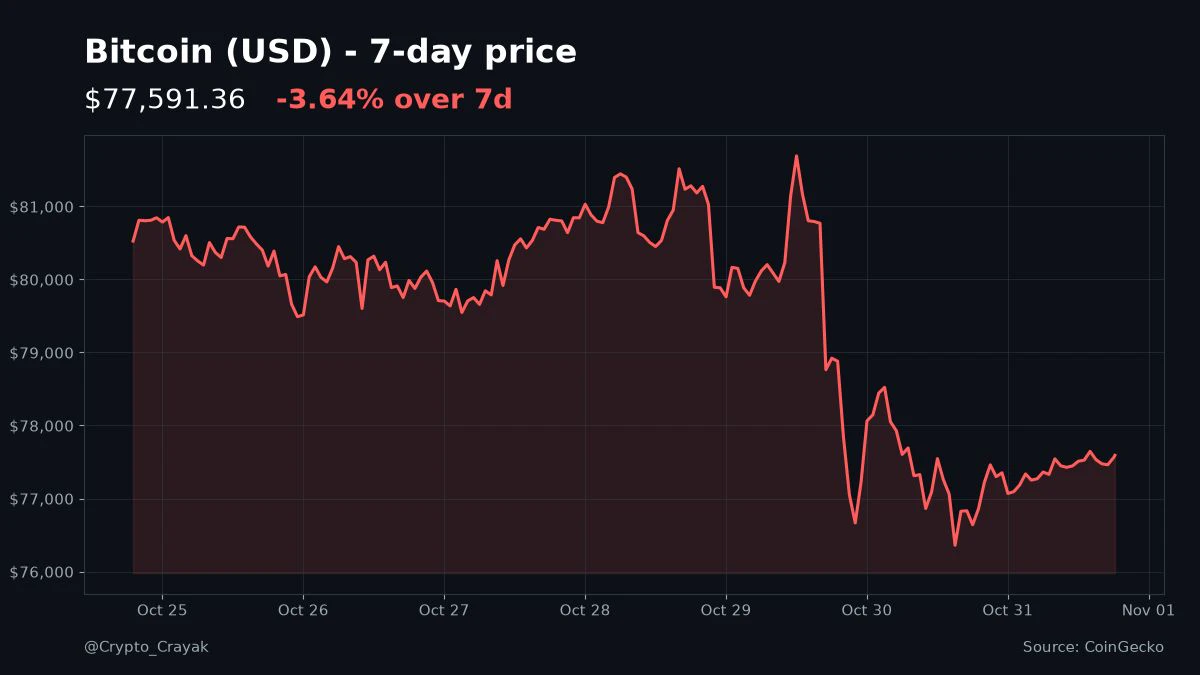
Bitcoin's been sliding all week and is sitting around $77.6K tonight, down a little under 4% from last Saturday.
Not a crash, just a slow leak. Honestly those are harder to sit through.
Anyone stacking sats at these levels or waiting for lower? #Bitcoin
post-image
BTC-0.67%
$l Next one, friend $NMR
‍$QNT
..YiHe:ProofOfReserves:10TokensAt100%Backing
post-image
NMR-3.02%
QNT+4.79%
$PEPE ‌pepe A double-sided life, a legend remembered by countless crypto enthusiasts, and my lucky coin
post-image
PEPE+1.05%
  • 1
Load More

Join 40 M users in our growing community

⚡️ Join 40 M users in the crypto craze discussion

💬 Engage with your favorite top creators

👍 See what interests you

Trending Topics

BTC大跌

365.97k Views39.69k Discussing

$BTC briefly fell below $77,000 and remains under pressure around the $77K zone, with its 24-hour decline still above 4%. With risk appetite weakening and Fed uncertainty rising, where is the next key support after losing $80K?

IntelBeatsEarningsButStockPlunges

28.87k Views912 Discussing

StrategySTRCNears100ParValue

35k Views4.12k Discussing

View More