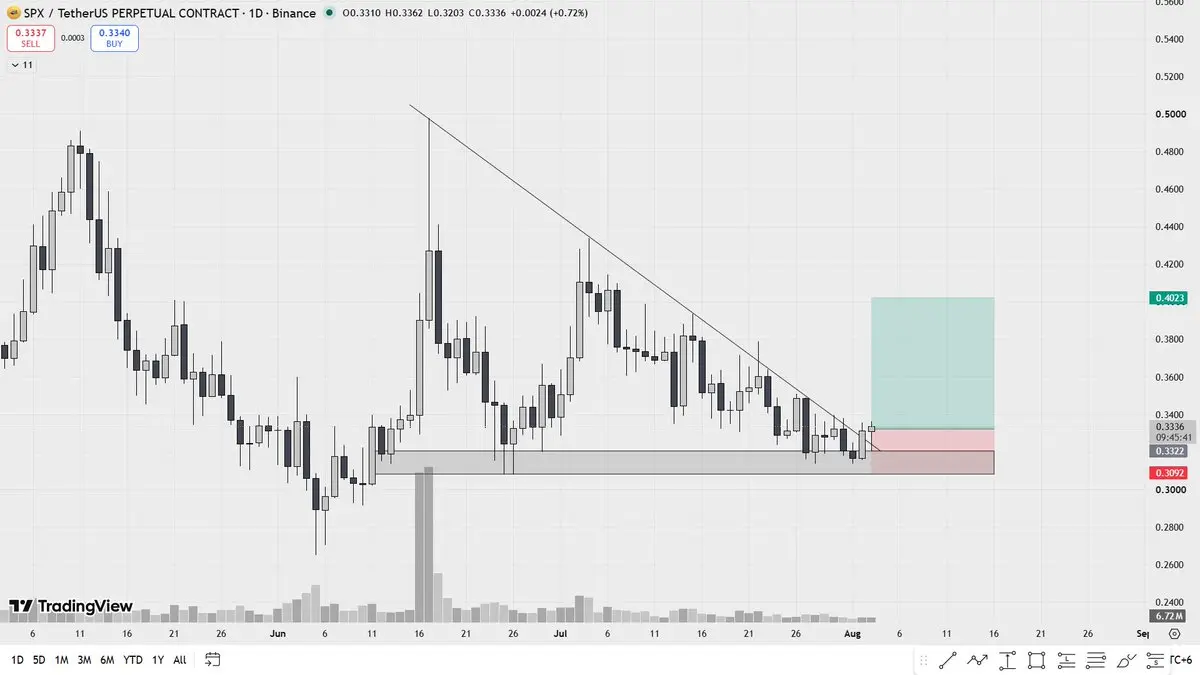
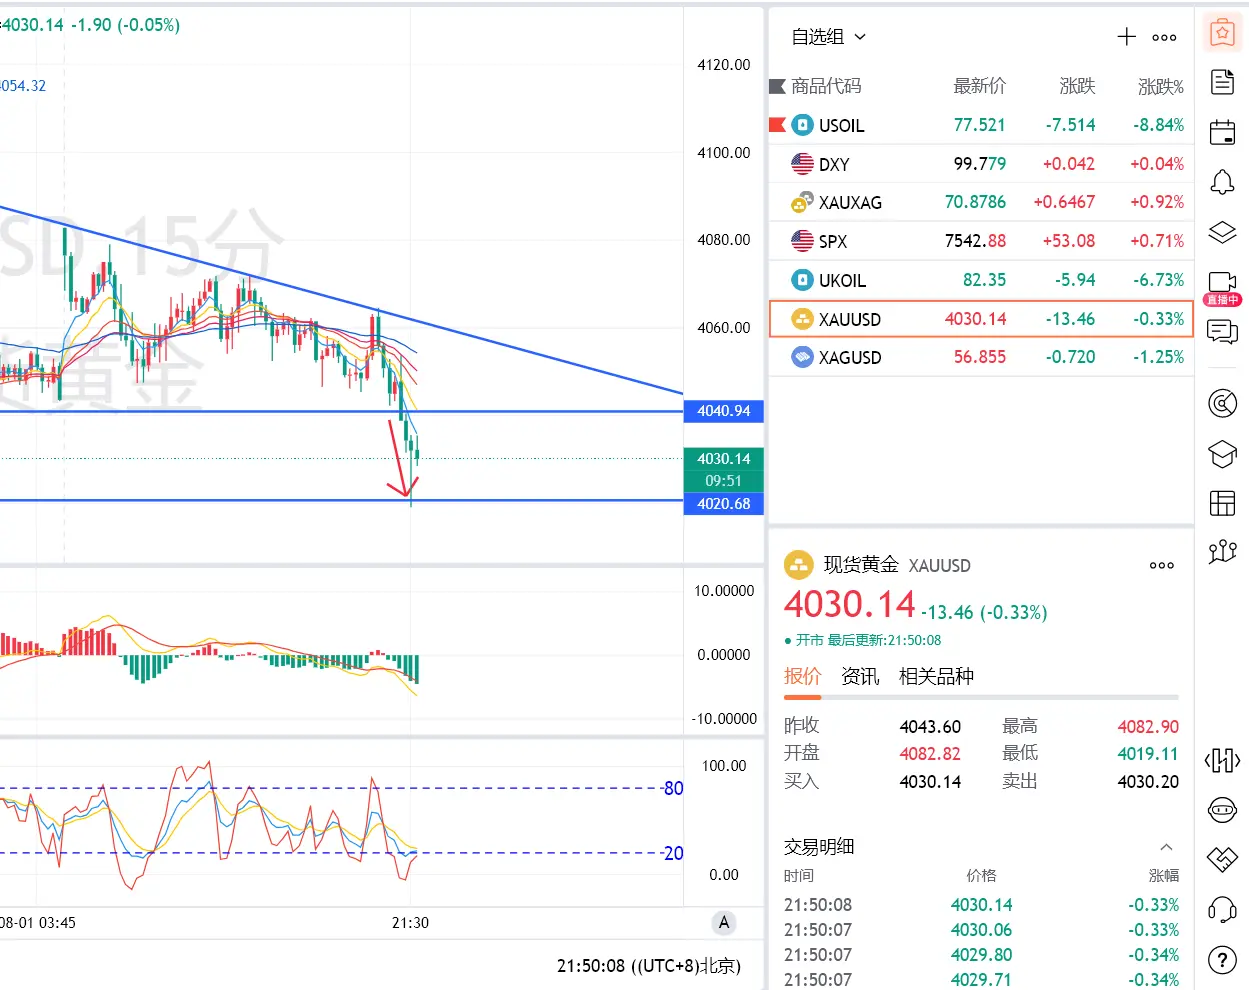
Share crypto content and earn up to 60% commissions through content mining.
placeholder
gatefun
Don’t blink—this chart suddenly got strong! 🚀 A few days ago, before bed, it was still grinding back and forth; $BASED it didn’t immediately take a stance, but at the time I was watching BASED’s key levels and the buy orders. The pullback held, which means the move below isn’t weak 👀
Before the chart fully kicked off, it kept churning around 0.0685. Many people only saw it as annoying grinding—I saw selling pressure easing and capital quietly moving in. So back then, I gave the signal to go long: don’t chase the upswing, just wait for the position 📌
Now it has pushed from 0.0685 to 0.09624
BASED16.24%
BTC-2.85%
ETH-2.73%
View Original
post-image
  • Reward
  • Comment
  • Repost
  • Share
#StrategyBuybackSurges12%
Strategy Unleashes a 2 Billion Dollar Defense Plan
Strategy just broke its nine-day losing streak with a 12.6% surge, and the move is sending a clear signal to the market: the company is no longer just buying Bitcoin — it is actively managing its own survival.
The catalyst was a new Digital Credit Capital Framework announced on June 29. The plan authorizes up to 2 billion dollars in stock buybacks, backed by a Bitcoin monetization program that allows the company to sell up to 1.25 billion dollars in BTC to fund the repurchases . CEO Phong Le described the shift as a
BTC-2.87%
post-image
  • Reward
  • Comment
  • Repost
  • Share
I have no other choice than to settle for mrDOTjaypee.
What's your WhatsApp username so we could connect once it's live?
  • Reward
  • Comment
  • Repost
  • Share
This candle came out, and the chart is no longer pretending! 🔥
When I opened the chart this morning, $JTO 's bullish rhythm was instantly revealed. It was still consolidating a few days before bedtime, but today it cashed out the patience directly.
When the chart hadn't fully started yet, I was watching whether JTO's retracement held and whether the buying support below was broken. The price consolidated repeatedly around 0.5366, the key level didn't break, and selling pressure became lighter. I signaled at the time to open long, don't wait until it pumps to panic and chase. 👀
Now seei
JTO-3.16%
BTC-2.85%
ETH-2.73%
View Original
post-image
  • Reward
  • Comment
  • Repost
  • Share
ANSEM surges to a $140 million market cap
gate liveLIVE
515
live-coin
  • Reward
  • Comment
  • Repost
  • Share
The last look before bed was still grinding, woke up and it's fully alert! 📉😎
A few days ago, $RAVE repeatedly tested the high area, looked like it wanted to push, but the volume didn't follow, no one continued to buy the dip, the market became weaker the more it ground.
While everyone was waiting, I saw RAVE get pushed back every time it tried to rally, the rebound strength getting weaker each time 👀 At this level, I don't want to chase longs, the short opportunity is clearer, so I executed a short near 0.4954.
This drop brought the price to 0.3167, yield +884.54%, this profit came smooth
RAVE-25.38%
BTC-2.85%
ETH-2.73%
View Original
post-image
  • Reward
  • Comment
  • Repost
  • Share
This trend is really outrageous! 📉👀🔥 Before the chart had fully started, I saw $GALA repeatedly testing the high, superficially looking like it would continue to surge, but actually each time it went up, it had no strength, and as soon as selling pressure came out, it softened.
A few days ago in the afternoon when I was watching GALA, my judgment was straightforward: volume-less pump, insufficient buying support, obvious overhead resistance. This structure is not strong, it's fake. Once you understand it, execute it, don't hesitate at the last moment 🎯 So I arranged a short near 0.003437.
GALA-2.50%
BTC-2.85%
ETH-2.73%
View Original
post-image
  • Reward
  • Comment
  • Repost
  • Share
🚨 BREAKING: The S&P 500 has climbed back above 7,500 and is now just 1.6% away from a new all-time high.
US5000.65%
post-image
  • Reward
  • Comment
  • Repost
  • Share
Just in on NBA Today -- the Toronto Raptors land Kawhi Leonard in a trade back from the Los Angeles Clippers:
post-image
  • Reward
  • Comment
  • Repost
  • Share
⚡️ SAYLOR: "Stronger credit. Stronger equity. More Bitcoin."
$BTC
BTC-2.87%
post-image
  • Reward
  • 15
  • Repost
  • Share
PanDa:
Jump into 🚀
View More
Everyone is calling the bottom on BTC — but the 4h data just flashed a 95% short signal.

$BTC /USDT - SHORT

Trade Plan:
Entry: 58642.35 – 58830.29
SL: 59638.44
TP1: 58059.73
TP2: 57608.67
TP3: 56932.08

Why this setup?
• 1D trend is bearish, and RSI on 15m sits at 53.65 — no oversold relief.
• ATR of 375 suggests momentum is building, not fading.
• Entry zone at 58,736 with TP1 at 58,059 and TP3 at 56,932 — a clean cascade setup.
• Why now? The "waiting" status means the trigger is imminent.

Debate:
Are you adding shorts here or waiting for a fakeout to 59,638 first?
BTC-2.85%
post-image
post-image
  • Reward
  • Comment
  • Repost
  • Share
come join and earn
gate liveLIVE
125
  • Reward
  • Comment
  • Repost
  • Share
This smash really brought out the temper of the chart! 📉🔥 A few nights ago, before bed, I was watching $LAB . It kept testing the high zone repeatedly, looking like it wanted to push higher, but volume never caught up. Even when it went up, nobody was buying—it looked more and more like a bull trap.
While everyone was still waiting on the sidelines, I noticed that each rebound of LAB was weak—it fell back as soon as it hit resistance. So I suggested going short, not chasing entries, and letting it expose its own weakness 👀
Now from 14.08063 to 13.11017, a gain of +134.15%. That was a juicy
LAB-11.42%
BTC-2.85%
ETH-2.73%
View Original
post-image
  • Reward
  • Comment
  • Repost
  • Share
To be honest, this market is really messing with people. 🔥📉 A few days ago in the early morning hours, $CHZ it was testing back and forth at the high, looking lively on the surface, but the more I looked at it, the more I felt something was off: no volume on the breakout, weak support, and after the move up, no one was willing to keep buying in.
While the market was grinding at the top, I was watching CHZ’s bounce strength—several attempts to push up failed to hold, with resistance persisting. Around 0.0359, I switched my mindset to bearish, suggesting to go short and not fight the fake bre
CHZ-7.18%
BTC-2.85%
ETH-2.73%
View Original
post-image
  • Reward
  • Comment
  • Repost
  • Share
$ETH Signal】Short: 1H bounce meets resistance + 4H weakness
$ETH Buy order depth 2.12x, price stuck around 1579, barely moving. 1H MACD golden cross but momentum weakening, 4H Bollinger Band middle line at 1581 forms resistance. Selling pressure not released, long capital passively absorbing. Current price enters suggested short zone 1574-1579. The risk-reward ratio here is decent, stop loss placed above 1595, probability of breaking below 1555 is not low.
🎯Direction: short
⚡Entry/Pending order: 1574.2829 - 1579.0200
🛑Stop loss: 1594.8102
🚀Target 1: 1555.3347
🚀Target 2: 1543.4921
🛡️Trade
ETH-2.73%
View Original
post-image
  • Reward
  • Comment
  • Repost
  • Share
$BTC HAS ENTERED THE BEST DCA ZONE
2018 👉DCA zone at $3-6k, everyone called it dead, BTC ran to $69k
2022 👉DCA zone at $15-20k, everyone called it dead, BTC ran to $126k
2026 👉DCA zone forming right now, everyone is calling it dead again, guess what happens next
What is your take on this on one? 🤔
$BTC
BTC-2.87%
post-image
Original content no longer visible
  • Reward
  • Comment
  • Repost
  • Share
A few days ago, it was acting like it was dead, and today it directly gives results! 📢 $TRUTH This wave of long positions has paid off. Truly, it wore people out earlier, and then once it came out, it was very straightforward🔥
While everyone was still waiting and watching, I was looking at whether TRUTH had broken the key level. Before the market had fully started, the price hovered around 0.010292 and was suppressed several times but couldn't go down. It pulled back and held steady, buying started to become active. At that time, I suggested going long 👀
Now it's at 0.016905, return rate +
TRUTH5.26%
BTC-2.85%
ETH-2.73%
View Original
post-image
  • Reward
  • Comment
  • Repost
  • Share
Bitcoin IBCI Hits 4.76 — Historical Bottom Signal Activated
The Index of Bitcoin Cycle Indicators (IBCI) currently sits at 4.76 points, placing it in the green accumulation zone while Bitcoin trades near 58,000 dollars . This reading puts the indicator on par with levels observed during the market bottoms of 2022 and accumulation periods of 2018. Technically, this signals that market leverage and speculative over-optimism have been cleared .
Understanding the IBCI
The IBCI is a comprehensive analytical tool developed by CryptoQuant that combines multiple essential metrics into a single score .
BTC-2.87%
post-image
post-image
  • Reward
  • Comment
  • Repost
  • Share
GOLD vs. $BTC.
$BTC
BTC-2.87%
post-image
  • Reward
  • 3
  • Repost
  • Share
GateUser-e6dafce6:
This comparison chart, viewed once a year, shows that BTC's market cap has multiplied several times.
View More
You guys have no idea! When I opened the chart this morning, I was wide awake instantly 📉🚨🔥 A few nights ago before bed $XRP was still holding up above. I felt something was off—the upward push was labored, the resistance was heavy, it just didn't look like it could go higher.
A few days ago in the early morning, I saw the rhythm of XRP very clearly: no one was buying the push up, but the pullback was sharp, and the lack of rebound strength was practically written all over its face 👀 So near 1.4143, I directly executed a short position, waiting for the bears to cash in.
Now the price has
XRP-1.87%
BTC-2.85%
ETH-2.73%
View Original
post-image
  • Reward
  • Comment
  • Repost
  • Share
Load More

Join 40 M users in our growing community

⚡️ Join 40 M users in the crypto craze discussion
💬 Engage with your favorite top creators
👍 See what interests you
  • Pinned