















#Gate股票畅聊季 A Logical Breakdown of the Deep Correction in U.S. AI Stocks: Panic Pricing, Expectations Mismatch, and Diverging Long-Term Value
The U.S. stock market has recently experienced sharp volatility. Over the past 45 days, the S&P 500 and core AI assets have suffered significant pullbacks, with market capitalization losses reaching as much as $6 trillion. Market sentiment is currently at an extreme fear level. Drawing on recent market conditions and the perspectives of leading institutions, this report breaks down the four core factors behind the latest selloff: AI capital expenditure, the political cycle, macro liquidity, and a black swan event in chips. The analysis finds that the market’s decline is driven mainly by short-term risk aversion and the linear extrapolation of pessimistic long-term expectations, rather than a fundamental reversal in the AI industry. Under pressure on the “denominator” (risk appetite/liquidity), market pricing has seriously overlooked strong growth on the “numerator” (corporate earnings), creating a significant mismatch with irrational expectations and substantially improving the risk/reward profile for medium- and long-term investment.
Core Phenomenon: A “Davis Double Whammy” Amid Extreme Sentiment!
At its core, this U.S. stock market correction is a “liquidity squeeze” and “sentiment release” driven by the convergence of multiple negative macro and micro factors.
High-frequency data: U.S. stocks have lost an average of approximately $225 billion per day over 31 consecutive trading days.
Valuation pressure: The tech sector’s forward P/E has plunged to its lowest level since the pandemic-driven market circuit breakers in March 2020.
Starting point of the narrative: The market is trying to price in pessimistic expectations for 2026–2028 ahead of time, including the disproof of AI’s return on investment (ROI), the introduction of aggressive regulations, and persistently high interest rates.
A Breakdown of the Four Drivers of Fear and Analysis of the “Expectations Gap”
Industry dynamics: CapEx (capital expenditure) surges vs. pressure on free cash flow
Market fear
Capital expenditure by giants such as Amazon, Google, Meta, and Microsoft reached a record $201.9 billion in Q3 2026 (double year over year, up 356% from Q1 2024). The market is concerned that massive infrastructure spending will consume short-term free cash flow, while the path to AI monetization remains unclear.
Counterargument (expectations gap): This is a classic timing mismatch between “short-term financial metrics and long-term industry dividends.” Historically, every technological revolution, such as the internet and cloud computing, has been accompanied by infrastructure investment made ahead of demand.
In fact, earnings have far exceeded expectations: S&P 500 earnings grew 31.9% in Q3 2026, beating expectations for 13 consecutive quarters. This shows that AI commercialization and cost reduction and efficiency gains are already tangibly boosting corporate profits. Using traditional industry DCF (discounted cash flow) models to judge tech giants in the midst of a boom reflects a tendency to apply outdated thinking.
Political dynamics: Regulatory fears and the failure of the “Trump put”
Market fear
The Democrats swept the midterm elections, disrupting the existing political balance. The market expects aggressive AI regulations or even bans in 2027.
Counterargument (expectations gap): There is a mismatch between “the bottom line of geopolitical competition and market sentiment.” The United States’ core goal is to maintain its global technological dominance. Against the backdrop of intensifying U.S.-China AI competition, a total ban or extreme restrictions on AI would amount to a strategic retreat. Future regulation is therefore more likely to “guide development” than “stifle it,” and the market has clearly overreacted in pricing policy risks.
Macro dynamics: Fed tightening and a liquidity squeeze
Market fear
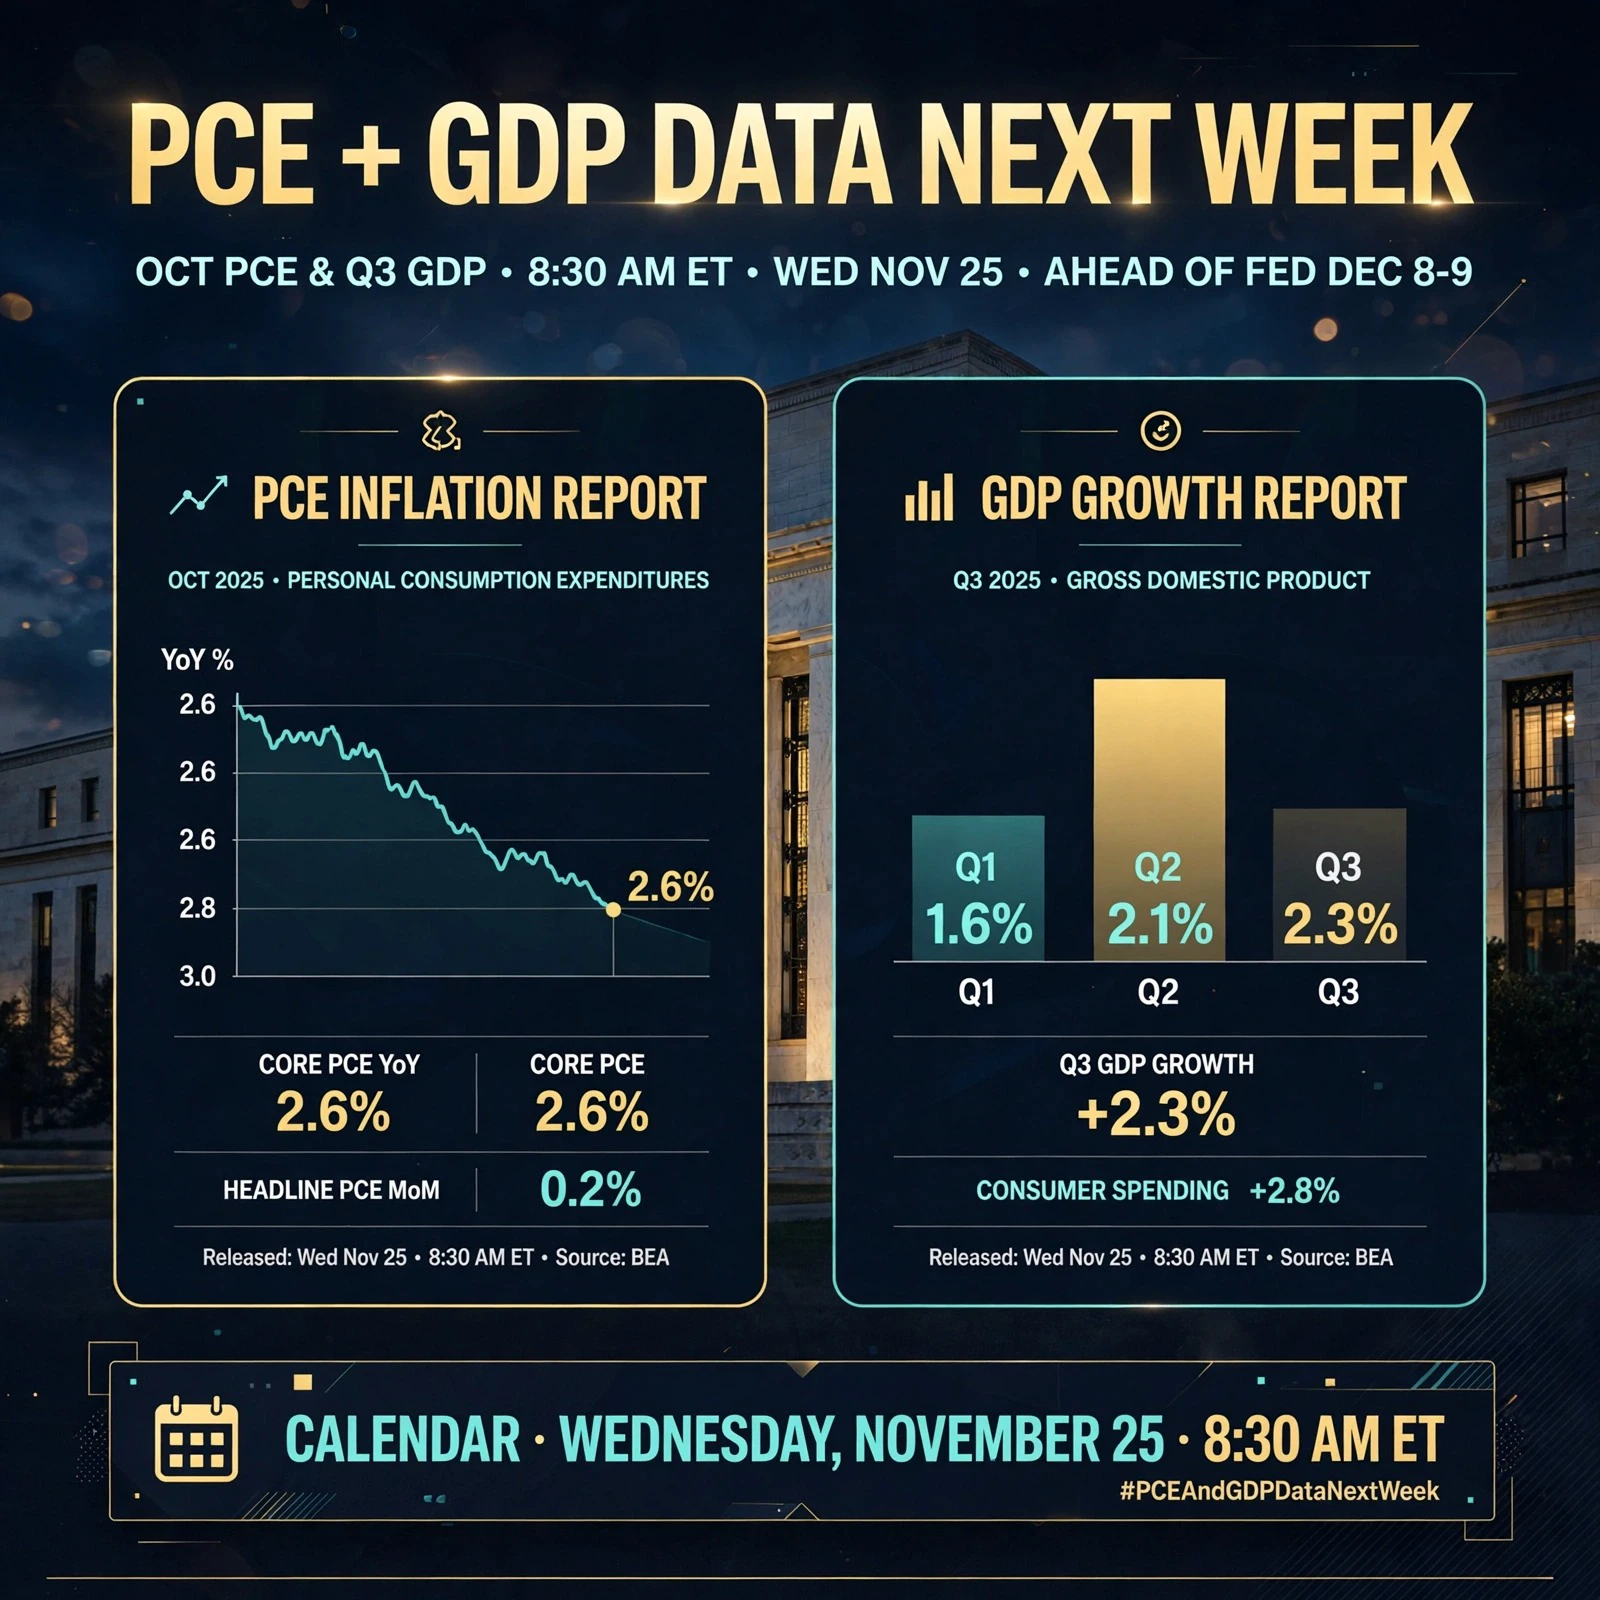
Inflation has remained above the 2% target for 67 consecutive months, and the Fed has made clear that it will fight inflation “without exception.” Alongside concerns about energy prices triggered by geopolitical conflict (the Iran war), corporate bond issuance rates have surged.
Logical assessment: Tighter liquidity is indeed the core short-term force driving valuation contraction. But with oil prices peaking and retreating (falling below $93) and geopolitical tensions easing at the margin, medium-term inflation expectations may be revised downward, leaving room for a monetary policy shift in 2027. Expectations of current liquidity tightening have already been fully, or even excessively, priced in.
Micro-level black swan: A crisis of confidence in tech leaders
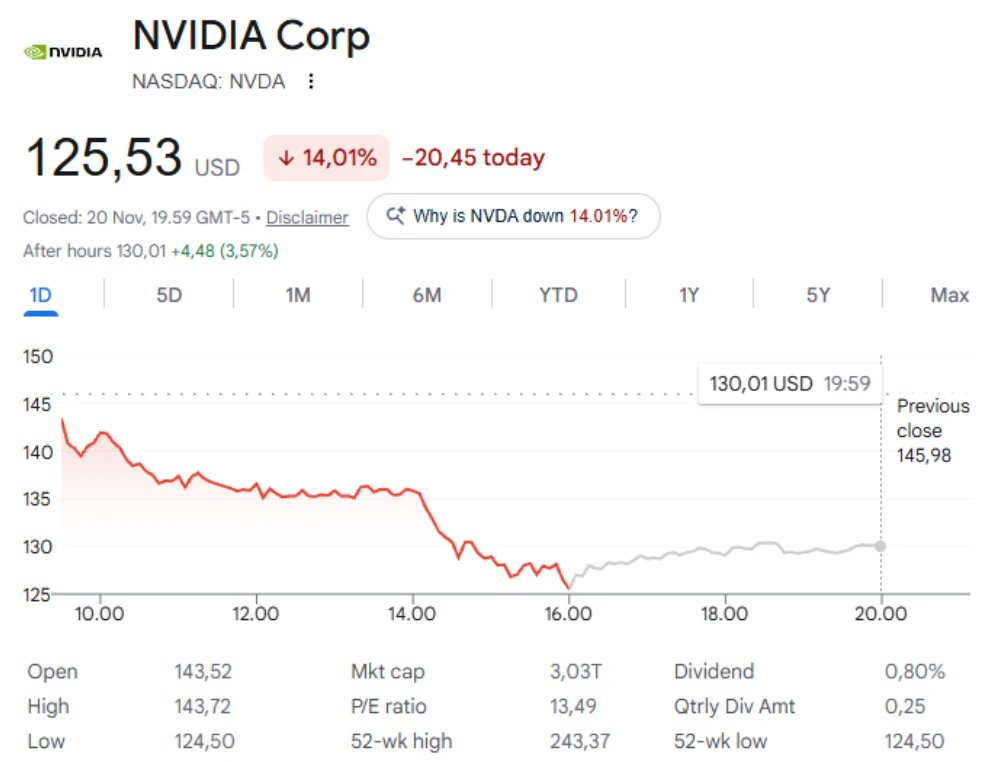
Market fear: NVIDIA’s share price has plunged sharply amid allegations and rumors, AMD has been targeted by short sellers, and confidence in the chip sector has wavered. The market has even refused to price in high-growth guidance for fiscal 2028. Counterargument (expectations gap): This is a classic case of “sentiment-driven selling” overwhelming fundamentals. Until independently confirmed by an investigation, external allegations are mostly short-term noise. The market’s complete disregard for NVIDIA’s multiyear revenue visibility shows that current pricing has entirely stripped out “growth,” shifting to an extremely pessimistic “defensive” pricing model.
Core Assessment: A Breakdown and Mismatch in the Pricing Mechanism
The core contradiction in the U.S. AI sector today is the divergence between “extremely pessimistic long-term narratives” and “strong current earnings.”
“E” (earnings) has been temporarily abandoned: The market no longer believes earnings expectations in forward P/E ratios. Whether it is 31.9% earnings growth for the S&P 500 as a whole or high revenue guidance from leading chip companies for 2028, the market is ignoring it all. This reflects trading behavior currently dominated entirely by risk aversion (risk-off). An asymmetric risk/reward profile: When the market simultaneously prices in four extreme negative scenarios—“the bursting of the industry bubble + harsh policy crackdowns + persistently tight liquidity + the downfall of industry leaders”—the potential for further declines is greatly limited. Conversely, if any one of these factors improves at the margin (such as dovish Fed comments or regulations that prove less severe than feared), the market will face a sharp upward mean reversion.
Conclusion and Allocation Recommendations
Conclusion: The sharp U.S. stock market pullback is not the result of a breakdown in the AI industry thesis, but a “liquidity capitulation” amid the convergence of multiple macro and political sentiment drivers. The market has fallen into the short-sighted trap of “seeing only short-term costs and missing long-term profits.” As the foundational technological revolution of this long cycle, AI has far from completed its transformation of the economic order. “The deepest fear often breeds the greatest opportunity”; current sentiment and valuation indicators both point to a “golden opportunity” for medium- and long-term positioning. Risk warning and allocation recommendations:
Defend against short-term volatility: Given the extreme fragility of market sentiment, beware of tail risks caused by irrational selling, such as further escalation of black swan events.
Strategic allocation: Gradually build positions on dips in core tech assets with solid earnings support and bottom-of-range valuations, particularly platform giants with strong free cash flow conversion.
Key indicators to monitor: Closely watch for the inflection point when AI capital expenditure converts into revenue (expected in the Q1/Q2 2027 earnings seasons), marginal changes in Fed inflation data, and the form taken by the new administration’s AI regulatory legislation in 2027.
The U.S. stock market has recently experienced sharp volatility. Over the past 45 days, the S&P 500 and core AI assets have suffered significant pullbacks, with market capitalization losses reaching as much as $6 trillion. Market sentiment is currently at an extreme fear level. Drawing on recent market conditions and the perspectives of leading institutions, this report breaks down the four core factors behind the latest selloff: AI capital expenditure, the political cycle, macro liquidity, and a black swan event in chips. The analysis finds that the market’s decline is driven mainly by short-term risk aversion and the linear extrapolation of pessimistic long-term expectations, rather than a fundamental reversal in the AI industry. Under pressure on the “denominator” (risk appetite/liquidity), market pricing has seriously overlooked strong growth on the “numerator” (corporate earnings), creating a significant mismatch with irrational expectations and substantially improving the risk/reward profile for medium- and long-term investment.
Core Phenomenon: A “Davis Double Whammy” Amid Extreme Sentiment!
At its core, this U.S. stock market correction is a “liquidity squeeze” and “sentiment release” driven by the convergence of multiple negative macro and micro factors.
High-frequency data: U.S. stocks have lost an average of approximately $225 billion per day over 31 consecutive trading days.
Valuation pressure: The tech sector’s forward P/E has plunged to its lowest level since the pandemic-driven market circuit breakers in March 2020.
Starting point of the narrative: The market is trying to price in pessimistic expectations for 2026–2028 ahead of time, including the disproof of AI’s return on investment (ROI), the introduction of aggressive regulations, and persistently high interest rates.
A Breakdown of the Four Drivers of Fear and Analysis of the “Expectations Gap”
Industry dynamics: CapEx (capital expenditure) surges vs. pressure on free cash flow
Market fear
Capital expenditure by giants such as Amazon, Google, Meta, and Microsoft reached a record $201.9 billion in Q3 2026 (double year over year, up 356% from Q1 2024). The market is concerned that massive infrastructure spending will consume short-term free cash flow, while the path to AI monetization remains unclear.
Counterargument (expectations gap): This is a classic timing mismatch between “short-term financial metrics and long-term industry dividends.” Historically, every technological revolution, such as the internet and cloud computing, has been accompanied by infrastructure investment made ahead of demand.
In fact, earnings have far exceeded expectations: S&P 500 earnings grew 31.9% in Q3 2026, beating expectations for 13 consecutive quarters. This shows that AI commercialization and cost reduction and efficiency gains are already tangibly boosting corporate profits. Using traditional industry DCF (discounted cash flow) models to judge tech giants in the midst of a boom reflects a tendency to apply outdated thinking.
Political dynamics: Regulatory fears and the failure of the “Trump put”
Market fear
The Democrats swept the midterm elections, disrupting the existing political balance. The market expects aggressive AI regulations or even bans in 2027.
Counterargument (expectations gap): There is a mismatch between “the bottom line of geopolitical competition and market sentiment.” The United States’ core goal is to maintain its global technological dominance. Against the backdrop of intensifying U.S.-China AI competition, a total ban or extreme restrictions on AI would amount to a strategic retreat. Future regulation is therefore more likely to “guide development” than “stifle it,” and the market has clearly overreacted in pricing policy risks.
Macro dynamics: Fed tightening and a liquidity squeeze
Market fear
Inflation has remained above the 2% target for 67 consecutive months, and the Fed has made clear that it will fight inflation “without exception.” Alongside concerns about energy prices triggered by geopolitical conflict (the Iran war), corporate bond issuance rates have surged.
Logical assessment: Tighter liquidity is indeed the core short-term force driving valuation contraction. But with oil prices peaking and retreating (falling below $93) and geopolitical tensions easing at the margin, medium-term inflation expectations may be revised downward, leaving room for a monetary policy shift in 2027. Expectations of current liquidity tightening have already been fully, or even excessively, priced in.
Micro-level black swan: A crisis of confidence in tech leaders
Market fear: NVIDIA’s share price has plunged sharply amid allegations and rumors, AMD has been targeted by short sellers, and confidence in the chip sector has wavered. The market has even refused to price in high-growth guidance for fiscal 2028. Counterargument (expectations gap): This is a classic case of “sentiment-driven selling” overwhelming fundamentals. Until independently confirmed by an investigation, external allegations are mostly short-term noise. The market’s complete disregard for NVIDIA’s multiyear revenue visibility shows that current pricing has entirely stripped out “growth,” shifting to an extremely pessimistic “defensive” pricing model.
Core Assessment: A Breakdown and Mismatch in the Pricing Mechanism
The core contradiction in the U.S. AI sector today is the divergence between “extremely pessimistic long-term narratives” and “strong current earnings.”
“E” (earnings) has been temporarily abandoned: The market no longer believes earnings expectations in forward P/E ratios. Whether it is 31.9% earnings growth for the S&P 500 as a whole or high revenue guidance from leading chip companies for 2028, the market is ignoring it all. This reflects trading behavior currently dominated entirely by risk aversion (risk-off). An asymmetric risk/reward profile: When the market simultaneously prices in four extreme negative scenarios—“the bursting of the industry bubble + harsh policy crackdowns + persistently tight liquidity + the downfall of industry leaders”—the potential for further declines is greatly limited. Conversely, if any one of these factors improves at the margin (such as dovish Fed comments or regulations that prove less severe than feared), the market will face a sharp upward mean reversion.
Conclusion and Allocation Recommendations
Conclusion: The sharp U.S. stock market pullback is not the result of a breakdown in the AI industry thesis, but a “liquidity capitulation” amid the convergence of multiple macro and political sentiment drivers. The market has fallen into the short-sighted trap of “seeing only short-term costs and missing long-term profits.” As the foundational technological revolution of this long cycle, AI has far from completed its transformation of the economic order. “The deepest fear often breeds the greatest opportunity”; current sentiment and valuation indicators both point to a “golden opportunity” for medium- and long-term positioning. Risk warning and allocation recommendations:
Defend against short-term volatility: Given the extreme fragility of market sentiment, beware of tail risks caused by irrational selling, such as further escalation of black swan events.
Strategic allocation: Gradually build positions on dips in core tech assets with solid earnings support and bottom-of-range valuations, particularly platform giants with strong free cash flow conversion.
Key indicators to monitor: Closely watch for the inflection point when AI capital expenditure converts into revenue (expected in the Q1/Q2 2027 earnings seasons), marginal changes in Fed inflation data, and the form taken by the new administration’s AI regulatory legislation in 2027.