Share your thoughts
placeholder
Article
Everyone’s staring at the 4H floor, but $HOME /USDT just armed a trapdoor at 0.00609—are you long enough to fall through it?

$HOME /USDT - SHORT

Trade Plan:
Entry: 0.00608 – 0.00610
SL: 0.00620
TP1: 0.00601
TP2: 0.00595
TP3: 0.00586

Why this setup?
Why now? The daily trend is already bearish, and this 4H signal is screaming SHORT with a 95% confidence score.
- RSI on the 15m is at 44.89—weak, no bounce fuel left.
- Entry zone 0.00608–0.00610 is a magnet; if we lose 0.00609, TP1 at 0.00601 is a formality.
- ATR (1h) is tight at 0.000047—the squeeze is primed for a sharp drop, not a
HOME+1.00%
A few days ago, I was still calculating whether I had enough money for instant noodles this month; this morning, I was already wondering whether to add sausage. While everyone else was rushing in, I kept watching the chart and repeatedly confirming that there were buyers at this level. $DASH It started from 39.86 and reached 67.49 in one go, with unrealized gains of +3341.81%—it feels incredible. Funds quietly entered, and the bottom range held without breaking. That’s why I held my long position. I’m taking 75% off the table now to lock in profits, moving the stop loss on the remaining 20% to
post-image
DASH+22.29%
BNB+7.68%
SOL+1.91%
Everyone’s chasing SOL longs at 103.79—but the 4h tape just whispered a different secret.

$SOL /USDT - SHORT

Trade Plan:
Entry: 103.61 – 103.97
SL: 105.50
TP1: 102.51
TP2: 101.65
TP3: 100.36

Why this setup?
Why now? The 1D is stuck in a range, not a breakout. RSI on the 15m is hot at 63.4, meaning the last push up is overbought on the low timeframe. ATR (0.71) shows quiet volatility—perfect for a liquidity sweep. Entry sits at 103.79 with TP1 at 102.51 and TP2 at 101.65. The invalid line at 102.34 is your canary: if we lose that, shorts get squeezed. But the math says downside is cleaner
SOL+1.91%
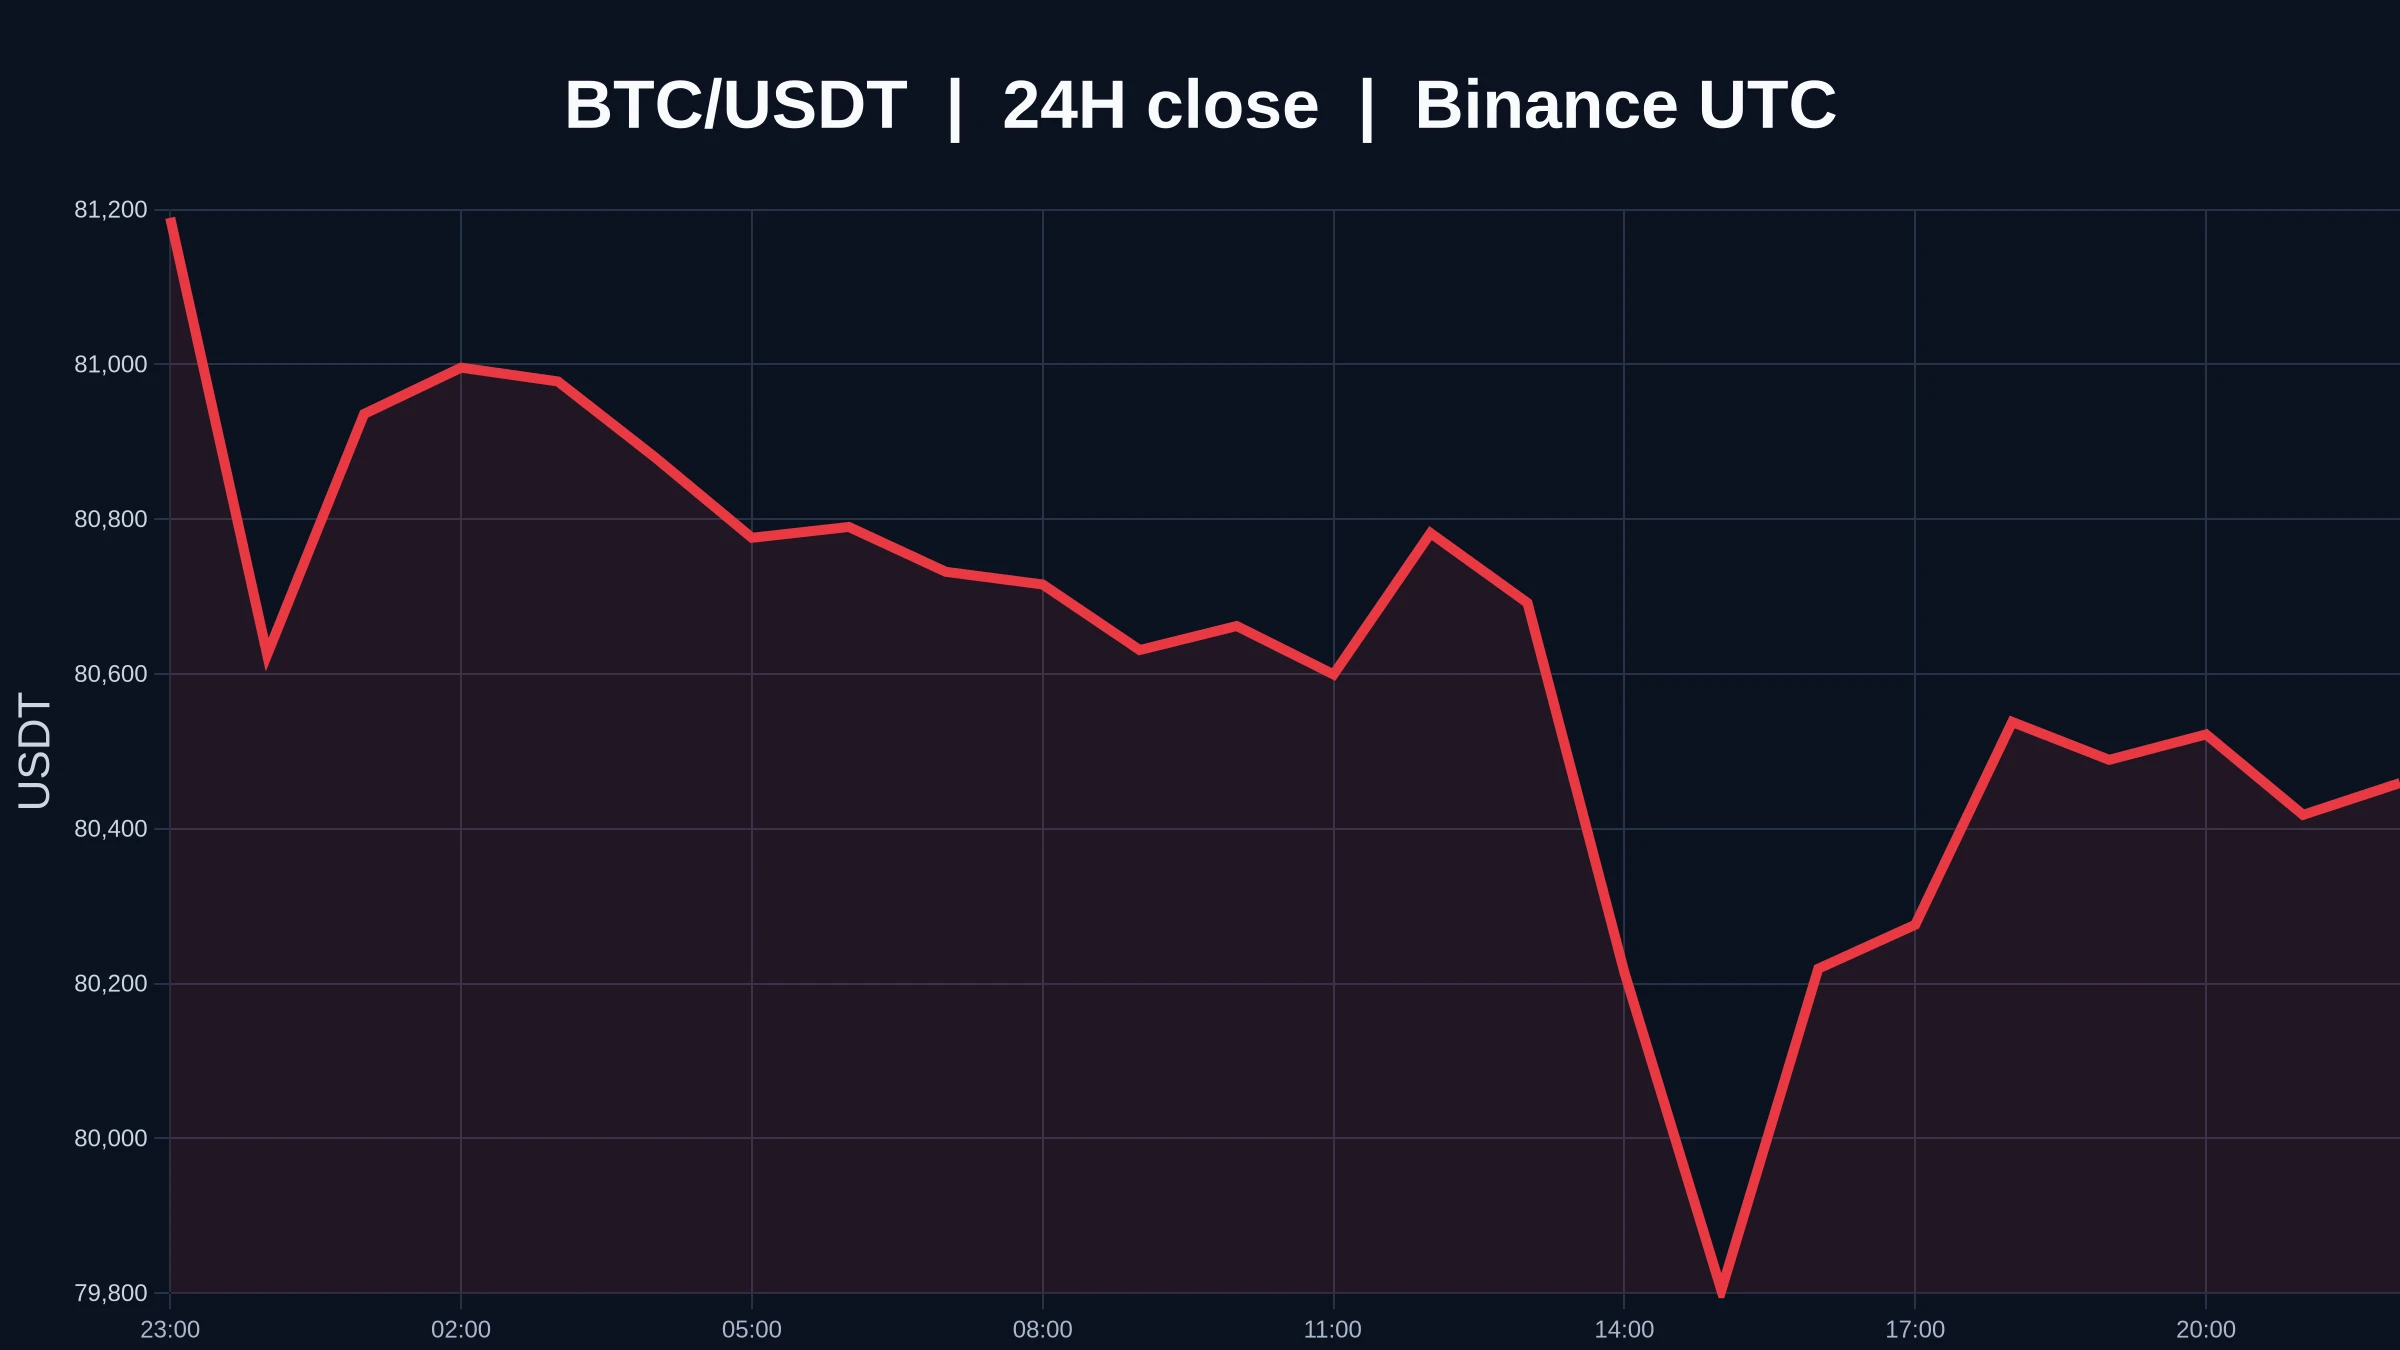
The direction was right, and people hand you money even while you lie down. A few days ago before bed, the market had not fully started moving yet. I noticed the pullback gradually reclaiming key levels, while funds quietly entered without disturbing the candlesticks—clearly an accumulation move. After making the judgment, I placed an order directly at 77967.8 before bed. When I got up in the morning, it had steadily reached 80036.3, $BTC directly delivering +461.72%. The position adjustments have been made: prioritize taking profit on 75% to lock in gains, and move the remaining 20% up to br
post-image
BTC+0.17%
BNB+7.68%
SNDK+3.22%
CHIPS: South Korean exports are accelerating as the global semiconductor boom continues.
Strong demand for memory chips and AI-related hardware is becoming a major driver for the country’s export growth, highlighting how the AI investment cycle is spreading through the global economy.
$NVDA $BTC
#Gate60MillionUsers
post-image
NVDA+0.87%
BTC-2.35%
  • 11
Everyone’s staring at $H /USDT’s rebound, but the 4-hour chart is screaming something they refuse to hear.

$H /USDT - SHORT

Trade Plan:
Entry: 0.07669 – 0.07743
SL: 0.08062
TP1: 0.07439
TP2: 0.07261
TP3: 0.06995

Why this setup?
- RSI (15m) at 37.93: Momentum is *still* underwater—not oversold enough to fake a bounce.
- ATR (1h) at 0.001482: Volatility is contracting, which often precedes a violent flush, not a reversal.
- Daily trend: bearish, and price sits below the 1D pivot—this is a “sell the rip” setup, not a bottom.
- Entry zone 0.07706–0.07743 is the last stand before TP1 at
H-4.47%
This bag I held rugged and now it’s 300% up from entry
Never sell a rugged token, especially when you got em cheap.
You’ll never know when it goes up diabolically.
Regardless, Robinhood will change our lives 🚀
post-image
HOOD-2.12%
$SOL Signal】Long on 1H spike followed by pullback support
$SOL 1H surged to 104.37 before falling back to 103.86. RSI 1H at 63.78 is not overbought, while the 4H MACD histogram continues to expand. Buy limit orders in the order book are actively providing support, funding rate is 0.0032%, and OI is stable.
🎯Direction: Long
⚡Entry/Limit order: 103.5584 - 103.8700
🛑Stop-loss: 102.8313
🚀Target 1: 105.4281
🚀Target 2: 106.2071
🛡️Trade management:
- Execution strategy: Take 50% off at Target 1 and move the stop-loss up to breakeven. If the price falls back to the entry level, exit automaticall
post-image
SOL+1.91%
ONDO’s 95% confidence signal just flashed—but the RSI says we’re early. Who’s front-running?

$ONDO /USDT - LONG

Trade Plan:
Entry: 0.3673 – 0.3691
SL: 0.3594
TP1: 0.3748
TP2: 0.3792
TP3: 0.3859

Why this setup?
- 4H bias is LONG with 95% confidence; 1D trend remains bullish—strength in the higher frame.
- Entry ref at 0.3682, tight zone (0.3673–0.3691), while 15m RSI sits at 44.78—cooling off, not oversold.
- TP1 (0.3748) is only 1.8% away; TP2 (0.3792) and TP3 (0.3859) reward patience.
- Stop at 0.3594 gives a clean 2.4% risk for a 4.8% first target—2:1 from the jump.
- Why now?
ONDO+3.98%
$SOL Signal】1H breakout + fund flow confirmation
$SOL The 1H candlestick broke through 104.37, with volume expanding simultaneously. The MACD bullish histogram continues to expand, RSI is hovering around 58, and the funding rate remains normal at 0.0032%. Buy orders account for 56% of the order book, with a depth imbalance of 6.07%, giving bulls the initiative. The 4H Bollinger upper band at 105.69 provides a breakout reference, while EMA20/50 support is moving higher. The current price is close to the target range.
🎯Direction: Long
⚡Entry/limit order: 103.5584 - 103.8700
🛑Stop-loss: 102.83
post-image
SOL+1.87%
BTC+0.17%
ETH+0.88%
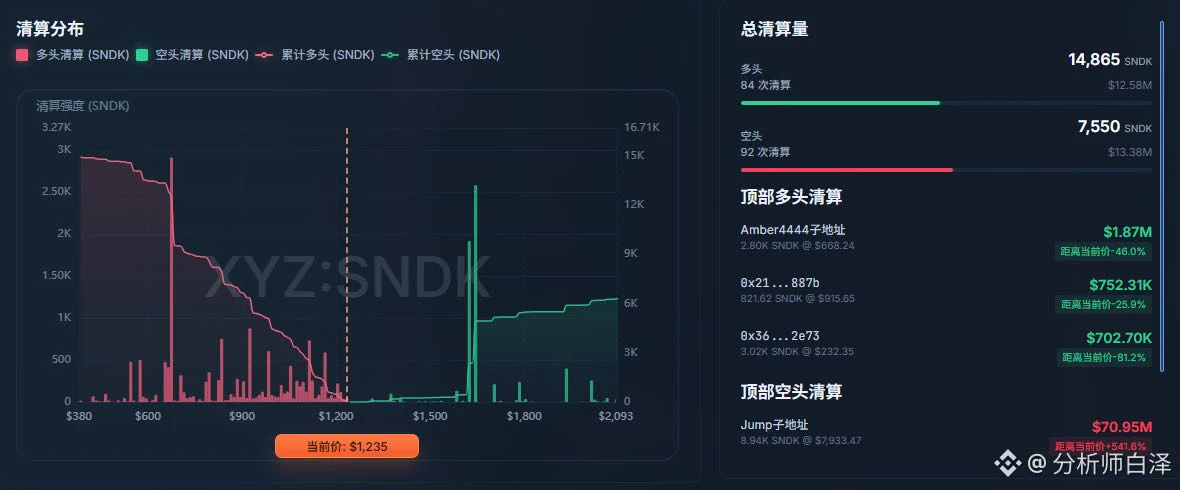
This move doesn't even require me to think—the account is dancing on its own. When the screen was all green, everyone was selling at a loss, but I didn't panic watching the market. It was bottoming without breaking support, while funds quietly entered—the signal worked better than any analysis.

$SNDK $LAB
post-image
SNDK+3.22%
LAB+1.60%
$DOGE This trade was entered during the overnight session a few days ago. At the time, the chart printed several consecutive small-bodied candlesticks, gradually moving higher, but without any obvious increase in volume or acceleration. I judged this to be a typical slow bullish advance with at least some short-term room to extend, so I opened a long position in the direction of the trend.

After entry, the price did not move straight up. It went through a period of narrow-range consolidation, with much of the unrealized profit fluctuating back and forth. It would be impossible to say my mind
post-image
DOGE+7.09%
ZEC-0.74%
XRP+1.06%
Honestly, I was stopped out of the first entry of this long position. The price plunged with a wick at the time, directly hitting my stop-loss. Watching the market pull back up, it would be a lie to say I felt nothing, but I also knew that wasn’t a reason to chase the trade—I had to wait for a second confirmation.

Later, $EDGEX retested without breaking the previous low, and buying support reappeared at the same level, so I chose to enter again. This time, I set a rule for myself: take 70% off when the price surges into the target zone, and set a protection level for the remaining 20% so I w
post-image
EDGEX+3.26%
DOGE+7.09%
XRP+1.06%
Brad cannot say a price. He is a CEO.
So he follows exactly 589 accounts.
The XRPL Foundation cannot say a price either.
So it hid 5, 8 and 9 in a picture.
589 was never a number. A password.
It is the sentence nobody in the room is allowed to say out loud.
1.3M followers is a bonus.
The most comfortable stage for shorting is when the market enters a one-way decline immediately after placing the order. With this kind of move, there is no need to keep watching the market—you can simply hold. For this move, $FLORK I waited until it rebounded to 0.028294 before entering, because it had previously broken below a short-term consolidation platform, and after a rebound confirmed the key level, it was more likely to develop into a trending move. After entry, the price did not give me many surprises, gradually declining all the way to around the current price of 0.023933, with unr
post-image
FLORK+20.39%
LAB+1.60%
SOL+1.91%
I only meant to snag a free breakfast, but the market ended up making dumplings out of me for half a year.
When $BE was grinding along around 200.9 intraday, it stayed flat long enough to nearly put me to sleep, but there was clearly buying support below and the low-volume selling couldn’t push it down. I judged that the bottom was solidified and entered a long position directly, without hesitation.
I just checked the chart, and the price has already surged to 265.1, +1537.65%. This bite of meat feels great—those already on board should have woken up laughing.
Take 80% off the table first, an
post-image
BE+7.02%
ZEC-0.74%
SNDK+3.22%
Crypto Signals and Trding Insights
live-cover
LIVE868
I originally wanted to cut my losses as a sacrifice to the heavens, but the sacrifice never happened—the meat roasted itself. When I checked the chart after lunch, $SKHYNIX was grinding around 1235.91 and testing my patience. One look at that lower wick told me everything: this was a textbook pullback holding support, with bottom-fishing bids absurdly strong.

The thinking at the time was very simple: hold as long as the key level stayed intact, and leave only if it broke. Who could have imagined it would surge straight to 1276.07 in the afternoon, sending paper profits soaring to +229.4%? T
post-image
SKHYNIX+0.69%
BTC+0.17%
SOL+1.91%
Global Stocks React to Shifting Rate Expectations as New Economic Data Arrives
live-cover
LIVE938
Altcoin Market Cap is sitting at a crucial decision zone.
A weekly close above $210B could signal a major shift in market structure and potentially mark the end of the broader altcoin bear-market phase.
Traders should watch this level closely for confirmation rather than chasing the first breakout.
$BTC $ETH $SOL
#Gate60MillionUsers
post-image
BTC-2.35%
ETH-2.49%
SOL+1.91%
  • 8
  • 1
Load More

Join 40 M users in our growing community

⚡️ Join 40 M users in the crypto craze discussion

💬 Engage with your favorite top creators

👍 See what interests you

View More