








Square
Following
Hot
News
Profile
Share your thoughts
placeholder
Article
Book a hookup and get dry sukiyaki free.
post-image
— intraday trading —
$INJ buy zone now 🟢🟢🟢
post-image
INJ-3.14%
Trenches
AGT
A
bade
b
AGT
0x5d...e274
Market Cap
$.
Change
.
24h Vol
$.
Holders
.
CNPY
C
bade
b
CNPY
0xc6...ddd2
Market Cap
$.
Change
.
24h Vol
$.
Holders
.
Gato
G
bade
b
Gato
55A3...pump
Market Cap
$.
Change
.
24h Vol
$.
Holders
.
Q
Q
bade
b
Q
0xc0...0589
Market Cap
$.
Change
.
24h Vol
$.
Holders
.
TSI
T
bade
b
TSI
AcV6...pump
Market Cap
$.
Change
.
24h Vol
$.
Holders
.
U.S. housing credit is going onchain. I’ve been watching this for a while, and the more I look at it, the more it feels off—but I can’t quite put my finger on why. NUVA’s HOME vault packages Figure’s HELOCs for retail investors. Sounds like the subprime mortgage playbook with a new coat of paint. Contract liquidity is thinnest in the early morning, and that’s exactly when they choose to wick the price. I could be wrong—just waiting to get proven wrong.
post-image
HOME-4.80%
And just like that, another chapter of @axisrobotics is coming to an end
less than 19 hours left on the Kaito campaign
if u been posting real stuff since epoch 1 i see u bro. u earned whatever is coming and i hope the rankings reflect it
good luck gng
crazy journey we started 2 months ago
see u all on TGE day, bring ur bags
post-image
KAITO-2.11%
🇸🇻 El Salvador now holds 7,807 $BTC | Worth $637M.
While the world was debating whether a “sovereign Bitcoin reserve” was smart or not, Bukele silently stacked up.
post-image
BTC+0.54%
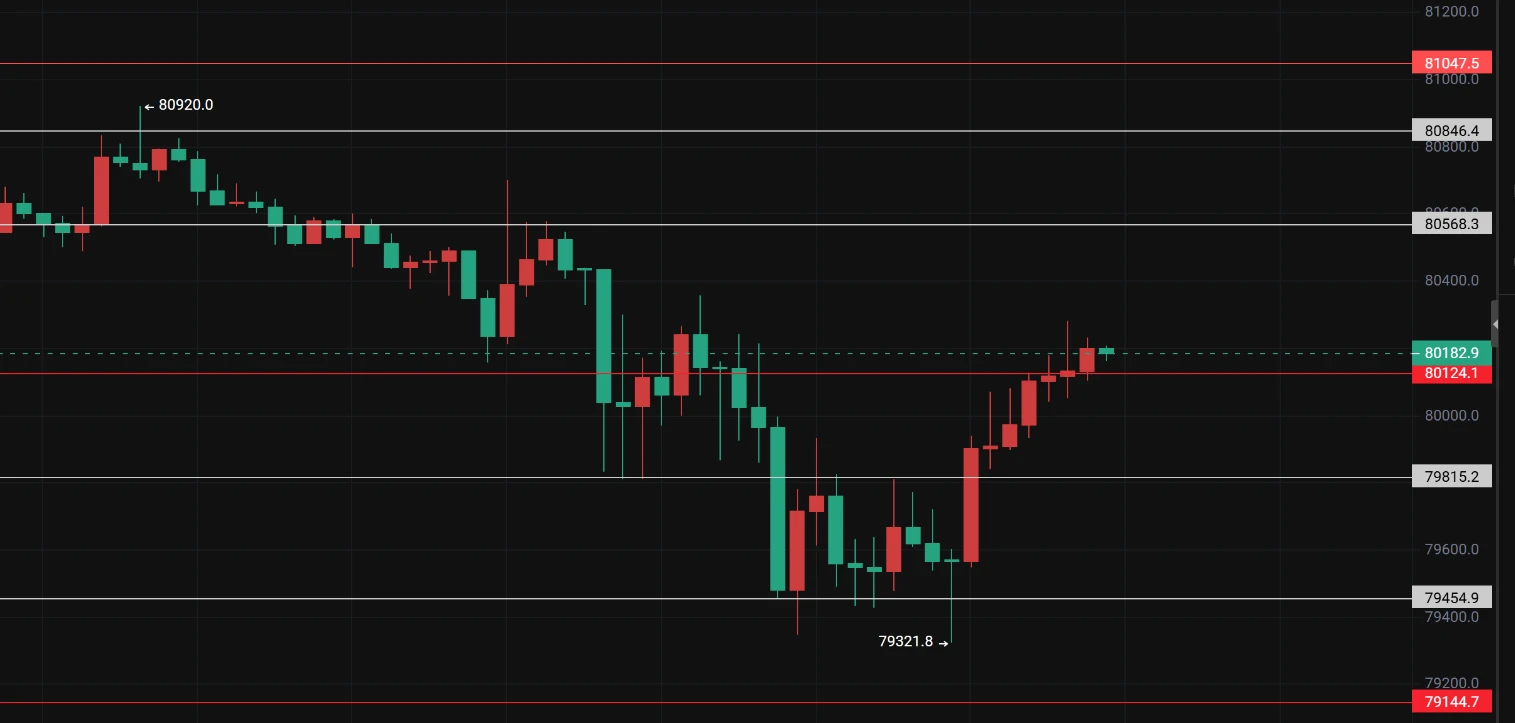
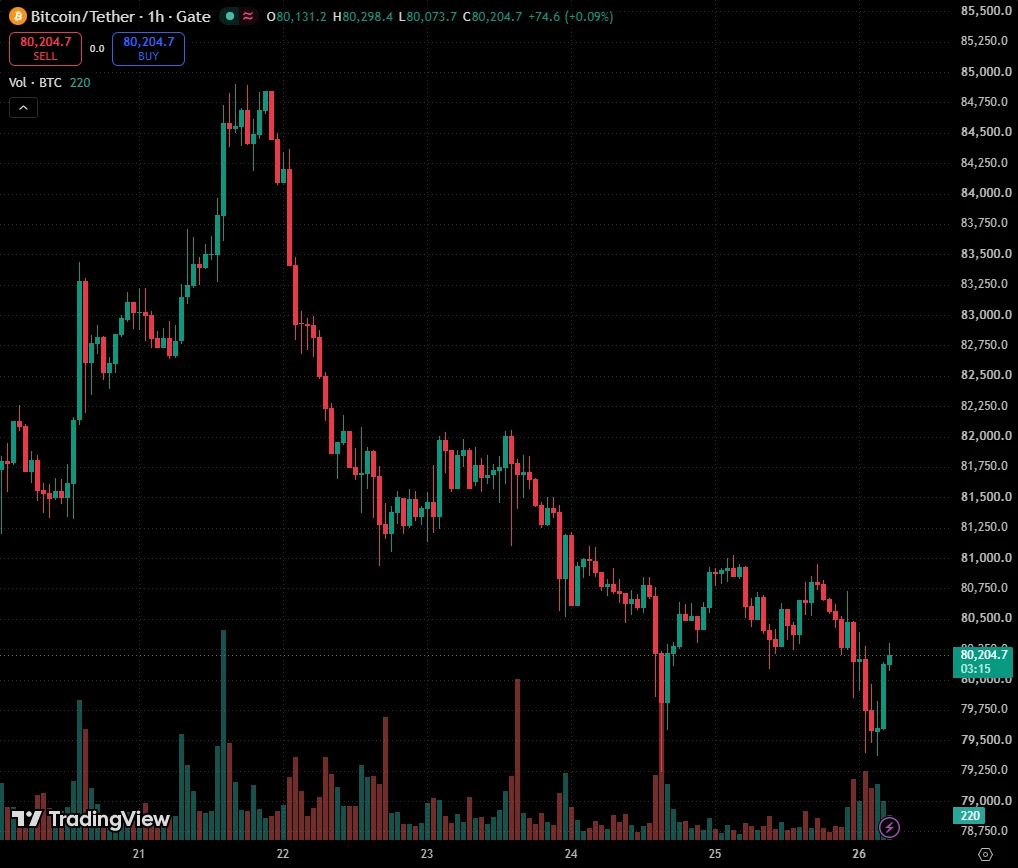
$BTC WATCH
Kalshi traders are positioning for a possible drop toward $78K this October.
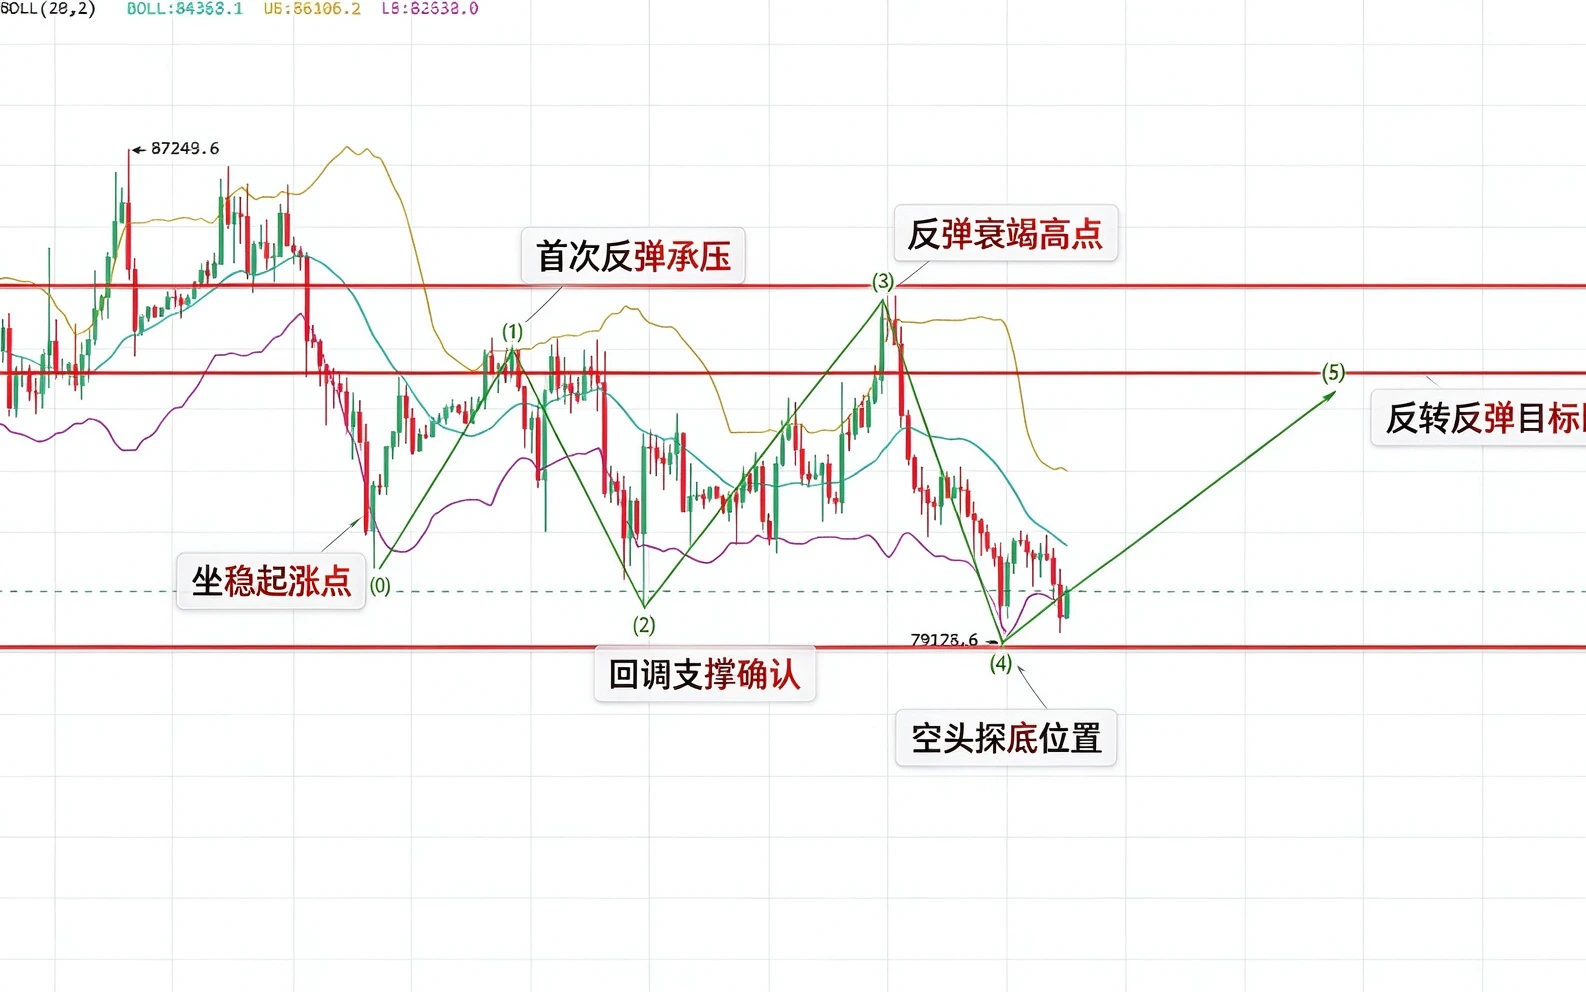
The level is worth watching, but prediction is not confirmation. BTC needs to lose key support for $78K to become a stronger downside target.
I’m watching the breakdown and volume before taking a side.
BTC+0.54%
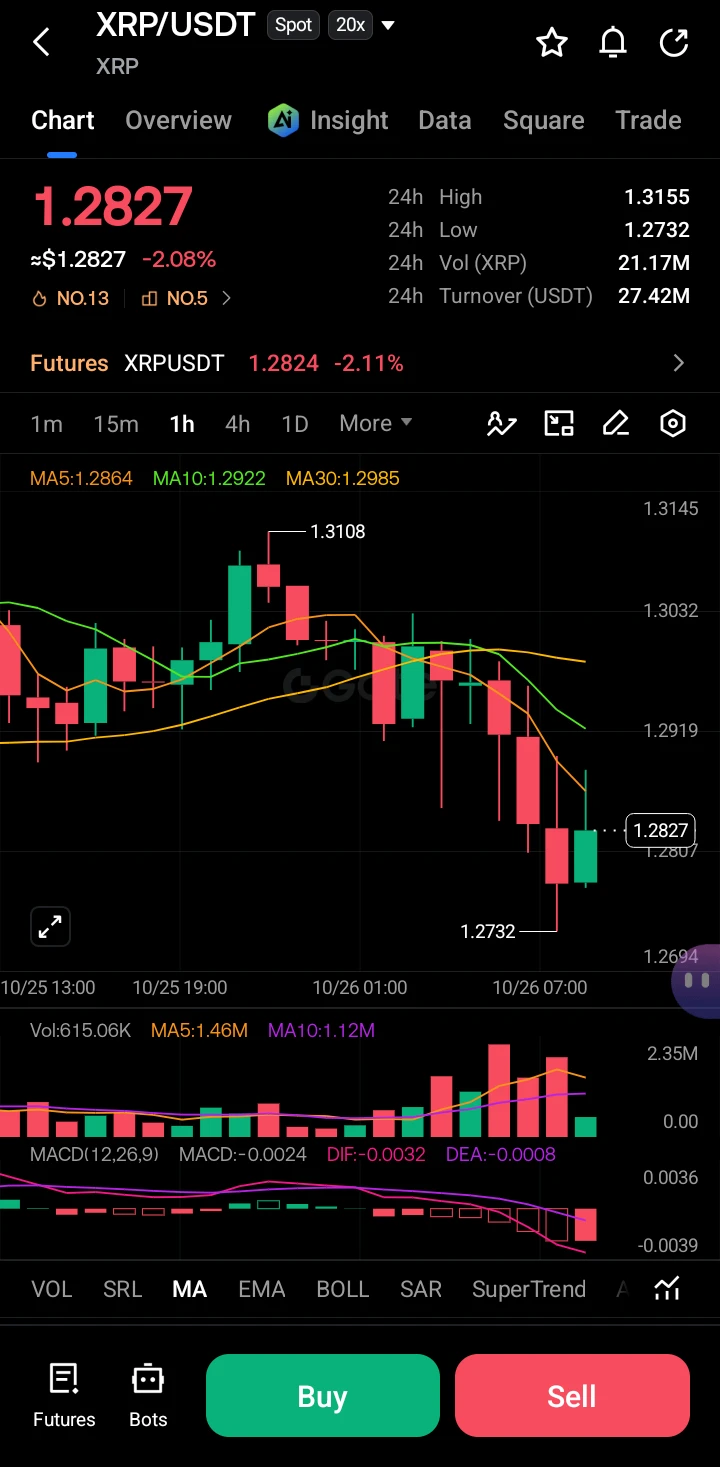
The most unusual detail in today’s market is not the gainers list itself, but the funding rate: $AVA is up 20.55% over 24 hours, yet its funding rate is -0.0036%. The price is rallying while shorts are still paying, suggesting this move is driven by spot buying or short covering rather than crowded leveraged longs. Compared with other active tokens over the same period, $XRP is down just 0.62%, with a 3.27% range; $INJ is down 3.01%, with MA5 falling below MA20; $AVA has a 30-candle range of 35.54%, making it the clear leader in volatility and market attention within the sector, with notab
post-image
AVA+18.02%
XRP-0.78%
INJ-3.14%
NEAR at $5—would you still dare to hold it?
From $6 to $5, everyone online is shouting, “NEAR is done,” but after everyone cut their losses, it rose 45% in 30 days and doubled in a year. Cross-chain swap volume topped $34 billion, the ETF is quietly accumulating, and buybacks are using real money—so is this a normal pullback in an uptrend, or the last chance to escape before the narrative tops out?
First, the surface picture: it’s down, but it hasn’t collapsed.
Down 3% in 24 hours and 5% in 7 days, with a 17% pullback from the October 12 high of $6. Sound scary? But zoom out—and it’s up 45% in
post-image
BTC+0.54%
ETH-0.79%
NEAR-3.92%
  • 2
Trader Gu Jingci: Bitcoin/Ethereum Strategy Scores a Big Win This Week
Since Bitcoin/Ethereum surged to 84300 and 2878 at the start of the week, I repeatedly advised taking short positions in the first half of the week around highs of 2550, 2520, 2480 and 84000, 83600, 83300. The market then fell all the way to around 79700 and 2313, fully maximizing the short-side gains.
Then, starting Thursday, I advised entering long positions during the pullback around 2350 and 80500, followed by short positions at 2480 and 82800. Over the past two days, the strategy was also to sell high and buy low, with
BTC+0.53%
ETH-0.83%
  • 1
Bitcoin has never stopped processing transactions, yet the market has suffered brutal crashes. The network never broke.
Every major collapse was triggered by human mistakes: centralized platforms losing customer funds, government bans, forced selling from borrowed money, and weekend panic over global headlines. The market consistently flushes out bad debt and recovers because the underlying code never failed.
post-image
BTC+0.54%
  • 1
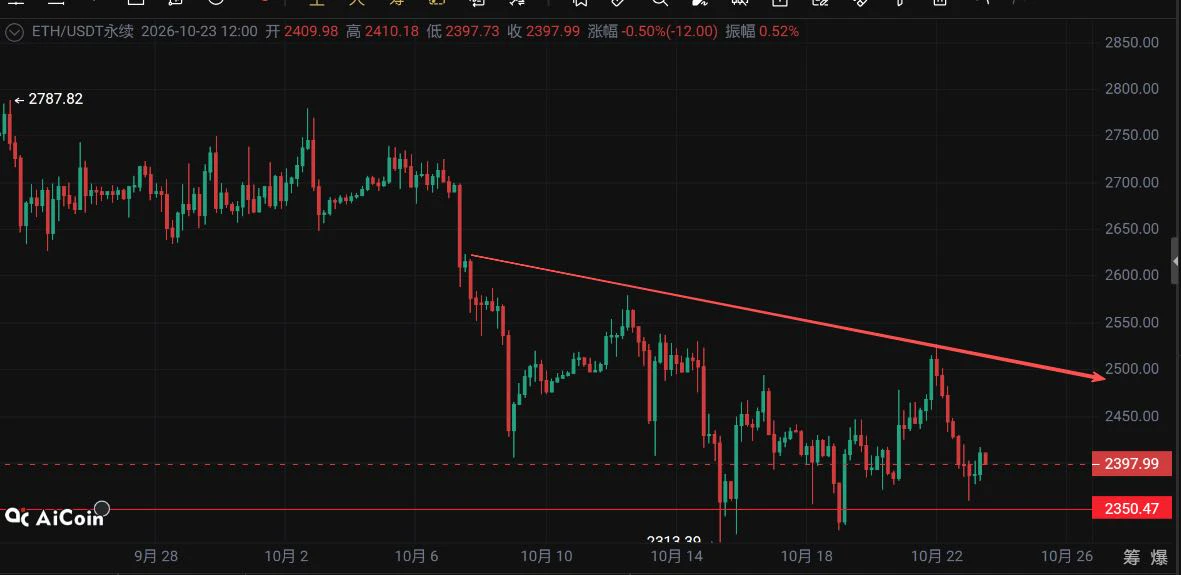
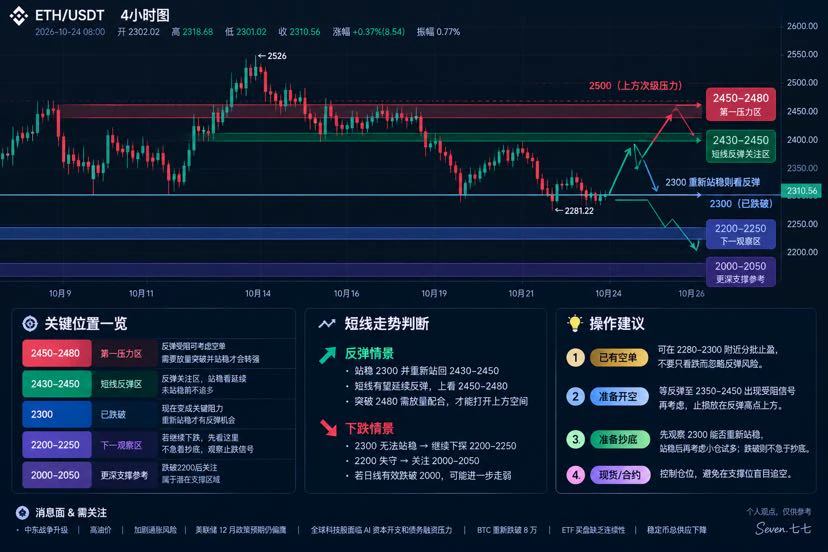
Today, ETH is dominated by a bearish range amid “weak medium-term structure + institutional outflows,” but a technical recovery is needed in the short term.
· Short term: Price is consolidating weakly in the 2400-2445 range, with MA30 (2420) and MA120 (2445) acting as successive resistance levels.
· Medium term: Four consecutive days of ETF outflows + a bearish moving average alignment point to a weak medium-term structure.
· Risk: Long leverage has not been fully flushed out. If price breaks below 2400, it may retest 2356 (the whale liquidation level) and even dip to 2350.
In one sentence: Be
ETH-0.79%
🚀 $BTC /USDT 4H Trade Setup | Now: 82,162
BTC is sitting in the middle of its range, so it's no-trade territory for now. The setup comes at the edges 👇
🔴 SHORT
Zone: 83,000–83,400 (liquidity sweep + rejection)
Stop: 84,600
Targets: 81,900 → 80,900 → 80,000
R:R ≈ 1:2.3
🟢 LONG
Zone: 80,000–80,900 (sweep + reclaim)
Stop: 79,400
Targets: 82,100 → 83,300
📌 Why these levels?
The heatmap shows big liquidation clusters at 82.5K–83.3K above and 80.9K–80K below. Lower highs on the 4H also lean bearish.
❌ Invalidation: a 4H close above 84.4K cancels the short and targets 86K–87K.
💡 Be patient, wait
BTC+0.53%
$Q It doubled in a day and still pulled back—this chart looks just like the last half hour at a farmers’ market: those who rushed in this morning are already counting their money, while anyone jumping in now could end up holding the bag.
$Q The current price is 0.1196. It hit a 24-hour high of 0.1529 before crashing back to 0.0690—a twofold swing—with $1.4 billion in trading volume. In plain English: whales are rotating positions; this isn’t a one-way ride handing out free money.
My play: don’t chase at the current price. Wait for a pullback to the 0.10–0.105 range and scale in; keep the initi
$ZEREBRO After that brutal drop, I still have 3 points of profit left on my live position to ride this out. The price is at 0.0228 now, down 24.31% in 24 hours, with 43M in trading volume. The high was 0.0301 and the low was 0.0225. I chased a long around 0.0295, failed to execute my stop-loss at 0.0268, and stubbornly held until 0.0232 before cutting half my position. The other half is now at an unrealized loss. Honestly, this trade was a complete mess: I chased the top and failed to stop out—made both mistakes.
Here’s the post-mortem: I saw volume pick up as the price broke above the previo
ZEREBRO-23.41%
Venice's programmatic VVV burns reached $145,589 in the 7 days to October 16, up 44.53% from $100,734 in the 7 days to September 18. Each new Pro, Pro+ or Max signup funds a burn of about $2 to $10.
@AskVenice
VVV-3.01%
Sunday vibe!
live-cover
LIVE62
Market Updates
live-cover
LIVE2,384
This trader bought USORU.S OIL RESERVES on base 9 months ago and made over a trillion $ according to @opensea
Goes by the name _8888_
post-image
ON+1.28%
One of the coolest places I’ve seen.
Highly recommend.
Load More

Join 40 M users in our growing community

⚡️ Join 40 M users in the crypto craze discussion

💬 Engage with your favorite top creators

👍 See what interests you

Trending Topics

USSeptemberPPIBeatsExpectations

91.35k Views1.93k Discussing

US September PPI came in at 6.3% YoY, well above the 5.3% market expectation, pointing to renewed producer-side inflation pressure. Weekly jobless claims were 199K, broadly in line with forecasts. Could hotter inflation further reduce room for rate cuts, and what does it mean for $BTC, US stocks, and gold?

GateWCTCS9GlobalTradingCompetition

37.87k Views6.76k Discussing

GateBTCAndETHFuturesVolumeRanksTop3

53.8k Views1.89k Discussing

View More