Share your thoughts
placeholder
Article
BITCOIN JUST FLASHED A BULLISH SIGNAL
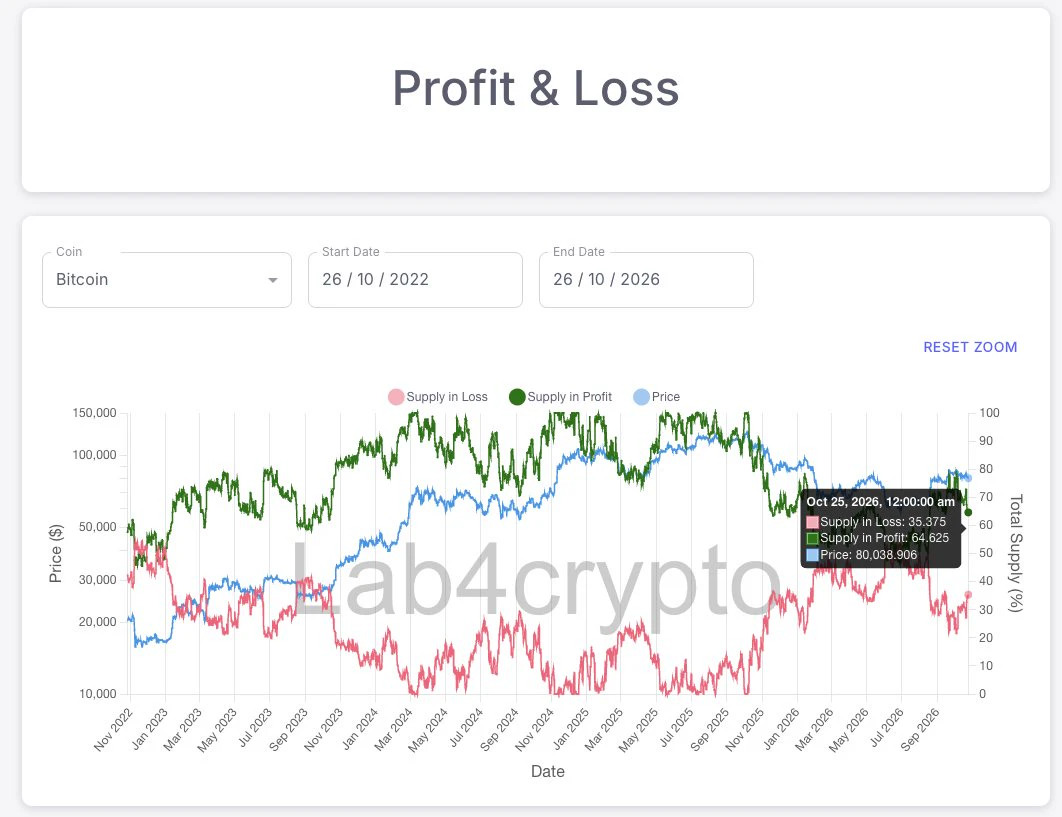
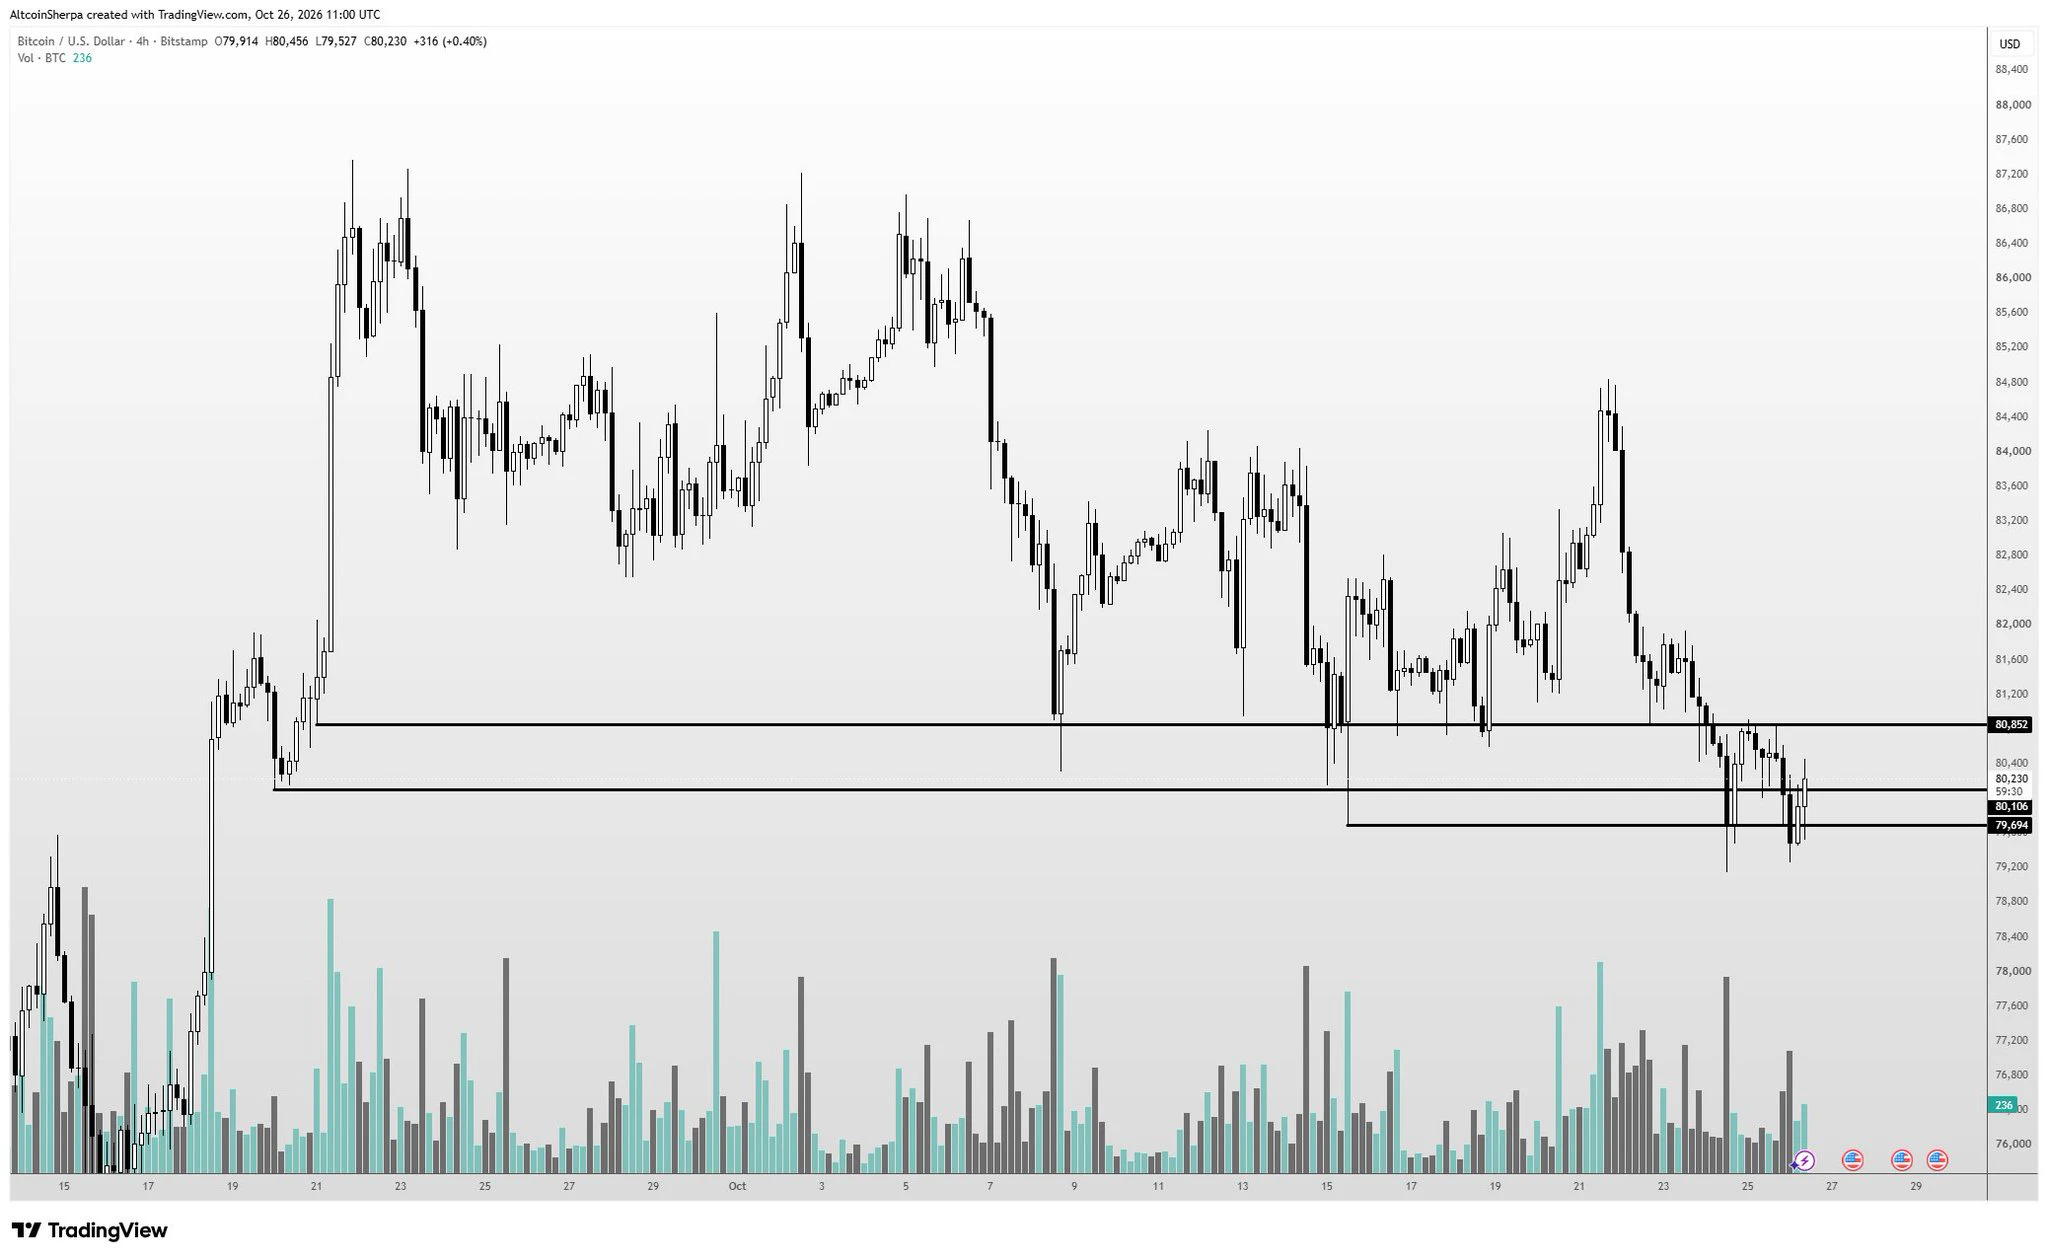
Bitcoin has formed a Golden Cross, with its 50-day moving average crossing above the 200-day moving average.
This is a technical signal that traders often watch for potential bullish momentum.
BTC is currently around $79K, with $80K acting as an important psychological level.
The big question now: Can Bitcoin break and hold above $80K? 👀
post-image
BTC-1.10%
Found a strange thing in the car; I don't know who left it behind.
post-image
Good morning, $DOGE fam! ☕️🤝🐕
Good morning, C X 🫡📈
Happy Thursday! 🐪🌞✌️
Dogecoin to the moon! 🚀🌑
post-image
DOGE-5.60%
On Wednesday, gold’s daily chart formed a large bullish candle, directly reversing the previous weak pattern of consecutive declines and turning stronger accordingly. However, note that the candlesticks are still trading below the Bollinger middle band. Even though the chart has strengthened, the upward momentum remains relatively limited. Today, continue to focus on whether the 4450 level of resistance holds!
On the 4-hour timeframe, the pattern is even more clearly range-bound, with the Bollinger Bands narrowing and the moving averages converging and intertwining. The current effective range
GT-1.37%
XAUUSD+0.33%
Apple’s foldable phone is really here.
I took a look at the price: $1,999.
Then I took another look at Apple’s stock price: -0.3%.
Hahahaha.
Sometimes the market is really quite realistic.
Before the event: The first foldable iPhone!
A new era!
The new CEO’s first big showcase!
After the event: Oh, got it.
Of course, the entire US stock market was weak yesterday. Oil broke above $100, and Treasury yields pushed higher again, so you can’t blame the phone for all of Apple’s decline.
But that actually got me thinking about a particularly important trading idea:
When a major positive catalyst that
post-image
AAPL-0.25%
  • 5
I didn’t do anything—I just went to the restroom, and when I came back, the K-line had already done the work for me. When I entered the market in the early hours a few days ago, things weren’t exactly lively, but I saw that key level holding firm without breaking. That kind of setup clearly meant someone was waiting below to buy. I opened a long position on the spot, without expecting an immediate takeoff—figuring it was fine if it took a while to develop.

When I came back, it had taken off. $LITE climbed from 881.54 all the way to 977.06, delivering a +266.87% return. That profit felt real
post-image
LITE-0.37%
XRP-2.84%
BNB-4.78%
JUST IN: A trader who added to their LAPTOP position is sitting on a 92% loss (~$227k) after a rapid price drop from $2 to $0.8. Risk-on/off signals anyone? $LAPTOP
post-image
LAPTOP-89.61%
$LINK
Ideally we LINK should not spend lot of time below 11.
At most 1-2 days and than snap back up.
If we start having multiple daily closes below 11 the target is double bottom at around 7
post-image
#BNBTreasuryStockBNCSurges50%
BNC JUST TURNED BNB TREASURY EXPOSURE INTO A MARKET TEST
CEA Industries ($BNC) has suddenly become one of the most interesting BNB-related equities to watch after a powerful repricing over just a few trading sessions.
BNC closed at $3.49 on September 4. By September 8, the stock reached an intraday high of $5.49, representing roughly a 57% move from the previous close. Trading volume exploded to approximately 65.1 million shares.
By September 9, BNC was still holding around the $5.10–$5.25 zone.
That is important because the market is no longer treating BNC like
BNB-4.70%
  • 2
Someone still hasn't given up on $LAPTOP .
After $LAPTOP crashed 98%, this guy spent $170K to "buy the dip," buying 28,448.72 $LAPTOP at $5.97.
It's now worth just $21K — down another 87%.
LAPTOP-89.61%
  • 1
September 10 ETH Analysis
Analysis: Short around 2470-2490 on a rebound, with 2510 as the defense level; first target 2440, second target 2420
On the hourly chart, the price came under pressure and pulled back from the 2522.75 swing high, then fluctuated downward and broke through successive levels, reaching a swing low of 2440.09. Bearish momentum continues to be released, with the overall trend clearly downward. Rebounds during the period have been limited, forming a typical weak downward structure. The Bollinger Bands are opening and diverging downward, with the upper and middle bands both
post-image
BTC-1.10%
Morning Market Updates
live-cover
LIVE2,068
I didn’t analyze anything—I just opened the chart and took a couple of looks, and $RECALL climbed on its own. There was still barely any movement when I checked the chart after lunch, but taking another peek now, wow, it’s got me feeling a little flattered.

I noticed it while it was grinding out a bottom intraday. After the price came down, it stopped moving and stayed flat, with volume shrinking to an extreme—that was a signal it couldn’t fall any further. It happened to hold the retest, buying pressure started picking up, and I tried a small position around 0.03696, purely because I though
post-image
RECALL+1.03%
LAB-27.77%
SNDK-0.27%
iPhone Duo, with a pair of asterisks, is absolutely amazing. I think this video does a great job of explaining why it’s the dream of people who are always watching vertical short videos and eating in front of their phones.
$BNB The price has reached an important support level and is extremely oversold. I’ve entered a long position; this is the core position, with a target price of 750. Do you think it can reach it?$INTC $TSLA #苹果发布会
BNB-4.78%
INTC0.00%
TSLA-0.30%
Pi Node Docker has just been updated to the latest version, preparing for the V27 mainnet. $PI ‌Don't look at the current price; adding to your position is the best timing. The time bomb 💣 could go off at any moment—slow work produces fine results.
PI-3.98%
  • 4
No trades, no analysis, just sheer luck—this performance is embarrassing even to talk about. When I opened the chart early in the session, I stared at the line showing $SNXX moving from 13.489 to 17.414 for several seconds: +1409.09%. I was about to curse the price action, but then I checked my account. Never mind—the market is always right😂.
Actually, while everyone else was running, I had already spotted something: each pullback was shallower than the last, there were always buyers stepping in below, and the selling pressure was losing steam with every sell-off. The bottom was clearly being
post-image
SNXX-0.62%
ETH-1.60%
SNDK-0.27%
Back then, I was lean too🤡
I could spin and jump on the hanging rope
Now when I wrap myself around the rope
it’s like tying up a fucking pig🤡
post-image
new update 🥰🌹
live-cover
LIVE1,720
Load More

Join 40 M users in our growing community

⚡️ Join 40 M users in the crypto craze discussion

💬 Engage with your favorite top creators

👍 See what interests you