


Square
Following
Hot
News
Notifications
Profile
Share your thoughts
placeholder
Article
$EVAA Almost 7x now, keep holding and wait for 10x
EVAA-0.49%
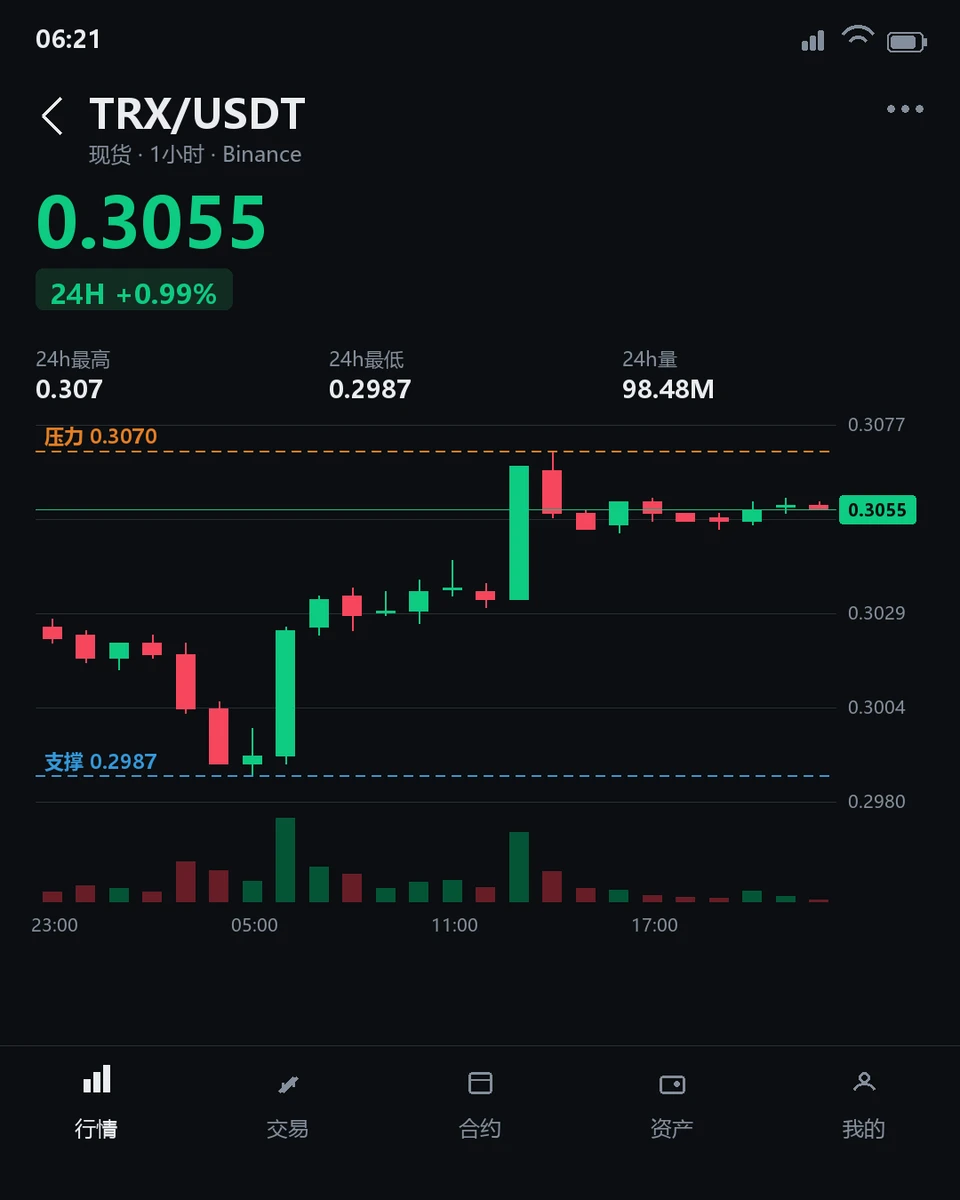
$TRX Is Strong in the Short Term but Weak on the 4-Hour Chart—Which Will Turn First?
$TRX is currently trading at 0.3055, up 0.958% over the past 24 hours, with an intraday range of 0.2987–0.307. The 1-hour chart shows strength, with the price above the EMA20 at 0.30456. The RSI14 is 67.53, in neutral-to-bullish territory, but the volume ratio is just 0.21, far below average, indicating limited participation from short-term buyers. The 4-hour chart remains weak: the price is still below the EMA20 at 0.30594, and the RSI14 at 37.21 has yet to recover from weak territory. Resistance is far above
post-image
TRX+0.42%
Trenches
IDOL
I
bade
b
IDOL
0x3b...ab07
Market Cap
$.
Change
.
24h Vol
$.
Holders
.
PIEVERSE
P
bade
b
PIEVERSE
0x0e...25a9
Market Cap
$.
Change
.
24h Vol
$.
Holders
.
FIONA
F
bade
b
FIONA
B34n...pump
Market Cap
$.
Change
.
24h Vol
$.
Holders
.
Singularity
S
bade
b
Singularity
7R4M...pump
Market Cap
$.
Change
.
24h Vol
$.
Holders
.
CLAUDIA
C
bade
b
CLAUDIA
2j5S...W2ZM
Market Cap
$.
Change
.
24h Vol
$.
Holders
.
#NvidiaDropsNearly14Percent
NVIDIA's $115.8 Billion Earnings Beat Could Not Stop the Selloff: What Is Wall Street Really Pricing In?

NVIDIA has delivered another historic quarter, but its stock has entered a completely different battle. The company is generating extraordinary revenue, expanding its AI infrastructure business and preparing its next generation of computing platforms. Yet investors are selling aggressively, exposing a growing disconnect between corporate performance and financial-market expectations.

The latest trading session on November 20 brought a particularly sharp warnin
NVDA-13.84%
$BLESS ’s short opportunity is here—the 1-hour downtrend isn’t over yet, and the price has already fallen below MA25 on the 15-minute chart. It’s the right time to short with the trend. The breakdown was clean and decisive, delivering a 246% gain—profits secured.
The two assets to watch closely today: $DODOX and XRP.
$BLESS remains bearish, with a tighter stop-loss. Entry range: 0.012807–0.012905; take-profit targets: 0.01210–0.0115; stop-loss at 0.013292. This rebound is weak and is most likely a bull trap ahead of the next sell-off, so bears have reason to be optimistic.
But stay alert: if
post-image
314
314314
Pump.Fun
MC:$2.19KHolders:1
0%
BLESS-2.00%
🔹 BTC falls below 58,000 USDT, down 7.75 in 24 hours
live-cover
LIVE51
SPCX-7.38%
TSLA-7.56%
NVDA-13.84%
$ARG
ARG Explodes To $0.15392, Up +176.08% - Fan Coin Goes Vertical

Price 0.15392, +176.08%. 24h High 0.19504, 24h Low 0.05132. 24h Vol 86.89M ARG, Turnover 9.24M. EMA5 0.12504, EMA10 0.09989, EMA30 0.06965. Chart Low 0.04333. VOL 12.68M, MA5 Vol 12.34M, MA10 Vol 10.28M. MACD 0.01150, DIF 0.02119, DEA 0.00968. Today +116.73%, 7 days +238.21%, 30 days +145.17%, 90 days +117.52%, 180 days -61.08%, 1 year -78.66%. NO.1, NO.8.

ARG is the Argentina Football Association Fan Token. Aim is to give fans a voice and a closer link to the team they love. Holders can vote in polls, unlock rewards, get a
discovery
$ARG
ARG Explodes To $0.15392, Up +176.08% - Fan Coin Goes Vertical
Price 0.15392, +176.08%. 24h High 0.19504, 24h Low 0.05132. 24h Vol 86.89M ARG, Turnover 9.24M. EMA5 0.12504, EMA10 0.09989, EMA30 0.06965. Chart Low 0.04333. VOL 12.68M, MA5 Vol 12.34M, MA10 Vol 10.28M. MACD 0.01150, DIF 0.02119, DEA 0.00968. Today +116.73%, 7 days +238.21%, 30 days +145.17%, 90 days +117.52%, 180 days -61.08%, 1 year -78.66%. NO.1, NO.8.
ARG is the Argentina Football Association Fan Token. Aim is to give fans a voice and a closer link to the team they love. Holders can vote in polls, unlock rewards, get access to perks, and join fan events. Focus is on passion, not just price, so the coin moves when fan buzz spikes.
Why did it explode? First, huge base, ARG sat near 0.04333 for days, then broke out. Second, price sits far over all EMAs, trend is strong. Third, volume stayed hot, VOL 12.68M vs MA5 12.34M shows buyers still in. Fourth, MACD is positive, DIF 0.02119 over DEA 0.00968, so bulls lead. Fifth, fan hype, when the Argentina side trends, this coin is the first place fans look.
Limits, re-checked from the chart. Price sits over all EMAs. Support: S1 0.12504 EMA5, S2 0.09989 EMA10, S3 0.06965 EMA30, S4 0.05132 24h Low, S5 0.04333 Chart Low. Resist: R1 0.19504 24h High, R2 0.21988 grid high. If S1 holds, R1 is next. If S1 breaks, S2 then S3 come fast. A clean close over R1 would open R2. This is a fast coin, so moves both ways can be sharp.
Bottom line, short move is vertical fan breakout, long theme is still fan power and rewards. Watch S1 support and R1 breakout.
This text is for info only, not a buy or sell idea.
#ARG #FanTokenFire
#ShareWeekly #WCTCS9
$ASR ‌$OG ‌$INTER ‌ ‌
repost-content-media
ASR-1.24%
OG+0.11%
Everyone is waiting for a pullback, but $SKYAI keeps climbing. Is anyone actually buying these coins, or are we all just watching from the sidelines? TP: 0.04030SL: 0.03528Other coins:
$BTC : Current price 60,387.4 - 24-hour change: +1.84%
$YB : Current price 0.05398 - 24-hour change: +12.69%
post-image
SKYAI-7.58%
BTC-0.67%
YB+2.91%
$IDOL I chased in, and didn't expect it to go up again.
IDOL-6.71%
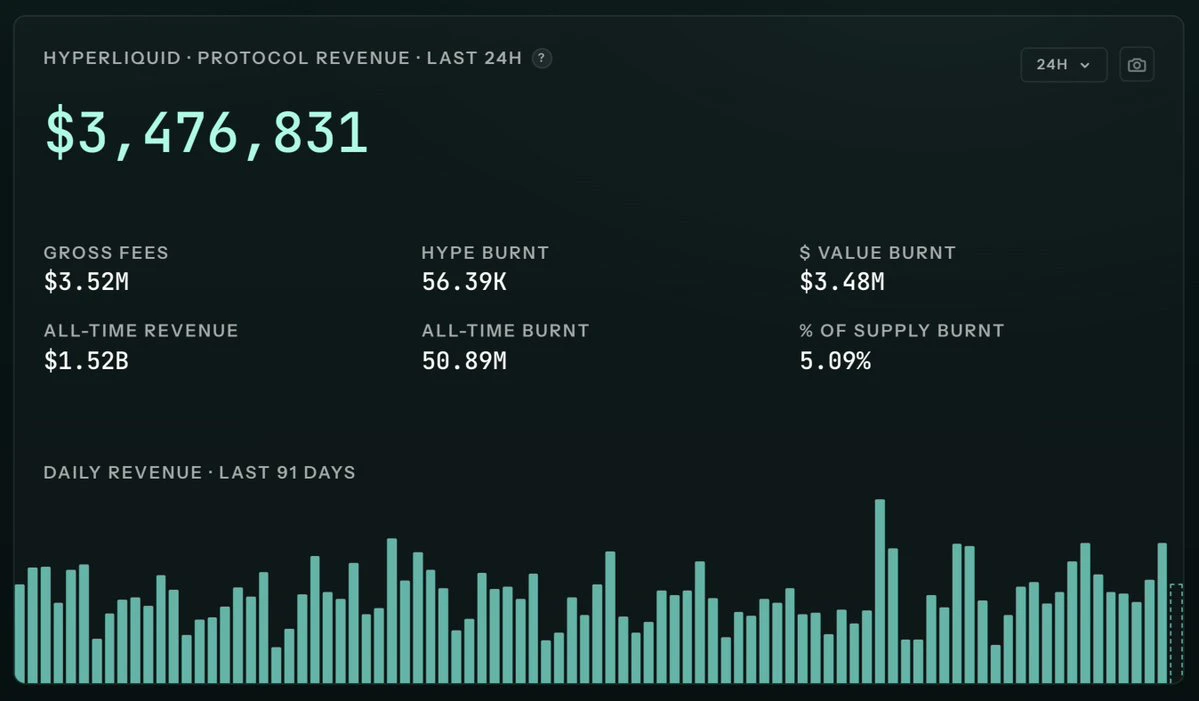
$HYPE is down 40%, but hyperliquid still makes $3M+ a day in revenue
what is zcash doing these days
post-image
HYPE+0.24%
ZEC+1.16%
EVAA | Long 🟢 | Bullish | 15m24h: +7.97% | Volume: 322.3M USDTLong rationale: Price above EMA200; EMA20/50/200 in bullish alignment; RSI14 at 60.6; MACD histogram positive; ADX14 at 18.5; volume at 0.69x the 20-candle average; trend pullback/continuation. Entry: 6.4238Stop loss: 6.26472Take profit 1: 6.62265 | Take profit 2: 6.74197 | Take profit 3: 6.90105For reference only; do not chase price. This strategy is invalidated if the stop-loss level is hit. Technical analysis strategy only, not investment advice.$EVAA
post-image
EVAA-0.49%
Click the link, go to the livestream section, search for “Kater Says Analysis,” and vote once for a chance to win a prize https://www.gate.com/zh/competition/Annual-Gala
  • 2
  • 1
Here's a glimpse into our portfolio! 🚀 Specializing in DeFi, yield farming, and arbitrage, we're all about uncovering alpha and opportunities. 📊 Dive into the table below! #Crypto #Trading #Portfolio #DeFi
Ready to start your journey?
post-image
Driven by active trading volume, price action continues to edge higher; despite limited overall market participation, resistance remains intact. The uptrend is showing initial momentum, but the indicators have yet to fully align, suggesting the move may stall. $AKE — Long entry: 0.005343 Take-profit 1: 0.005401 Take-profit 2: 0.005450 Stop-loss: 0.005129
post-image
AKE+6.07%
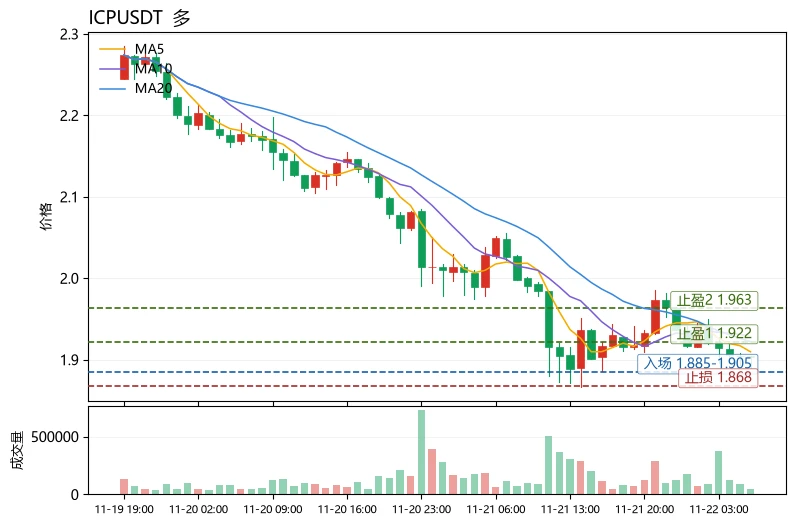
The Extreme Fear Index plunged to 12, yet $ICP fell only 6.26% and the MACD histogram remains positive—this is the most unusual detail in today's market: panic selling is underway, but bearish momentum has not expanded in tandem. Dragged down by BTC's weakness, ICP is now at 1.903, close to the lower Bollinger Band at 1.881. MA5 is below MA20 in a bearish alignment, RSI at 37.8 is nearing oversold territory, and the funding rate of -0.0041% shows shorts are paying to hold positions, indicating elevated crowding. Extreme sentiment combined with a negative funding rate often provides fertile gr
post-image
ICP-1.14%
DOT-1.51%
UNI+3.05%
For more than a month now, we’ve been witnessing history every day. It really leaves you wanting to cry, with nothing you can do about it.
The Nasdaq 100 $QQ peaked on 10/6. Since then, this past month has been packed with nothing but epic trading days.

From 10/6 to 10/16, $SOX fell for 9 consecutive trading days, dropping a total of 16.3% and tying its longest losing streak since listing.

On 10/29, $GOOGL plunged 12.64%, its biggest single-day drop since listing in 2004, wiping out around $500 billion in a single day.
On 10/30, INTC tumbled 28.58%, its worst day at least since 1980.
On 1
post-image
GOOGL+0.11%
At 2:40 p.m., I was waiting for a delivery truck outside the building materials market. A family of three nearby was picking out tiles. The man squatted down and tapped the edges, the woman compared prices on her phone, and the kid stacked the samples like building blocks. When he got to the third tile, the stack collapsed.
The kid didn’t cry. His mom said, “Use a bigger one for the base.” So he did: the big tile underneath, the smaller ones on top, steady as could be.
I watched for a while and remembered how I used to trade in my early days, stacking small bricks on top of each other. Every t
EVAA-0.49%
  • 2
  • 2
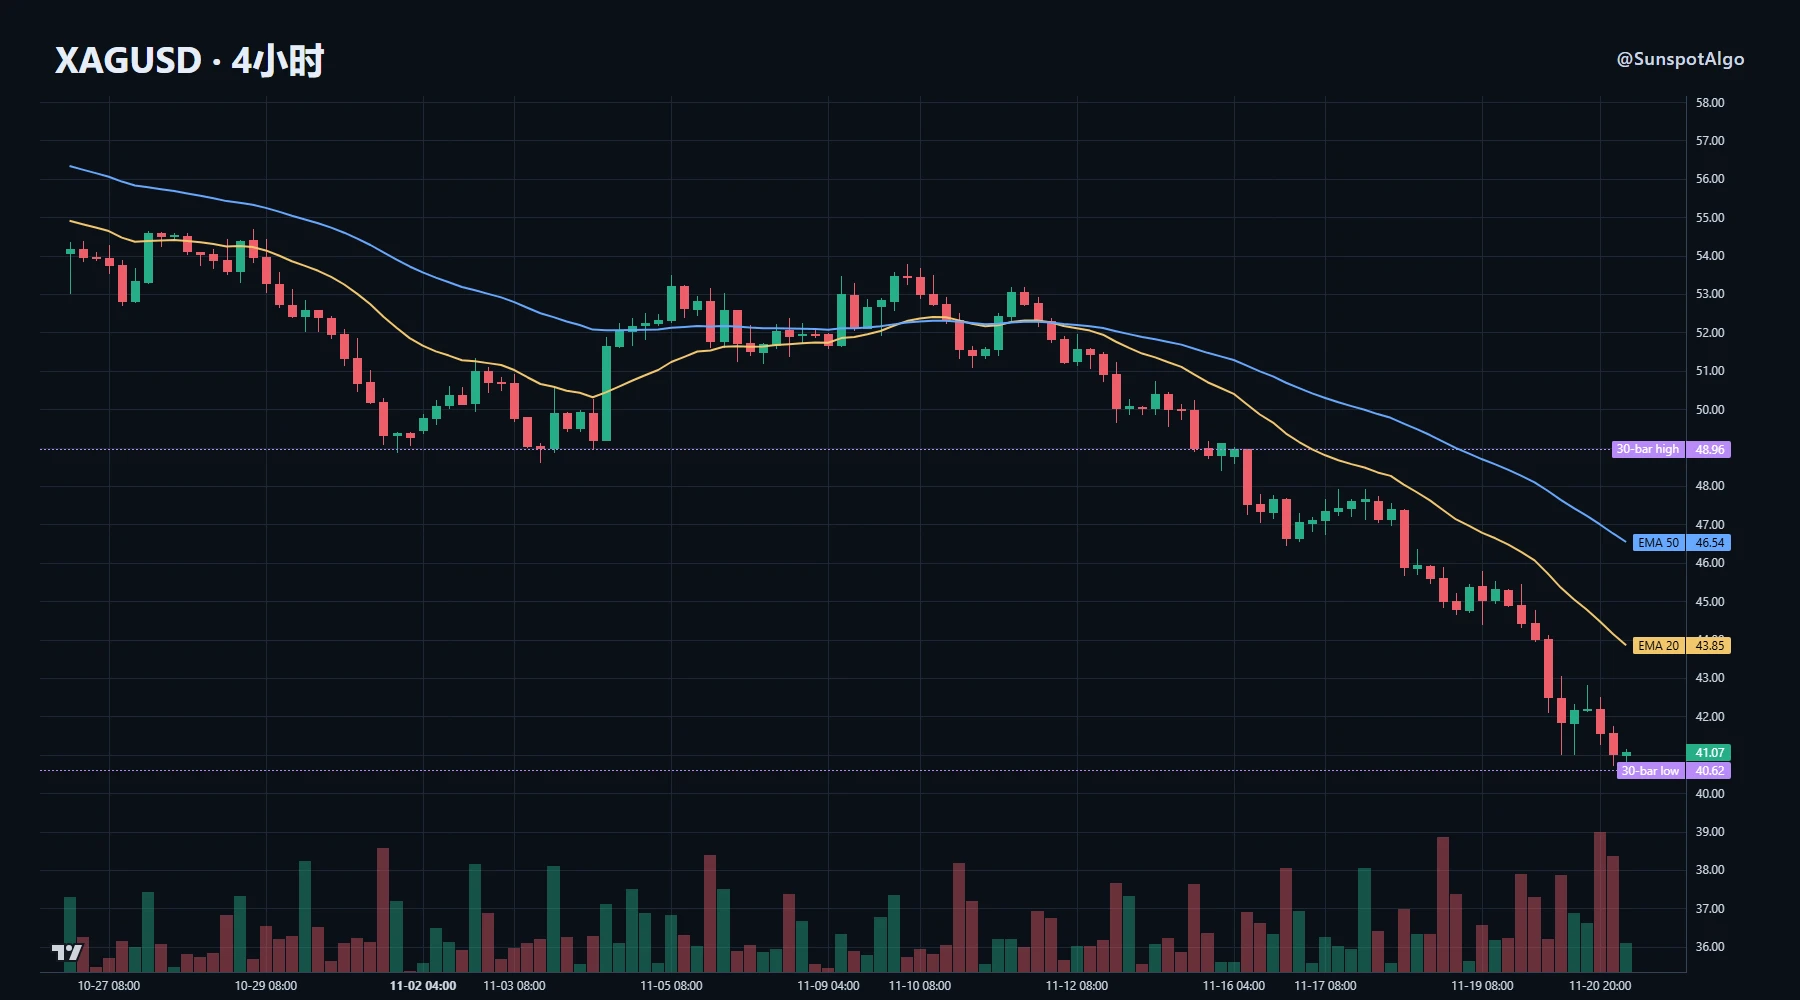
The rhythm of this silver sell-off is more noteworthy than its magnitude.

A roughly 16% drop over 5 days pushed silver to the bottom of its 30-day range at 40.9, while gold fell less than 10% over the same period. The chart’s rhythm has three notable details: the 4H 20-period moving average is at 43.9, while price is at 41.1, a deviation of over 6%; the volume ratio is 1.76, clearly indicating elevated volume; and ATR is at the 92nd percentile of the past 60 candles. The long lower wick around 40.6 was a classic stop-loss sweep: after breaking below that level, price failed to reclaim it, and
post-image
XAG+0.47%
XAU+0.38%
BTC SIDEWAYS
live-cover
LIVE77
BTC-0.67%
#CookBacksFurtherRateHikes
The Fed's Hawkish Warning Could Change the Entire Market Outlook: Bitcoin, Tech Stocks and Gold Face a New Challenge

The Federal Reserve's inflation battle is entering another critical phase, and the latest comments from Governor Lisa Cook have introduced a fresh source of uncertainty across global financial markets.

On November 20, Cook questioned whether September's 25-basis-point rate increase would be sufficient to bring inflation under control. Her warning was particularly important because she highlighted the potential consequences of delaying further action
post-image
BTC-0.65%
MU-13.88%
ANT-8.68%
  • 1
Bitcoin's $BTC bounce has reclaimed the 60k level.

Overnight, it plunged to 55,480, breaking below the July 1 low of 57,700 and setting a two-year low. It then bounced all the way back, reaching 60,400 on the morning of the 22nd, up nearly 9% from the low.

The 60k level, which had been support until it was breached the day before, has now become a battleground for bulls and bears. Breaking and reclaiming a round-number level says it all: the break brought panic, while the recovery shows that buyers stepped in below.

The unrealized gain on my position shrank from 1,154% to 478% during this
BTC-0.65%
ETH-1.23%
  • 1
Load More

Join 40 M users in our growing community

⚡️ Join 40 M users in the crypto craze discussion

💬 Engage with your favorite top creators

👍 See what interests you

Trending Topics

BTCBreaksBelow60K

2.1M Views30K Discussing

BTC fell below $60,000 on November 20 for the first time since July, alongside a tech stock selloff and broader pressure on risk assets. Will $60K become resistance, or can BTC quickly reclaim it? What price or volume signals would convince you that selling pressure is easing?

GateDirectIPOPhase3ANTAllocates92100Shares

794.1K Views4.9K Discussing

NvidiaDropsNearly14Percent

332.6K Views7.6K Discussing

View More