Share crypto content and earn up to 60% commissions through content mining.
placeholder
gatefun
#巨鲸清仓HYPE获利1.32亿美元 How much further can HYPE go: Analysis of the whale liquidation event and target levels

The event itself: Profit-taking, no need to overinterpret it

On-chain monitoring shows that a certain whale/institution built a position and staked 2.886 million HYPE at an average price of approximately $19.8 early last year. After redeeming the tokens at the end of July, it fully liquidated the position over the past month at an average price of approximately $64.9, ultimately transferring the final 969,000 tokens (approximately $79.18 million) to CoinbPrime and FalconX, locking in
HYPE2.52%
View Original
post-image
ThisIsTranslateContent:
#巨鲸清仓HYPE获利1.32亿美元 How much further can HYPE go: An analysis of the whale liquidation event and target levels

The event itself: A profit-taking move that should not be overinterpreted

On-chain monitoring shows that a whale/institution built a position and staked 2.886 million HYPE at an average price of approximately $19.8 early last year, redeemed them in late July, and completed liquidation over the past month at an average price of approximately $64.9. It ultimately transferred the last 969,000 HYPE (approximately $79.18 million) to CoinbPrime and FalconX, pocketing $132 million in profit, for a 228% return. During the same period, wallets related to Multicoin Capital also transferred approximately 172,700 HYPE to Coinba.

Key judgment: This was normal profit-taking by an early investor and does not represent a change in fundamentals. An institution that held for nearly a year and earned 2.28x chose to realize its gains, which was more about "securing profits" than "exiting due to a bearish view." However, it does create selling pressure in the short term, and sentimentally it will be interpreted as "smart money retreating."

Factors supporting further HYPE strength

1. Buyback-and-burn mechanism implemented: Hyperliquid activated the AQAv2 token buyback-and-burn mechanism, reducing the circulating supply. Historically, such mechanisms have provided clear support for token prices. Platform buybacks in 2026 have reached $638 million.

2. Expansion into the US market: It plans to join forces with Payward, the parent company of Kra, to enter the US through licensed and compliant channels. This is a major narrative upgrade that opens up incremental compliant growth opportunities.

3. Institutions are still building positions: During the same period as the whale's selling, another major player bought $20.5 million worth of HYPE in a single day, prompting on-chain analysts to call it "smart money accumulating high-quality altcoins." Sellers and buyers coexisting shows that the divergence is not one-sided.

4. Solid platform fundamentals: Hyperliquid is the leader in decentralized derivatives. Its perpetual contracts and on-chain order book model generate real revenue, and the token has practical uses (gas, staking, and governance).

Risks that must be watched

1. $1.2 billion in token unlocks: Massive unlock pressure is expected around September, representing the largest potential source of selling pressure over the next few months. The market will need time to absorb it.

2. Whale long-short ratio is bearish: Whales on the Hyperliquid platform hold approximately $7.2 billion worth of positions, with a long-short ratio of 0.93. Shorts have a slight edge, making short-term trading more cautious.

3. Compounding inflation and unlocks: Some analyses point out that token supply is still increasing. Although buybacks are offsetting this, net pressure has not yet fully turned positive, and the second tranche of buyback funds will not be injected until early October.

4. Pullback risk after massive short-term gains: HYPE has been highly volatile since its launch, and large unlock periods are often accompanied by high volatility.

Target levels

The path given by institutional forecasts: approximately $85 (+5%) in 1 month, approximately $93 (+15%) in 3 months, and a year-end range of $81-115, with a baseline target of approximately $96 (+18%). In other words, assuming fundamentals remain unchanged, the market's mainstream expectation is for HYPE to reach $95-115 this year. A breakout would open up greater upside, while a break below around $81 would signal a period of range-bound consolidation.

Conclusion

The whale liquidation was "$132 million in profit-taking," not a "$132 million bearish signal." HYPE's medium-term logic (buyback and burn + US compliance + leadership in derivatives) remains unchanged, and while institutions were selling, other large players were also accumulating. HYPE will most likely trade in the $80-115 range this year, with its upside depending on whether the $1.2 billion unlock can be absorbed smoothly. $HYPE
repost-content-media
  • Reward
  • 2
  • Repost
  • Share
ShizukaKazu:
Just go for it 👊
View More
When you catch the pico bottom with 450 people on tg and you get stopped BE for 3$ and this fucker runs now -.-
post-image
  • Reward
  • Comment
  • Repost
  • Share
#Kimi秘密交表启动港股IPO #AIP
In the blockchain world, most projects talk about their story, their team background, their funding size, and their future vision. The AIP model talks about none of that; it talks about one thing only: rules.
This deserves to be taken seriously because its rules were not written by people—they were written by AI.
I am not saying that AI helped polish a white paper. I mean that AI started from scratch, evaluated thousands of trading models, played against itself hundreds of millions of times, and ultimately produced a complete game-theoretic framework. The team did only
View Original
post-image
  • Reward
  • Comment
  • Repost
  • Share
【$BULLA Long Opportunity】1H momentum accelerating, supported by deep buying
$BULLA RSI 87.33, with the price breaking above the 4H Bollinger upper band. Order-book depth ratio 1.80, with substantial buy orders around 0.0371. The 1H MACD histogram continues to expand, while the 4H maintains the same expansion pace. Funding rate 0.0504%, with long position costs remaining stable.
🎯Direction: Long
⚡Entry/Limit Order: 0.03716018 - 0.03727200
🛑Stop Loss: 0.03689928
🚀Target 1: 0.03783108
🚀Target 2: 0.03811062
🛡️Trade Management:
- After reaching Target 1, reduce the position by 50% and move the
View Original
post-image
  • Reward
  • Comment
  • Repost
  • Share
Earnings massively beat expectations, yet the stock got hammered by six points
Revenue rose 86%, while AI chip revenue surged 221%
Nine consecutive quarters, without a single disappointment
It only underreported Q4 guidance by $200 million
Less than one percent
And the stock still fell 6.6%
The market has become so harsh on AI
That missing even a dime
Is enough to turn it against you
I’m staying out
I’m not buying at this valuation
View Original
post-image
  • Reward
  • Comment
  • Repost
  • Share
$BULLA Signal】Long + 4H bullish momentum expansion
$BULLA 4H RSI 82.41, MACD bullish momentum expanding, buy-side pending orders are 2.7 times sell-side orders, and the current trend is dominated by buyers.
🎯Direction: Long
⚡Entry/Pending order: 0.03042545 - 0.03051700
🛑Stop-loss: 0.03021183
🚀Target 1: 0.03097475
🚀Target 2: 0.03120363
🛡️Trade management:
- Execution strategy: Reduce the position by 50% after reaching Target 1 and move the stop-loss up to the breakeven level. If the price falls back to the entry level, exit automatically to protect the principal.
The price has broken abov
BULLA86.80%
BTC4.81%
ETH4.32%
SOL5.32%
View Original
  • Reward
  • Comment
  • Repost
  • Share
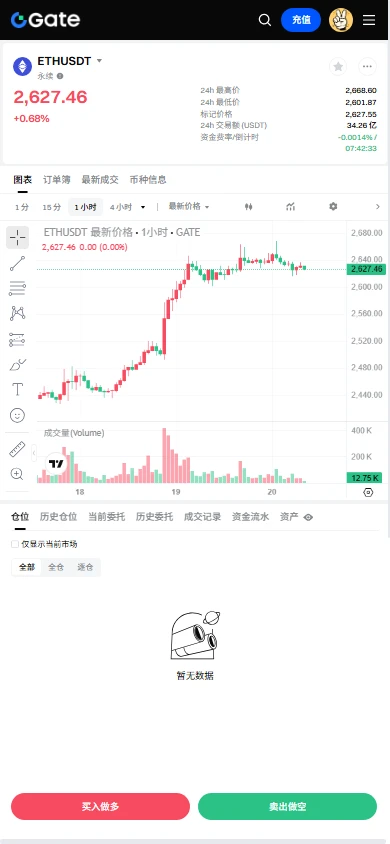
$ETH ‌Ethereum fam seeing 2400
ETH4.35%
View Original
post-image
  • Reward
  • Comment
  • Repost
  • Share
You expect:
Entry → TP
The market gives you:
Entry → pullback → fakeout → drawdown → reversal → TP
Most traders don't lose because they picked the wrong direction.
They lose because they can't tolerate the path.
post-image
  • Reward
  • Comment
  • Repost
  • Share
#NvidiaMarketCapBackAbove5.4T
NVIDIA MARKET CAP BACK ABOVE $5.4 TRILLION — THE AI RALLY ISN'T SLOWING DOWN
Nvidia has reportedly pushed its market capitalization back above the $5.4 trillion mark, extending one of the most remarkable valuation runs in stock market history. This isn't the first time Nvidia has broken new ground this year — the company became the first ever to cross $5 trillion in late October 2025, dipped below that level during a broader market selloff, then climbed right back above it in the following months. Now it's pushing even higher.
WHY THIS KEEPS HAPPENING
Nvidia's sw
NVDA1.41%
AMD0.10%
AVGO-4.44%
post-image
post-image
  • Reward
  • 1
  • Repost
  • Share
SoominStar:
Ape In 🚀
Gold has gone 150 sessions without a one-year high, last set in January 2026 at $5,318. It sits 15.7% below that level.
  • Reward
  • 2
  • Repost
  • Share
FractalAnalyst:
150 days without a new high, but it hasn’t crashed either—this resilience is far greater than that of the crypto market. Jealous.
View More
Layout for Bitcoin, Ethereum, and Dogecoin
gate liveLIVE
5,921
  • Reward
  • 16
  • Repost
  • Share
TalkingAboutMemeAsTheCoinMakes:
Enter at the bottom 😎
View More
I was just about to go to the forum and start cursing, but then I looked at my balance. Never mind—the market daddy is always right.
When the screen was glowing green, I was already thinking that this rebound wouldn't last long. There were no buyers on the way up, sell orders were lined up neatly, retail investors were doing all the absorbing, and there wasn't a single decent bid wall below. A few nights ago, my call before bed was to short the rebound, entering around 0.09365. The direction was spot-on.
I just took a glance, and the price has already reached 0.03333. Honestly, the +3101.85% f
SNDK-0.66%
BNB4.94%
View Original
post-image
  • Reward
  • Comment
  • Repost
  • Share
9.3 Gold Midnight Review
Initial jobless claims came in at 20.6, above expectations. Gold prices surged in the short term, with the current price around 4478, and remained volatile at high levels after the data was released.
Technical analysis: The 1-hour Bollinger Bands are opening upward, and gold prices are holding above the middle-to-upper band. The 30-minute Bollinger Bands’ upper band is expanding upward, while KDJ and RSI remain in the high range. The higher-timeframe rebound and recovery trend continues, but short-term bullish momentum has been exhausted, and the indicators show a need
GLDX2.97%
PAXG2.81%
View Original
post-image
  • Reward
  • Comment
  • Repost
  • Share
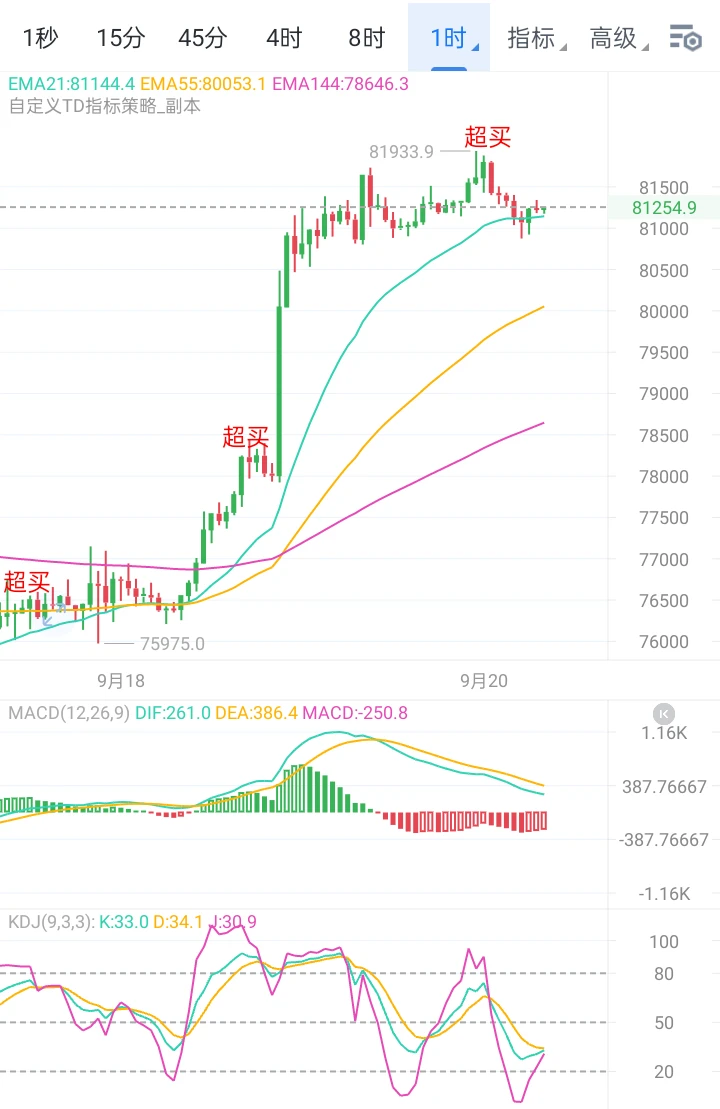
Fueled by favorable news, BTC stabilized at the 78,000 level in the evening before making a strong move higher, rising as high as around 80,500, with strong bullish momentum. The 78,000 long position we entered in the evening successfully took profit on nearly 1,000 points of upside, fully validating the direction. The price is currently moving around 80,000, with the short-term upward structure intact and the bulls holding a clear advantage.
Structurally, 78,000 has shifted from previous resistance to important current support. After breaking above and holding the round-number level of 80,000
BTC4.81%
View Original
post-image
post-image
  • Reward
  • Comment
  • Repost
  • Share
🚨 $1B in stablecoins flowed into @ in August:
First positive month after months of outflows
BTC jumped ~22%
Best crypto month of 2026
Is liquidity finally coming back?
BTC4.81%
post-image
  • Reward
  • Comment
  • Repost
  • Share
$ETH Ethereum at 2400 called for a long to 2450; brothers who followed all made big profits.
ETH4.35%
View Original
post-image
  • Reward
  • Comment
  • Repost
  • Share
🌹Before I knew it, ding閱 has already reached its 4th year. The annual low of 5.5gt at half price ends tonight‼️ Both longs and shorts made money this month‼️ Click 👇 to close positions
————————————————
🎉https://www.gate.com/zh/profile/When will the autumn rain end
————————————————
🌹Last week, going long at 62800/1865 and reaching 81300/2545 brought a huge profit of 1.23 million
🌹Shandi shorted at 1820 and covered at 1420, doubling the account and pocketing 970,000
🌹 Over the weekend, shorting at 81000/2540 and reaching 76200/2355 brought more profit
🌹 Yesterday’s long at 76500/2355 has
View Original
post-image
post-image
  • Reward
  • 10
  • Repost
  • Share
KeepUpWithTheRhythmOfTheTimes:
Buy the dip 😎
View More
The US Institute for Supply Management (ISM) Services Purchasing Managers Index (PMI) rose to 55.4 in August, surpassing market expectations of 54.1. This figure, exceeding July's value of 54.1, indicates the strongest growth since February. This expansion in the services sector, which accounts for over 80% of the US economy, clearly demonstrates the resilience of overall economic activity.
The strong index value shows that service providers have solidified their position on the growth path, driven by increased new orders and business volume. Optimistic market participants argue that this bett
INDEX-5.92%
post-image
  • Reward
  • 7
  • 1
  • Share
Venüs_:
Ape In 🚀
View More
Load More

Join 40 M users in our growing community

⚡️ Join 40 M users in the crypto craze discussion
💬 Engage with your favorite top creators
👍 See what interests you
  • Pinned