

Share your thoughts
placeholder
Article
SUI is about to flip the daily trend from bearish to bullish.

$SUI /USDT - LONG

Trade Plan:
Entry: 0.7150 – 0.7200
SL: 0.6869
TP1: 0.7405
TP2: 0.7558
TP3: 0.7788

Why this setup?
Why now? The 1h price is hovering at 0.7175, exactly at the entry zone, while the 15m RSI sits at 29.46, signaling extreme oversold conditions that often precede a sharp reversal. The 1h ATR of 0.009821 shows the market is compressing enough volatility for a explosive move, and the daily trend remains bearish, creating a dangerous contradiction that favors a powerful short squeeze. Target 1 sits at 0.7405, with T
SUI-1.92%
Ethereum’s final short-term move is complete, and the direction is beginning to emerge; bulls continue to challenge 2550.
ETH+4.04%
  • 2
This old man is 79 this year, and he’s still filming?
post-image
#SOL #8月CPI今晚公布 #BTC #ETH
I opened a position in SOL at 103. When it reached 105, I was up around $300, but because of greed, I’m currently down $300. It clearly reached my target several times, but I still couldn’t control my greed. I hope tonight’s CPI can turn my losses into gains, so I don’t ultimately end up getting liquidated.
Where do you think I should have placed my stop-loss if I had cut my losses in time? Looking for guidance from an expert.
$BTC $ETH $SOL
BTC+1.10%
ETH+4.09%
SOL+2.20%
  • 3
The hand that set the stop-loss a few days ago was trembling slightly; this morning I realized that was unnecessary filial piety. A few days ago, while everyone was still watching from the sidelines before bed, $DELL funds quietly entered the market. The pullback held, and I judged that the bottoming consolidation was nearly over.
At the time, I said: As long as the key level holds, try going long with a light position; consider adding only after the rhythm is confirmed. Don’t go all in from the start. After opening a long position, the price barely looked back. The market made it very clear,
post-image
DELL+4.23%
ADA-1.14%
XRP+0.45%
Spent some time finishing translating @Polyflow_PayFi's materials, and PayFi finally feels less like a slogan.
When most people hear crypto payments, their first thought is: scan a code or make a transfer with stablecoins. But what has really held back large-scale adoption has never been “whether payments are possible”; it is everything that comes afterward—who safeguards the money, whether it is compliant, how many days cross-border transfers take, and how the payment disappears once the purchase is completed, building neither credit nor yield.
PolyFlow’s approach is fairly clear: split a pay
post-image
The lines have already been drawn for you—can’t you even reach out and pick up the money?
BTC 77458 peak, right in the 77300–77600 entry zone; the first target was 76400–76600, but it directly hit 75866. Wherever the line is drawn, that’s where the money lands. $BTC #美国8月PPI录得5.4%
BTC+1.09%
#ZECPlungesOver13%
Zcash has come under heavy selling pressure, with ZEC plunging more than 13% in a sharp move that has quickly changed the short-term market picture.
A move of this size is significant because ZEC had recently attracted strong attention from traders following its earlier price momentum. When an asset rises rapidly and then experiences a double-digit decline, the market naturally begins questioning whether the previous rally was overheated or whether this is simply a temporary correction.
The first thing to watch now is support.
After a sharp breakdown, traders usually look f
post-image
  • 1
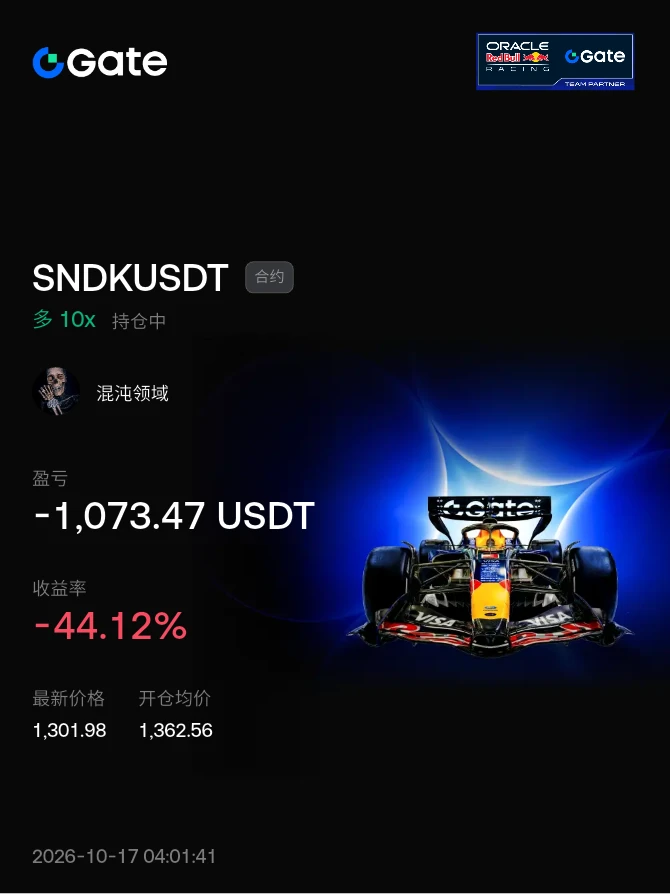
$SNDK /USDT is range-bound on the daily but the 4h setup screams otherwise.

$SNDK /USDT - LONG

Trade Plan:
Entry: 1655.69 – 1665.43
SL: 1599.77
TP1: 1706.15
TP2: 1736.54
TP3: 1782.13

Why this setup?
Why now? The daily trend is range, which usually traps momentum traders, yet the 4h bias is LONG with 77.4 confidence. The 1h ATR of 19.482607 tells us volatility is expanding enough to fuel a move. The 15m RSI at 60.07 shows room to run before overbought. Entry sits at 1660.56, with TP1 at 1706.15 and TP2 at 1736.54, while the invalidation level at 1688.46 acts as the line in the sand.

Deb
post-image
SNDK-2.17%
#GateTop4MainstreamCEX
Gate is strengthening its position among the leading mainstream centralized crypto exchanges, highlighting how quickly the platform has evolved in a market where competition between major exchanges continues to grow.
For a centralized exchange, being recognized among the top platforms is not simply about trading volume.
It reflects a much broader combination of liquidity, asset selection, product development, user activity, technology, security and the overall trading experience.
Gate has continued expanding across multiple areas of the crypto market, giving users acces
post-image
  • 1
Intraday flip, part seven: I've flipped $2,144 so far!
#黄金 #CoinDesk披露GateRWA永续合约全球Top3 $BTC $ETH
BTC+1.09%
ETH+4.04%
$SOL Signal】Short + 1H spike hits 4H resistance, volume-price divergence
$SOL The 1H single-candle volume exploded to 4.05 million, with price surging from 97.36 straight to 101.78, while the active buy ratio on the same candle was only 0.49. The current price of 101.22 is above the 1H Bollinger upper band at 101.0293, with two barriers overhead: the 4H EMA20 at 101.2826 and the 4H Bollinger middle band at 101.6960.
The 4H MACD histogram remains in negative territory at -0.1368, while the 1H MACD histogram is expanding at +0.2883, showing a split between short-term momentum and the longer-ter
post-image
SOL+2.20%
#OracleQ1EarningsBeatStockUpOver5% Oracle Q1 Earnings Beat — Stock Jumps Over 5%
Oracle delivered a strong fiscal Q1 performance, beating Wall Street expectations and giving investors fresh confidence in its AI and cloud strategy.
Oracle reported $19.34B in revenue, up 30% YoY, versus expectations of $19.14B. Adjusted EPS came in at $1.92, beating the $1.74 estimate.
The biggest highlight was cloud infrastructure, which surged 121% YoY. Oracle also secured more than $30B in new AI cloud contracts, pushing its remaining performance obligations to a massive $664B.
Oracle also raised its FY202
post-image
ORCL+2.46%
Quick short-term entries and exits, pocketing a total of $6383
Short $BTC 77309 entry, 👉76524 exit
Captured 800 points, pocketing $1985
Short $ETH 2474 entry, 👉2445 exit
Captured 29 points, pocketing $755
Long ETH entered at 2456, took profit at 👉2506
Captured 50 points, pocketing $1365
Long BTC entered at 76730, took profit on the wick at 👉77618
Captured nearly 900 points, pocketing $2278
The market is currently consolidating at high levels. Short at suitable levels to steadily earn profits. Damn, doubled the account over the weekend!!!
#CoinDesk披露GateRWA永续合约全球Top3
BTC+1.10%
ETH+4.09%
By the time I got back from a quick bathroom break, the candlestick chart had already wiped out my losses for me.
A few days ago, it pumped to 0.0010303 in the early hours on virtually no volume. I judged the bull trap to be too obvious, with buyers waiting all the way up, so I opened a short directly. The price has now fallen back to 0.0005762, with a return of +867.82%—I really did get a piece of the move.
I closed the position at +867.82% first and pocketed most of the profits. I moved the stop loss on the remaining 18% to the entry price and let the profits run on their own. Profits come f
post-image
DOGE+1.54%
XRP+0.45%
I originally planned to cut it and call it a day, but it turned around on its own and handed the gains back to me.

That plunge in the early hours a few days ago nearly washed me out. But looking closely, volume didn’t actually surge—it was just a panic sell-off, while some whales were quietly buying the dip. The capital inflow couldn’t fool anyone. So I re-entered around 0.005583.

Now $HEMI is at 0.006943, with unrealized gains of +475.75%. Feels good, brothers—we can afford a nice meal. I’ve taken 80% off the table, leaving the remaining 20% protected at the entry price. Let the bullets
post-image
HEMI-5.99%
XRP+0.45%
SNDK-2.17%
Many people are puzzled: The BTC daily golden cross is just around the corner, yet Bitcoin is stuck around 76,900 and unable to move. With tonight’s CPI data and the crypto bill, can BTC surge to 100,000?
The root cause is still inflation data: PPI rose 5.4% year over year, directly crushing expectations for rate cuts. On top of that, crude oil has held above $100, so risk capital has chosen to temporarily pull back.
The 50-day EMA and 200-day EMA are about to converge. This is the first time since last November that they have come this close to signaling a golden cross!
✅BTC is currently at 7
post-image
BTC+1.09%
ETH+4.04%
ZEC-0.69%
#ZECPlungesOver13%
Zcash has come under heavy selling pressure, with ZEC plunging more than 13% in a sharp move that has quickly changed the short-term market picture.
A move of this size is significant because ZEC had recently attracted strong attention from traders following its earlier price momentum. When an asset rises rapidly and then experiences a double-digit decline, the market naturally begins questioning whether the previous rally was overheated or whether this is simply a temporary correction.
The first thing to watch now is support.
After a sharp breakdown, traders usually look f
post-image
ZEC-0.65%
BTC+1.09%
  • 1
Strategy publicly released at 10:17. The stop-loss at 1.27 points wasn’t swept, and the target was hit precisely—that’s what skill looks like.
A 50-point drop—I fed the levels right to your mouth; you just had to swallow. $ETH #8月核心CPI超预期
ETH+4.04%
Load More

Join 40 M users in our growing community

⚡️ Join 40 M users in the crypto craze discussion

💬 Engage with your favorite top creators

👍 See what interests you

View More