








Square
Following
Hot
News
Notifications
Profile
Share your thoughts
placeholder
Article
Shorting those coins that have pumped through the roof yet again.
Bearish outlook.
$PIEVERSE Seriously, the whole market is plunging, and you're the only one stubbornly holding up and not dropping, huh? Clearly you're going against me. $PIEVERSE
PIEVERSEUSDT perpetual position direction: Short; unrealized loss: -12,796.58 USDT; PIEVERSE +20.26%
Risk warning: The above is only a personal trading record and does not constitute any investment advice. Contract trading carries extremely high risks; please participate with caution.
post-image
PIEVERSE+0.58%
Trenches
IDOL
I
bade
b
IDOL
0x3b...ab07
Market Cap
$.
Change
.
24h Vol
$.
Holders
.
JAGENT
J
bade
b
JAGENT
0x8e...ae15
Market Cap
$.
Change
.
24h Vol
$.
Holders
.
PIEVERSE
P
bade
b
PIEVERSE
0x0e...25a9
Market Cap
$.
Change
.
24h Vol
$.
Holders
.
FIONA
F
bade
b
FIONA
B34n...pump
Market Cap
$.
Change
.
24h Vol
$.
Holders
.
mihao
m
bade
b
mihao
4Cxj...pump
Market Cap
$.
Change
.
24h Vol
$.
Holders
.
#BTCReboundFaces60KTest
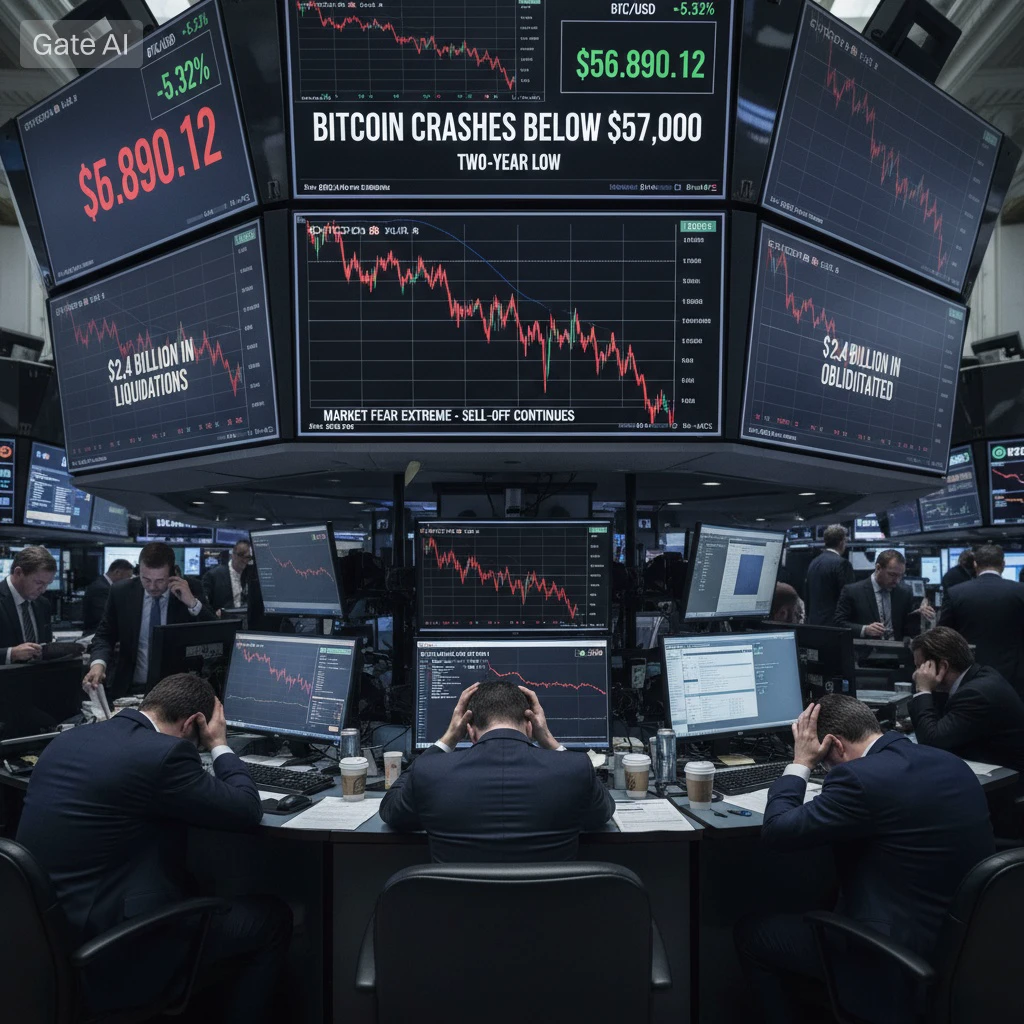
Bitcoin Crashes Below $57,000 — Hits Two-Year Low as $2.4 Billion in Liquidations Obliterate Bullish Traders$ANT

Bitcoin has just delivered one of its sharpest and most painful punches in recent years. In a brutal weekend session, the world’s largest cryptocurrency plunged below the critical $57,000 level, marking its lowest price since September 2024. The drop triggered a massive $2.4 billion liquidation cascade across crypto markets, almost entirely wiping out leveraged long positions and sending shockwaves through both retail and institutional desks.

At its worst
post-image
ANT-8.68%
crypto future market update
live-cover
LIVE1,834
SOXL-1.16%
BTC-0.65%
ETH-1.23%
XAU+0.38%
ZEC+1.29%
I am human
is human
not an organ
post-image
Above is you online.
Below is the real you.
post-image
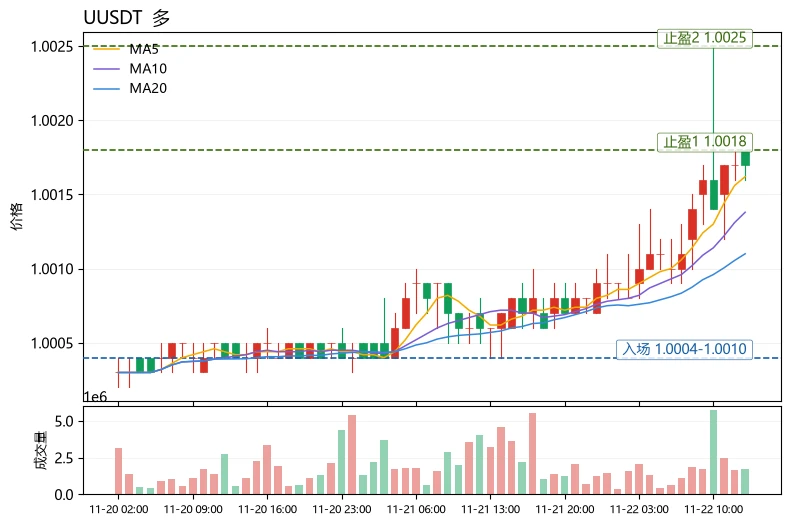
The most unusual detail in today's market is that the Fear & Greed Index is only 11 and the market is in extreme fear, while $U has formed a narrow-range bullish structure with MA5>MA20 and a positive MACD histogram within a range of only about 0.21% over 30 candles. This shows it is currently a low-volatility anchor asset, not a sentiment-driven directional trading asset; treating it as a trend trade offers very poor risk-reward.
Using moving averages to judge whether a trend is healthy, this is a perfect counterexample: MA5=1.00162 is only slightly above MA20=1.0011, with the two lines near
post-image
LINK-0.18%
TRUMP-0.95%
#下周PCE与GDP数据将揭晓
On Nov 25 at 21:30, US PCE, revised GDP, and personal spending are released simultaneously. There is little suspense over the direction of rate hikes; the focus is on the magnitude and path. Just watch these three columns: prices, growth, and asset correlations.

I. Information to watch
Next week has a set of data worth marking on the calendar in advance. According to CLS's investment calendar, on Nov 25 at 21:30, the US October Personal Consumption Expenditures Price Index, the revised annualized quarterly rate of real GDP for Q3, October personal spending, and durable goods
ANT-8.68%
On the 4-hour chart, $SOL short from 68.8. Sellers must hold here. Price is approaching resistance. I want to see a rejection wick, not sideways chop within the zone. If the close is above 69.7, I’ll abandon this idea. On the 4-hour chart, price is 68.8, below the 73.3 EMA50, so sellers remain in control of the trend. The stop distance is 1.3%, and the TP3 target distance is 2.1%, for a 1.6R risk/reward ratio if reached. Short zone 68.70–68.85 | Targets 68.24, 67.88, 67.34 | Stop 69.67 Not investment advice · Do your own research
post-image
SOL-0.77%
$AKT strong fundamental project with real demand and real revenue.

I'm DCAing akt for the long run.
buy and hold or put it in a bot until the market kicks off again.

other projects on my radar: $geod $fet #near ‌
AKT-0.10%
  • 1
  • 1
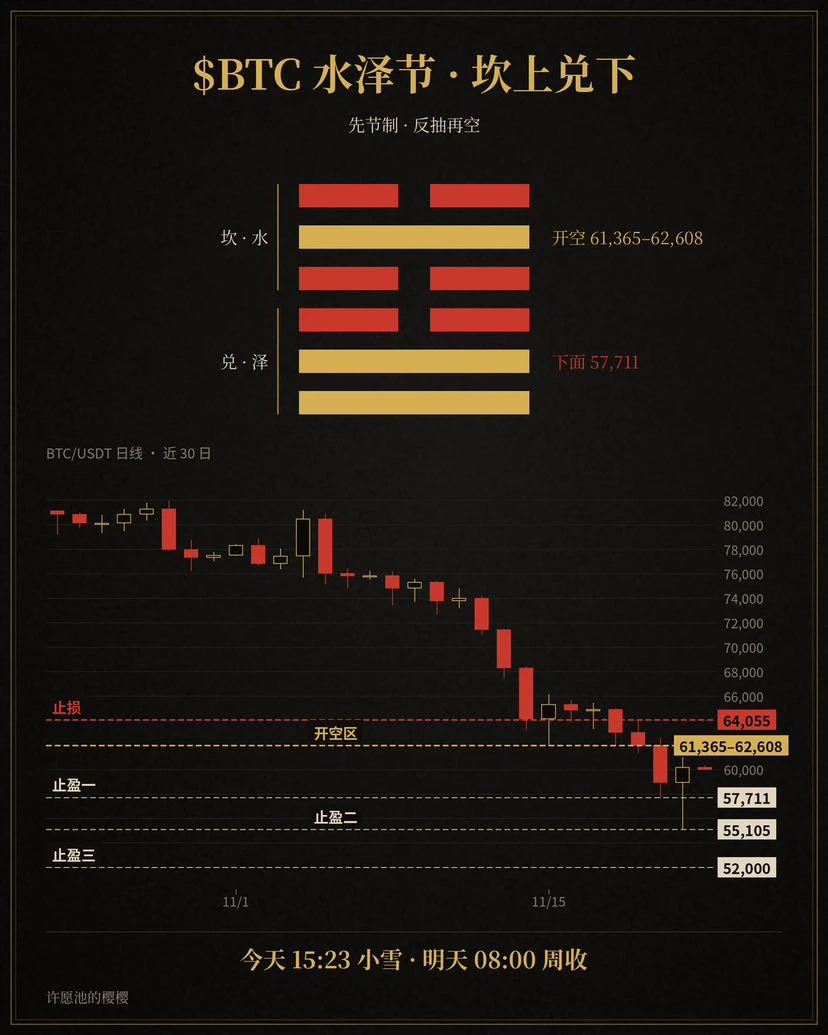
$BTC ‌ Yesterday’s daily candle first plunged to 55,105, then recovered and closed at 60,190. The low reset the structural low from 57,711 to 55,105. The close also reclaimed 58,916 and 59,581, but not 61,365. This morning it opened near 60,190 and is now around 60,000. So far today, the high is 60,321 and the low is 59,983; price has been moving in this narrow range around the open, without reaching 60,636, let alone reclaiming 61,365.

The weekly framework is unchanged: the weekly candle has closed below 77,500 for two consecutive weeks. It closes tomorrow at 08:00. Don’t mistake yesterday’
post-image
BTC-0.65%
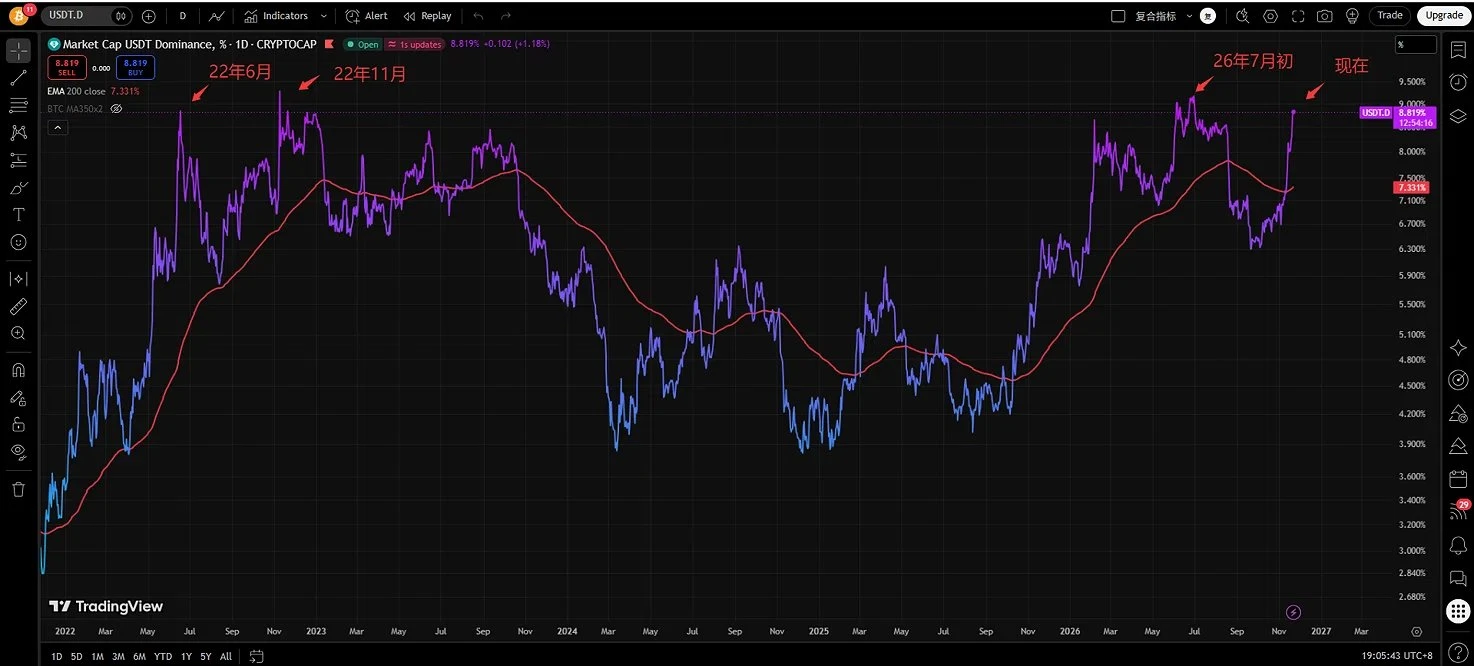
USDTD has already reached the top; the current situation resembles the double bottom of the 2022 bear market! $BTC
post-image
BTC-0.67%
  • 1
  • 2
$NVDA If Jensen Huang can really make a comeback, Nvidia will post a big bullish candle!
post-image
NVDA-13.84%
  • 3
  • 2
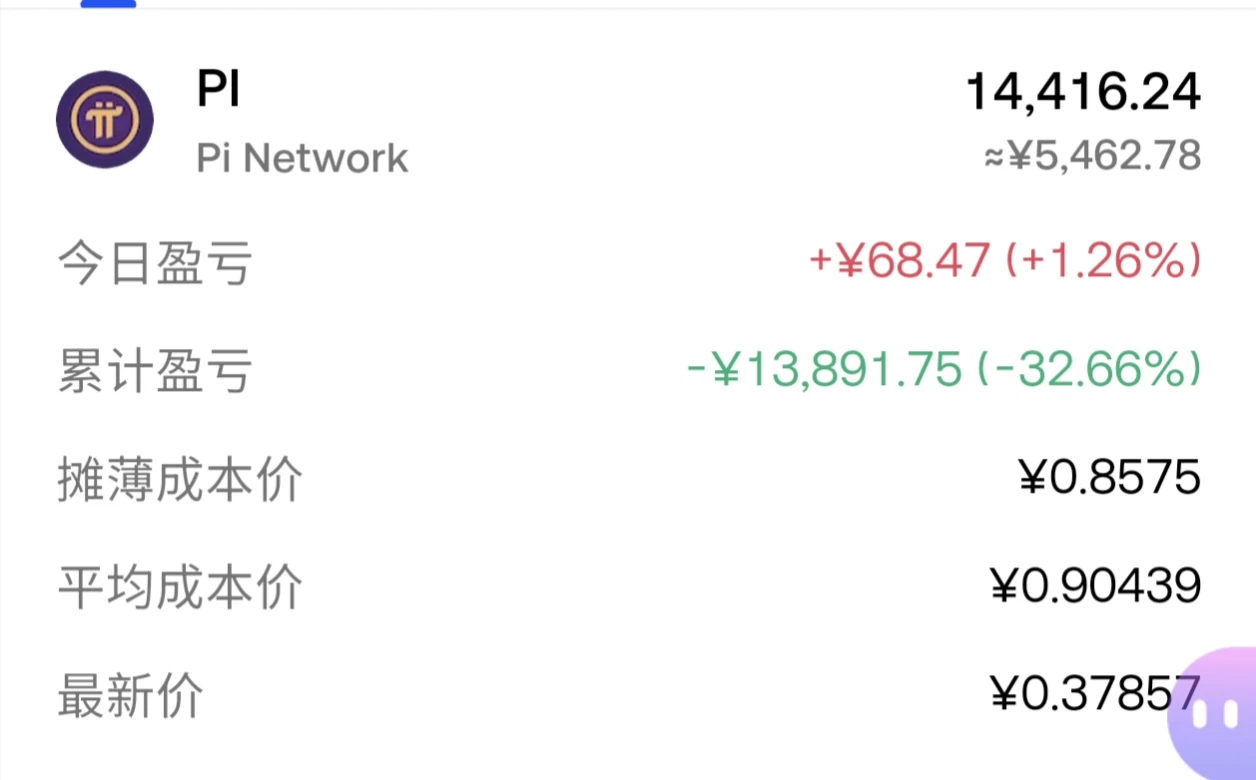
Who lost more than I did? Don’t just talk big—post a screenshot
post-image
PI-0.60%
  • 5
#BTC反弹后再争6万美元关口 To be precise, this Bitcoin rebound looks more like a short-term recovery after a sharp drop and cannot yet be considered stabilization. $60,000 is the threshold for judging whether the rebound can continue, but whether to treat it as stabilization also depends on whether trading volume and capital flows follow through.

Why it should initially be viewed as a recovery
The rebound is driven mainly by passive factors: on November 21, Bitcoin bounced from a low of $55,127 to $60,523, with about $68.82 million in short liquidations in one hour, versus only $1.64 million in long liq
post-image
ThisIsTranslateContent:
#BTC反弹后再争6万美元关口 To be precise, this Bitcoin rebound looks more like a short-term recovery after a sharp drop than a sign of stabilization. $60,000 is the threshold for judging whether the rebound can continue, but whether it marks stabilization also depends on whether trading volume and fund flows follow through.
Why it should first be viewed as a recovery
The rebound is driven mainly by passive forces: On November 21, Bitcoin bounced from a low of $55,127 to $60,523. One-hour short liquidations totaled about $68.82 million, while long liquidations were only $1.64 million. The move was driven mainly by shorts closing positions, not by sustained buying from new buyers.
The funding picture has yet to strengthen: From November 2 to 17, U.S. spot Bitcoin ETFs saw cumulative net outflows of about $2.579 billion, while stablecoin market capitalization also contracted[8]. How to assess $60,000 alongside fund flows
$60,000 is just a threshold: Reclaiming it and then holding it on a retest would show that bears are temporarily unable to keep prices down. But reclaiming it could also be only a brief reprieve after short covering.
Trading volume needs to be strong and healthy: Rising volume during advances and declining volume during pullbacks would show that buyers are willing to step in at higher prices. If prices rise without volume following suit, the rally lacks a solid foundation.
Fund flows need to turn positive and stay that way: ETFs should shift from net outflows to net inflows for several consecutive days, with inflows gradually increasing; stablecoin market capitalization should stop falling and recover. A return to inflows for just one day followed immediately by a shift back to net outflows would indicate only a tentative move.
So: Only if Bitcoin holds above $60,000, ETFs see consecutive days of net inflows, and pullbacks come on lower volume can the move be considered a shift from a short-term recovery to stabilization. If it only reclaims $60,000, treat it as an oversold rebound for now.#WCTCS9 $BTC ‌

repost-content-media
BTC-0.67%
  • 2
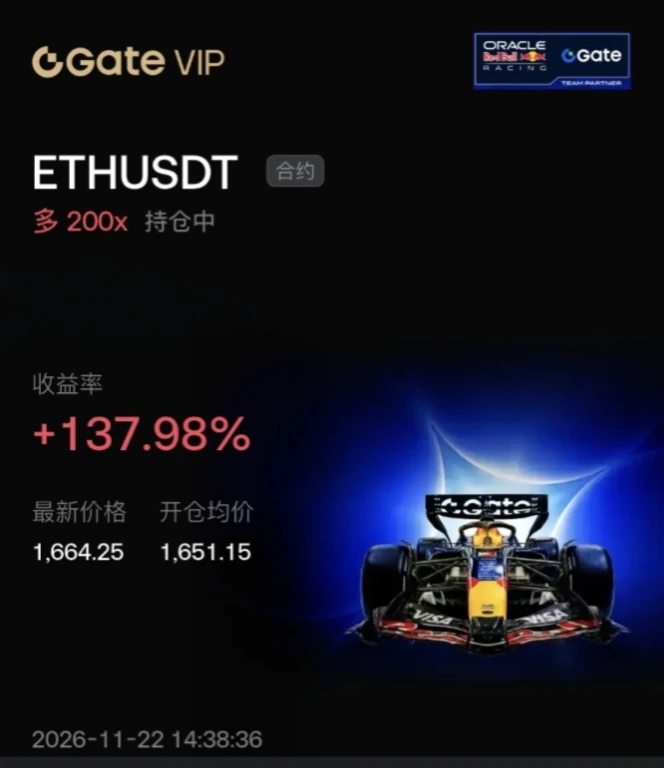
Happy weekend, everyone! Get ready to start the battle tomorrow, Monday $ETH
post-image
ETH-1.23%
#GateAnnualGala 🎉 Gate Annual Gala Is Here!

The Gate Annual Gala is bringing the community together for a special celebration of another exciting year in crypto! 🚀

🏆 From memorable moments and achievements to creators, streamers, and community members, the Gala is a chance to celebrate everyone who has been part of the journey.

✨ Stay tuned for exciting highlights, recognition, rewards, and unforgettable moments from the event.

💙 Let’s celebrate the progress, passion, and future of the crypto community together!

#Gate #GateAnnualGala #Crypto #Web3
post-image
Bitcoin is back above $60k—not because the bull market is back, but because institutions are holding the line! 🩸 Look at this news: while BTC fell below $60k, Abraxas Capital scooped up 17k BTC (over $1 billion), pushing the price back up. Meanwhile, an “insider whale” deposited tens of millions in stablecoins to exchanges, declaring, “It’s time to bid.” What does this tell us? $55k–$60k is currently the “psychological defense line” for big money. Institutions are openly buying bloodied chips. But don’t celebrate too soon. Macro liquidity drainage hasn’t stopped, the Fed’s high rates are stil
post-image
BTC-0.67%
🔹 Ethereum(ETH) Surpasses 1,700 USDT with a Narrowed 1.69 Decrease in 24 Hours
live-cover
LIVE2,850
BTC-0.67%
ETH-1.26%
NVDAG-0.24%
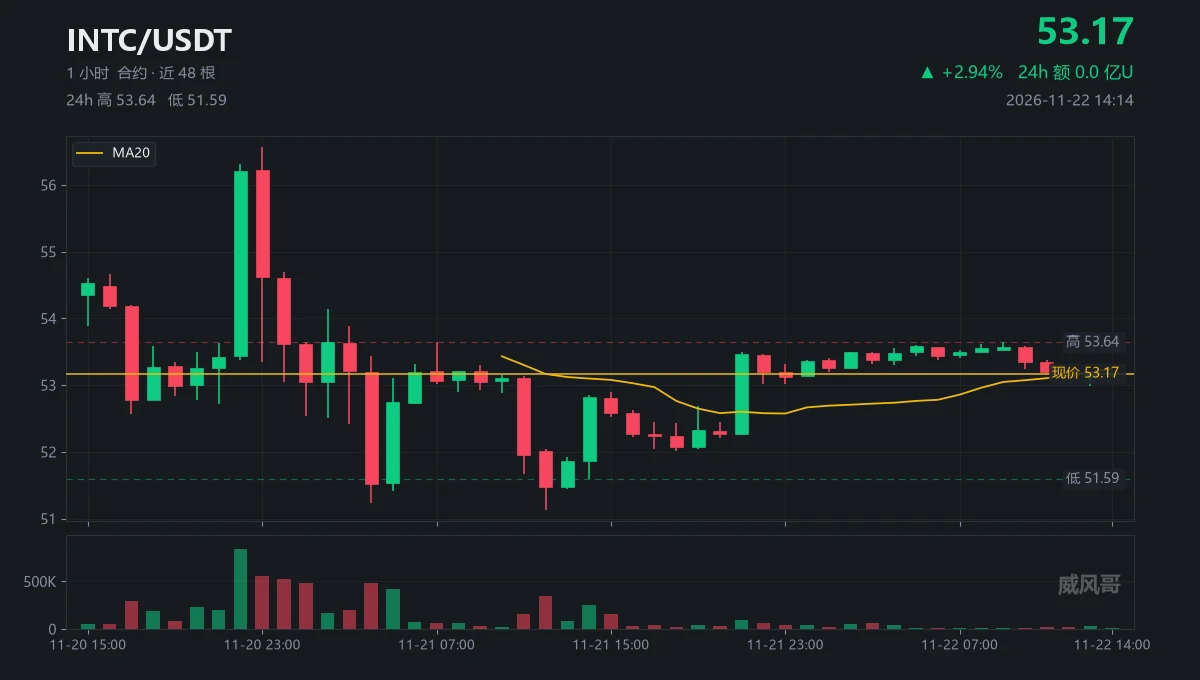
Someone asked me whether 53.5 could hold.
I said to first look at how many times it was tested.
Yesterday at 21:00, it tested 53.5.
Today at 09:00, it tested 53.64, 14 points higher than yesterday.
Then what.
At 10:00, the high was 53.59.
At 11:00, 53.37.
At 12:00, 53.28.
At 13:00, 53.18, while volume was actually the highest in this stretch at 31k contracts.
The highest-volume candle made the weakest move.
$INTC The chart shows 53.17; right now, it’s 53.22, with MA20 at 53.25 still overhead.
My answer: Let’s see if it can get above that level; if it can’t, it’ll just keep grinding.
(Not inves
post-image
INTC+0.05%
  • 2
  • 2
Load More

Join 40 M users in our growing community

⚡️ Join 40 M users in the crypto craze discussion

💬 Engage with your favorite top creators

👍 See what interests you

Trending Topics

BTCReboundFaces60KTest

2.1M Views30.1K Discussing

BTC rebounded from around $55,300 on November 21, briefly reclaiming $60,000 before pulling back to around $59,300. The $60K level is back in focus as traders assess whether the recovery can last. Is this rebound a sign of stabilization or a short-lived recovery? Would reclaiming and holding $60K be enough, or do you need confirmation from trading volume and fund flows?

PCEAndGDPDataNextWeek

258.2K Views2.6K Discussing

GateDirectIPOPhase3ANTAllocates92100Shares

817.6K Views5K Discussing

View More