Square
Following
Hot
News
Notifications
Profile
Share your thoughts
placeholder
Article
$DGAI ‌
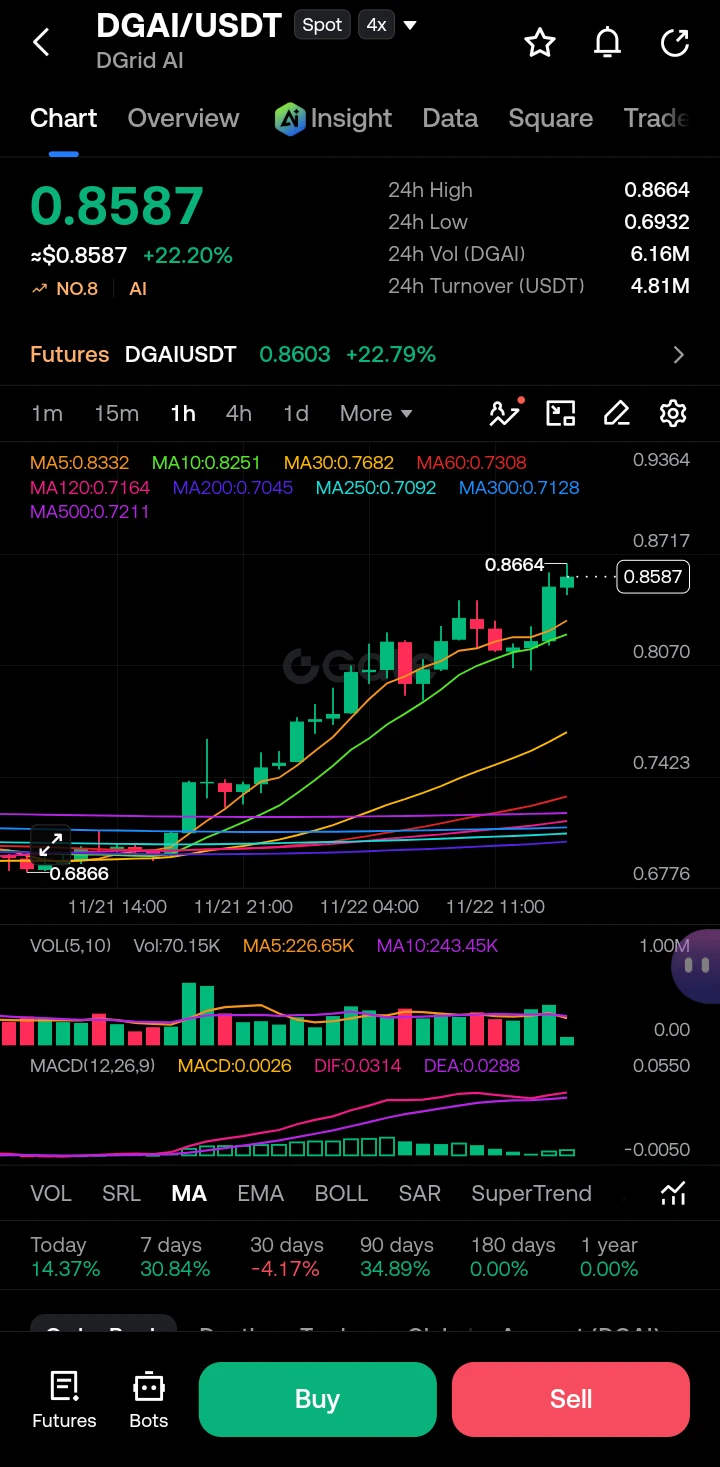
The DGAII/USDT chart is displaying a textbook, aggressive bullish trend, having rallied over 22% in the last 24 hours to reach a current price of 0.8587. Price action is forming a series of higher highs and higher lows, riding a strong uptrend. The moving averages (MA) are in a perfect bullish fan, with the short-term MA5 (0.8332) and MA10 (0.8251) acting as dynamic support below the current price. We are currently testing the 24-hour high resistance zone at 0.8664. Volume has been noticeably elevated during this upward push (Vol MA5 is 226.65K), confirming the buying pressure behind
post-image
DGAI+0.67%
  • 1
  • 1
U.S. stocks can really take a nosedive: down 34% in ’87, 49% in 2000, 56% in ’08, and 34% in 2020. If you’re dollar-cost averaging into the S&P 500 and ACWI through NISA, think carefully about whether you can handle your account being cut in half. My hands were shaking when I added to my position last week—the answer is in the details. Weekend trading volume is only 30% of weekday volume, so even a little volume can push prices up. It’s the same pattern everywhere.
post-image
SPX+0.33%
  • 2
  • 2
Trenches
IDOL
I
bade
b
IDOL
0x3b...ab07
Market Cap
$.
Change
.
24h Vol
$.
Holders
.
JAGENT
J
bade
b
JAGENT
0x8e...ae15
Market Cap
$.
Change
.
24h Vol
$.
Holders
.
PIEVERSE
P
bade
b
PIEVERSE
0x0e...25a9
Market Cap
$.
Change
.
24h Vol
$
Holders
.
CLAUDIA
C
bade
b
CLAUDIA
2j5S...W2ZM
Market Cap
$.
Change
.
24h Vol
$.
Holders
.
mihao
m
bade
b
mihao
4Cxj...pump
Market Cap
$.
Change
.
24h Vol
$.
Holders
.
It bounced, but that candle still hasn’t come
$BTC ‌
Draw the chart first, then speak.

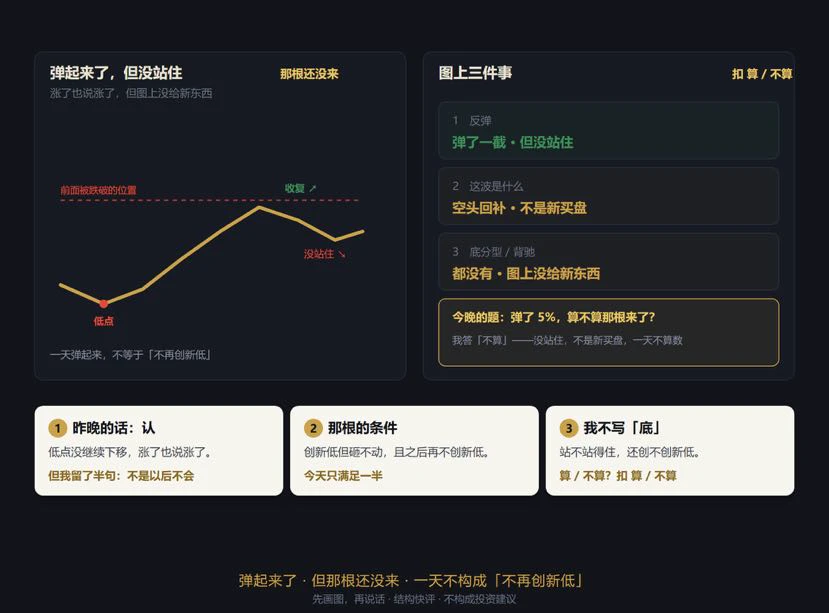
Last night I said the low was still moving down. Today it didn’t continue lower; it bounced. I’ll own that—that’s how the record should read: if it rises, say it rose.

But yesterday I deliberately left half a sentence unsaid: “What I acknowledge is that the chart hasn’t shown it yet, not that it never will.” Today, that came in handy.

The chart only shows three things:
1) It bounced some way off the low, briefly reclaimed the previous level, but couldn’t hold it and fell back;
2) This rebound was short c
post-image
BTC-0.65%
  • 1
Just as the subscription feature is integrated into the wallet, allowing users to manage everything related to subscriptions directly from the wallet, the Pi wallet is simply your dashboard for managing all your assets, bringing everything together in one place
@PiCoreTeam #PiNetwork
post-image
PI-0.60%
  • 1
$PI Large screen at Shanghai Pudong Airport
PI-0.60%
  • 5
On the evening of November 22, Ether’s rebound has been strong, but around 1718–1724, it still needs to prove it can hold. Chasing here offers only average risk-reward.

I’m inclined to wait for a pullback: first watch 1693–1699 below; if that holds, there may be another chance to test around 1723. If it holds above 1725 on increased volume, then watch 1735–1748. Conversely, if it falls below 1690 and fails to reclaim it, watch for a pullback to the 1680–1687 area.

There’s no need to rush into a short-term directional bet. Wait for confirmation at key levels before entering, and keep position
post-image
ETH-1.23%
Bitcoin plunged from over $60k to $55,000, and ETH followed, falling below $1,500. How many of you rushed in hoping to “buy the dip and catch a rebound,” only to buy halfway down and get trapped even deeper with every add to your position?
Watching your account show unrealized losses keeps you up at night. You can’t bear to cut your losses, but you’re afraid to hold on in case it keeps falling. That kind of dilemma is grueling.
Getting unstuck isn’t about just waiting to break even. Follow the market’s rhythm and swing trade—sell high and buy back lower to capture the spread. Even in a broader
post-image
BTC-0.67%
ETH-1.26%
Can someone help him figure out why this is happening?
Amazon is spending $7.5 billion to acquire a small Israeli AI company that may have only a few dozen employees. That price is even more outrageous than the price tag I saw on organic eggs at the grocery store last time.

Don’t rush to call it a bubble. The consensus on Twitter is already clear: Big tech is panic-buying AI, and valuations are based entirely on imagination. That’s half right. But nobody’s talking about the other half: Decart makes software that lets developers switch seamlessly between different AI chips. Amazon makes its own chips, and its Trainium business has always lacked an
post-image
AMZN-3.90%
  • 16
  • 1
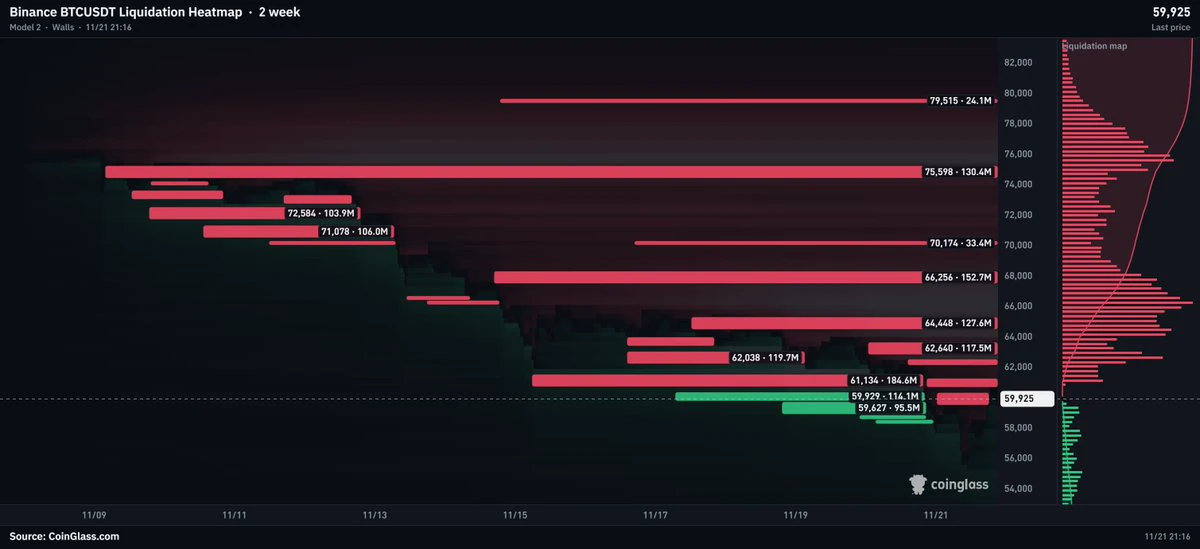
Another pleasant weekend is about to end. Just thinking about the market opening again tomorrow instantly takes away half the relaxation. Open this latest liquidation heatmap: before the market opens tomorrow, the big players’ playbook is already laid out in plain sight. Don’t charge in foolishly!

$BTC The current price is 59750, stuck awkwardly in the middle. Looking up, the green glow around 61000 is glaring—short positions are lined up there. But look further down: between 58500 and 59000, long positions are piled up as thick as a fortress wall. What does that mean? The big players have pl
BTC-0.65%
ETH-1.23%
SOL-0.74%
$NAS100 ‌
NAS100 Market Analysis: The Calm Before the Breakout

Current Price: 25,584.18
The NAS100 has experienced a sharp sell-off, dropping from highs near 27,755 down to a low of 24,898. Since hitting that bottom, price action has compressed significantly, forming a textbook pattern that traders need to watch closely.

Chart Analysis & Context

1. The 4-Hour Chart (Macro View)

Looking at the 4-hour timeframe, the index is currently in a consolidation phase following a strong bearish impulse.

· The Pattern: We are seeing a Symmetrical Triangle (or a pennant) formation. The price is squee
NAS100-4.60%
  • 1
  • 1
$13.5M EXPLOIT! WAGYU’S WRAPPED MONERO TOKEN $XMR 1 CRASHES 99.8%
Wagyu’s wrapped Monero token, $XMR1, collapsed from nearly $500 to around $1 after a wallet linked to its deployer sold millions of tokens.
WHAT HAPPENED?
According to Bitquery's on-chain investigation:
▪️ 5.2 million $XMR1 transferred to a newly funded wallet.
▪️ 363,804 tokens sold to 388 buyers.
▪️ Approximately $13.5M generated from sales.
▪️ $13.28M USDC withdrawn to Arbitrum.
▪️ Funds converted into 7,467 ETH.
HOW DID IT HAPPEN?
Wagyu's founder claims the token deployer private key was compromised through an old server host
XMR+0.00%
USDC+0.01%
ARB+1.17%
ETH-1.26%
MAX-3.22%
🔹 BNB Surpasses 540 USDT with a Narrowed 4.43 Decrease in 24 Hours
live-cover
LIVE1,157
SPCX-7.38%
TSLA-7.56%
NVDA-13.84%
Short $BCH at 198, next target at 193, invalidation at 201. 🔴 Short entry: 197.4–197.9 Take profit: 195.9 / 194.7 / 193.0 Stop loss: 200.5 Analysis: • Daily trend is downward, with price below the EMA200 at 301. • 1-hour RSI is 54; momentum is neutral and may weaken. Plan, not investment advice.
post-image
BCH+1.05%
$BTC longs have been flushed, while over $700M in liquidation liquidity is stacked between $61K and $66K.
The fuel is now above the current price. A short squeeze could drive the next major move higher.
post-image
BTC-0.65%
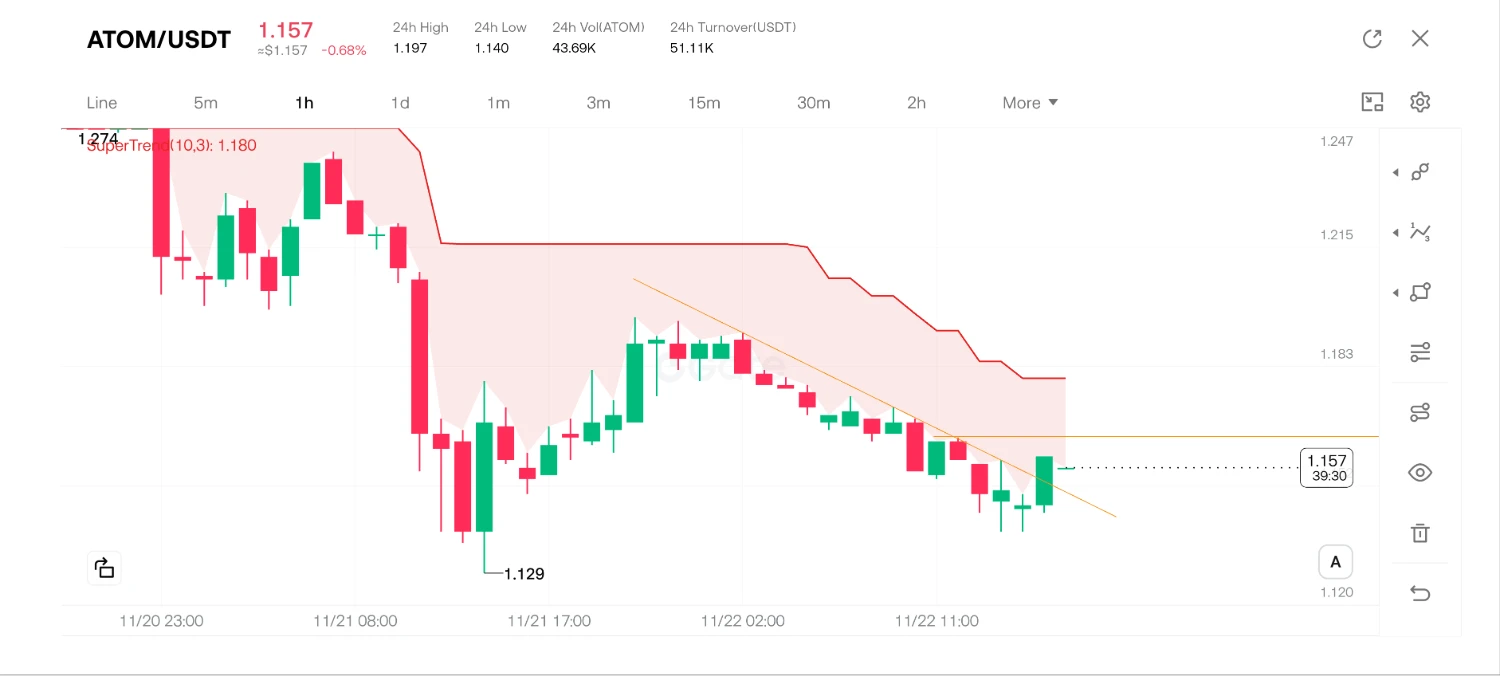
$ATOM ‌ will finish today's session above 1.1650.
post-image
ATOM+0.49%
2026-11-22 18:00
$BTC 61,082.70 (+3.28%)
4H range · 15m RSI 91 · Wait; RSI extremely overbought and flattening, don't chase
$ETH 1,715.99 (+3.03%)
4H range · 15m RSI 92 · Wait; RSI extremely overbought and flattening, don't chase
$SKHYNIX 781.65 (+2.11%)
4H bearish · 15m RSI 86 · Strong short; 4H bearish + 15m overbought rebound. Reference 781.49 for short
META 575.17 (+0.71%)
4H bearish · 15m RSI 85 · Strong short; 4H bearish + 15m overbought rebound. Reference 574.93 for short
#BTC #ETH #SKHYNIX
⚠ For reference only, not investment advice$ETH ‌
post-image
ETH-1.23%
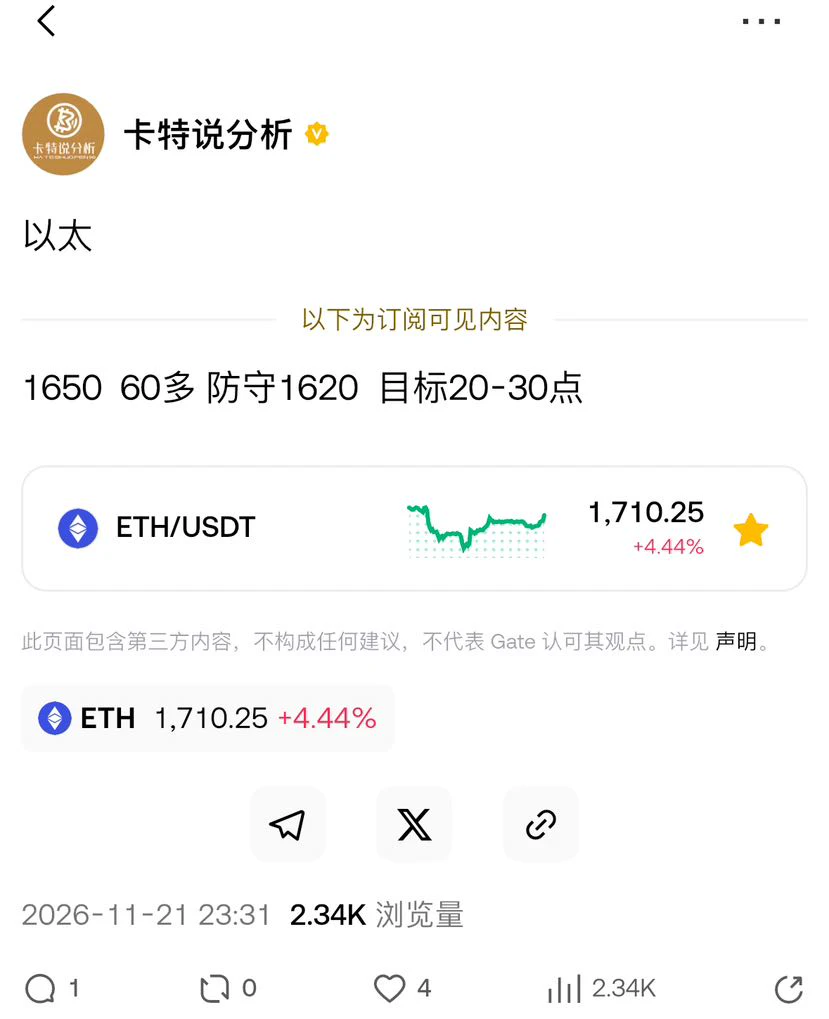
1650, up more than 60 and taking off
post-image
  • 3
🔥 GATE.IO ⚡ | CRYPTO MARKET ALERT | WHATS NEXT FOR BTC? 📊🚀
live-cover
LIVE1,959
BTC-0.67%
SOL-0.77%
ETH-1.26%
Load More

Join 40 M users in our growing community

⚡️ Join 40 M users in the crypto craze discussion

💬 Engage with your favorite top creators

👍 See what interests you

Trending Topics

BTCReboundFaces60KTest

2.1M Views30.1K Discussing

BTC rebounded from around $55,300 on November 21, briefly reclaiming $60,000 before pulling back to around $59,300. The $60K level is back in focus as traders assess whether the recovery can last. Is this rebound a sign of stabilization or a short-lived recovery? Would reclaiming and holding $60K be enough, or do you need confirmation from trading volume and fund flows?

PCEAndGDPDataNextWeek

259K Views2.6K Discussing

GateDirectIPOPhase3ANTAllocates92100Shares

829.2K Views5K Discussing

View More