Share your thoughts
placeholder
Article
IOST, an old public chain, saw a sweep.
There was no new mainnet upgrade today to account for this jump; it is a catch-up move among low-priced public chains.
$IOST
post-image
IOST+21.50%
Everyone’s watching Bitcoin, but LTC just armed a trap at 54.22—nobody’s talking about it.

$LTC /USDT - SHORT

Trade Plan:
Entry: 54.07 – 54.37
SL: 55.63
TP1: 53.17
TP2: 52.46
TP3: 51.41

Why this setup?
Why now? The 4h chart refuses to break higher despite the 1d range. RSI on the 15m (47) is dead neutral—no fuel for a pump. With ATR at 0.58, momentum is thin. My model says SHORT at 54.22 with TP1 at 53.17 and TP2 at 52.46. That’s a clean 3.2% drop before the daily range even flinches. The alt scenario is the fakeout—but confidence is only 55, so we respect the primary path until 55.63 br
LTC+2.23%
‼ The year's lowest four gt half-price offer ends tonight, with a 90% win rate and over 600 subscribers🎉making profits every day for nearly a month🀄️Today's futures/spot updates are live👇
https://www.gate.com/zh/profile/Little Ghost Daily Futures
🔥Recently made over $5.1 million in consecutive profits‼️Last week: 62700/1865+ 75600/2360 long-term long, 81500/2545 profits pocketed: $1.62 million📈Shandi 182 short at 1420, profits pocketed/ reversed to long at 1440, 1770 doubled the position, $800,000📈Friday morning: 81500/2530 short, 78600/2430 profits pocketed📉Evening: 78800/2435 wick lon
GT+4.80%
  • 10
Marscoin hits new all time high
live-cover
LIVE1,991
1, The US-Iran situation flared up again over the weekend, but since the US market is closed tomorrow for Labor Day, we can wait another day before getting anxious... A-share investors, you go first.
2, There are four things to pay particular attention to next week: energy risks, Apple's launch event, Oracle and Adobe's earnings reports, and Friday's CPI.
3, The pressure brought by Friday's nonfarm payrolls data led the market to reprice some of the rate-hike risk, but judging from Friday's close, there are still no signs of a full-blown risk-off move.
4, After the nonfarm payrolls report, the
post-image
AAPL-2.51%
ADBE-6.74%
ORCL+3.07%
Hold onto the whale
There will be surprises
Surprise
The whales will come
post-image
#美国8月非农超预期 #AIP
During this cycle, many people have noticed a phenomenon: although all kinds of concepts have emerged one after another—AI, DePIN, RWA, BTC L2—very few have actually enabled ordinary people to make money. The market is not short of narratives, hot topics, or capital; what it lacks is a project that puts everyone on the same starting line. Whenever a new concept emerges, retail investors are still studying the white paper while market makers have already begun selling off in batches. By the time the hot topic reaches the trending searches, it is basically at a stage high.
The
post-image
RWA+0.35%
BTC+0.25%
Why can’t I even believe it myself? This is unbelievable, isn’t it?
post-image
I didn’t do anything—just went to the bathroom, and when I came back, the K-line had already done the work for me.
With the whole screen glowing green, $CYS stubbornly bounced back to 0.7801. I stared at the chart for quite a while—the resistance above this price was simply too obvious, and trading volume was low. It was purely a bull trap and a setup to get wrecked. This kind of weak rebound is the most dangerous. I immediately placed a short order, with the stop-loss above the key level. While everyone else was running, I felt the opportunity had arrived.
After shaking back and forth for a
post-image
CYS+1.51%
XRP+0.95%
BNB+1.29%
#USELESSSurgesAnother67%
USELESS is once again catching attention after a sharp 67% surge, putting the token firmly on the radar of traders and crypto watchers. Moves like this can quickly change market sentiment and bring fresh interest to a project that may have been overlooked before.
The latest jump shows how quickly momentum can build in the digital asset market. When price activity accelerates, traders often start watching volume, liquidity, community interest, and overall market direction more closely.
What makes the move interesting is not only the size of the increase, but also the at
USELESS-10.50%
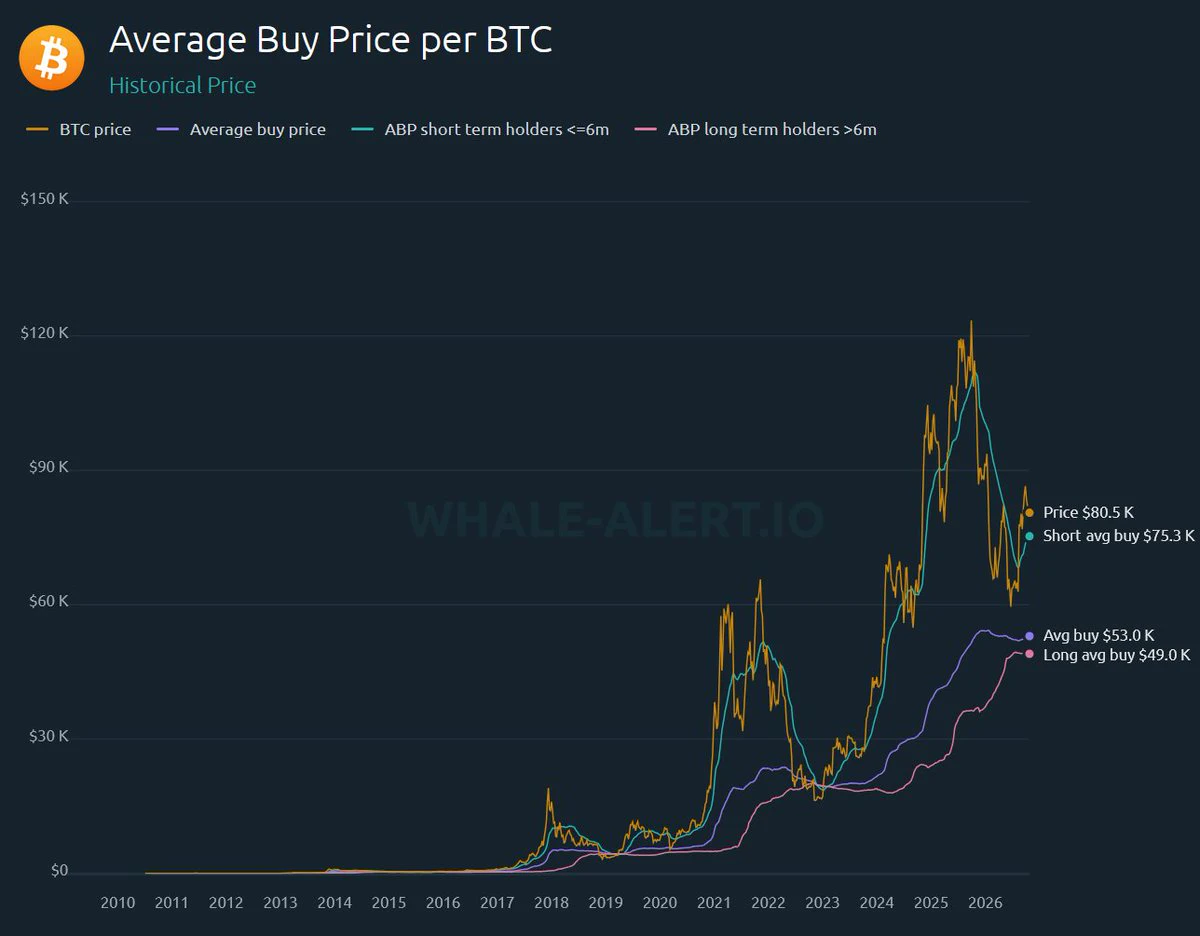
Do you feel that Bitcoin has recently become less like a tech stock and more like real gold? bitcoin:native
According to Bitwise's latest data, Bitcoin's 90-day correlation with gold has surged to +0.50, hitting a nearly six-year high, while its correlation with the Nasdaq has fallen to a low of 0.30 $XAUt
Many people's first reaction is that its digital-gold attributes have emerged, but I believe it is not Bitcoin that has changed—the logic of capital seeking safety has changed
In the past, institutions bought Bitcoin for its technological attributes and upside potential. Now, they allocate
BTC+0.25%
XAUT-0.03%
XAUUSD-0.95%
NAS100+0.06%
A few days ago, I was still calculating whether I had enough money for instant noodles this month; this morning, I was already wondering whether to add a sausage. $LIT has really delivered this time. When I opened the chart this morning, I knew something was off as soon as I saw the volume—funds were quietly entering, and every pullback was climbing along the moving average, a textbook pullback-and-hold structure. I went long as planned at 3.753 without waiting for some perfect entry—close enough was good enough. It’s now at 4.612, up +1103.05%; the guys on board should have woken up laughing,
post-image
LIT0.00%
ZEC+17.59%
ADA+3.05%
$BR Something is off with the data! The current price of 0.2511 is hovering right above the 24h low of 0.2500, down 19% from the high of 0.3105, while the 13.2M trading volume is dumping at this level—this isn't an ordinary pullback; someone is selling while sitting on the cost line.
Three possibilities: first, whales are shaking out the market and accumulating, using the terrifying -18% drop to scare off leveraged retail traders before buying back at lower levels; second, the project team is dumping unlocked tokens—the 13.2M trading volume shows that the selling pressure is real and fierce, a
BR-20.84%
₿ Why Timing Bitcoin Can Be So Difficult
Bitcoin’s history shows an interesting pattern: a large share of its yearly gains has often come from just a small number of trading days.
That creates a problem for market timers.
Missing only a few of Bitcoin’s strongest days can significantly reduce overall returns. Meanwhile, consistently identifying those days in advance is extremely difficult.
The takeaway isn’t that Bitcoin always goes up.
It’s that trying to perfectly time the market can be much harder than it looks. 👀
Historical performance is not a guarantee of future results.
#Gate60MillionU
post-image
BTC+0.28%
  • 6
  • 2
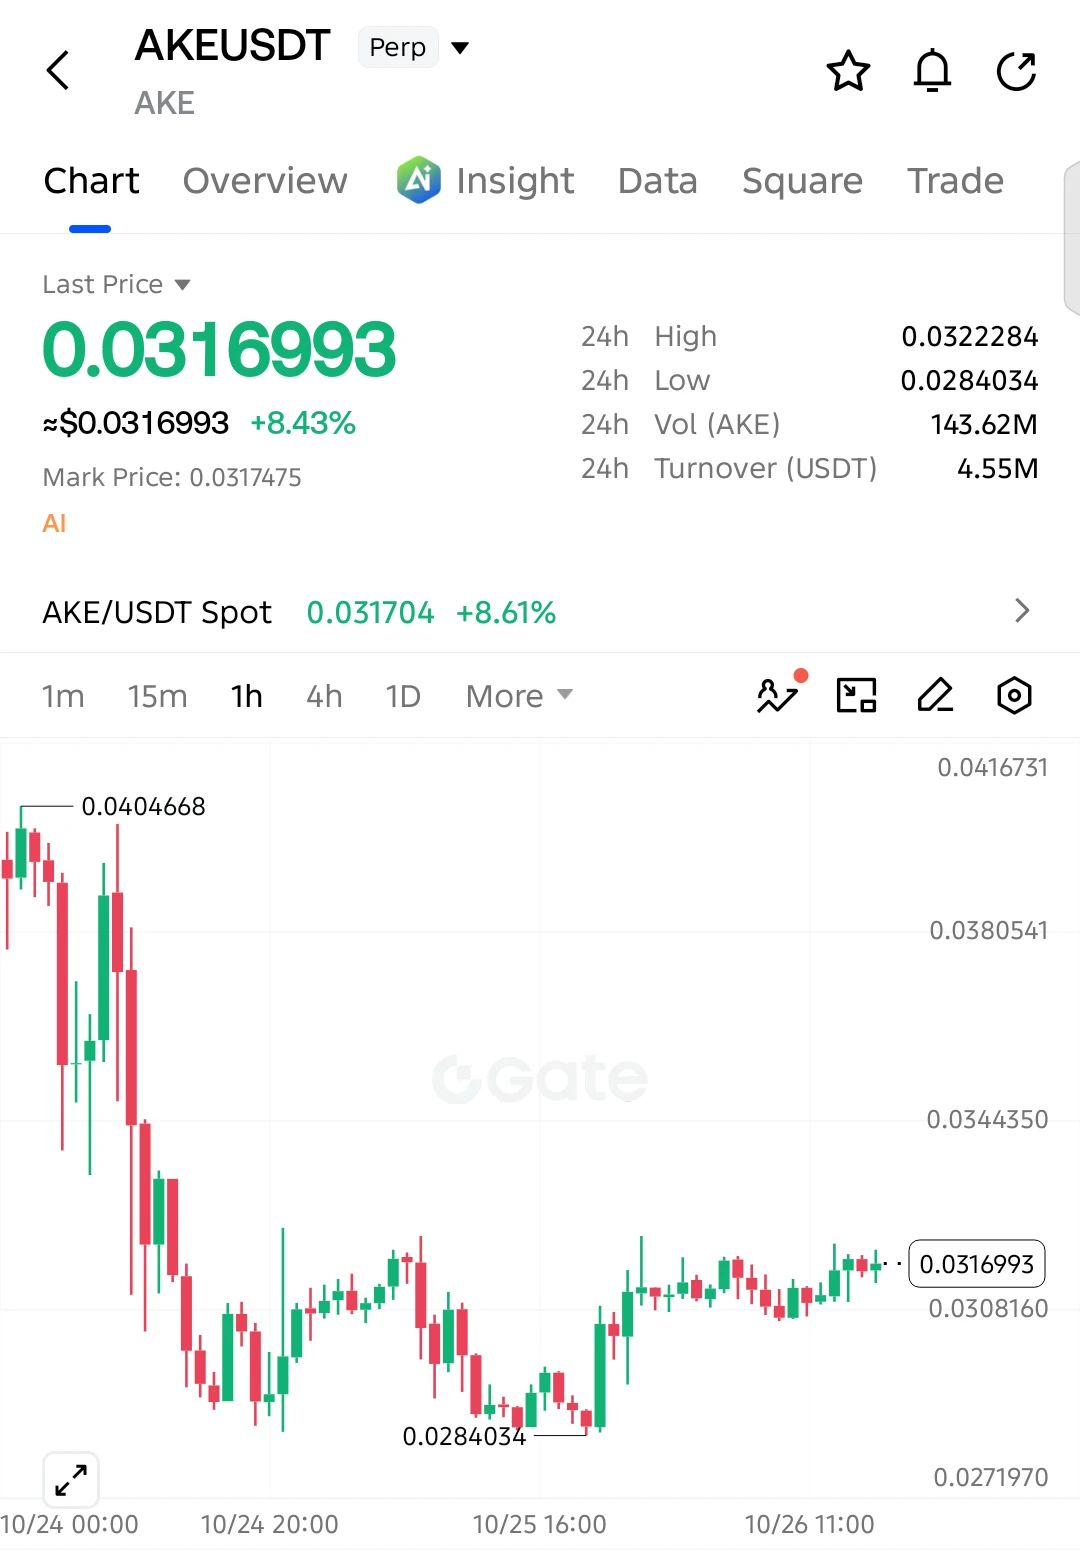
FLOCK was 0.054 yesterday and 0.078 today. The federated learning play is being hyped on its own without any new mainnet announcement; it was brought back into focus by funds after AKE cooled off. Its volume is thinner than ARB’s, and its volatility comes from the shallow order book.
$FLOCK
post-image
FLOCK+50.55%
Could buying a fleet of these cabs and operating them be a profitable business model? All you’d need is a garage and some maintenance. Thoughts?
post-image
Why is everyone still long SKYAI when the 4h chart is screaming the opposite?

$SKYAI /USDT - SHORT

Trade Plan:
Entry: 0.05904 – 0.05970
SL: 0.06254
TP1: 0.05699
TP2: 0.05541
TP3: 0.05303

Why this setup?
- 95% confidence on a SHORT setup while the daily trend is already bearish—this isn’t a guess, it’s a follow-through.
- RSI on the 15m sits at 39.4, meaning momentum is fading, not reversing.
- Entry zone at 0.05937 with TP1 at 0.05699 gives a clean 4% move before the real drop to 0.05541.
- The invalidation at 0.05863 is tight—if price reclaims that, the thesis dies fast. Why wait
post-image
SKYAI-0.51%
#HYPE突破88美元创新高 #AIP
This bull market looks lively on the surface, but is fragmented underneath.
The AI narrative burned hot for three months, then gave way to a new batch of projects; RWA was talked up for half a year, yet not a single one has been implemented; BTC L2s have sprung up like mushrooms after rain, but the ones that truly work are still on the way. Retail investors chased the hotspots in a circle, only to look back at their accounts and find almost nothing left. It is not that they did not work hard—the hotspots moved too fast for retail investors to keep up.
Why? Because all hot
post-image
HYPE+3.40%
RWA+0.35%
BTC+0.25%
MARKET ALERT - ASTER
4-Hour Chart (4H)
Technically, the price is in a strong uptrend. The candle is positioned above EMA20 (0,7546), EMA50 (0,7293), and EMA200 (0,6755). After touching a peak at 0,8675, a normal correction occurred.
Support: 0,7546 (EMA20) and 0,7321.
Resistance: 0,8133 and 0,8675.
1-Day Chart (1D)
The medium-term trend is shifting from consolidation toward a bullish breakout. The EMA arrangement is beginning to expand upward, with thick green candles indicating buyer dominance.
Support: 0,7022 (EMA20) and 0,6658 (EMA50).
Resistance: 0,8113 and 0,8675.
Trading Opportunities &
ASTER+3.11%
  • 4
  • 1
Oil Prices Stay Elevated While Traders Monitor Global Supply Conditions
live-cover
LIVE703
Load More

Join 40 M users in our growing community

⚡️ Join 40 M users in the crypto craze discussion

💬 Engage with your favorite top creators

👍 See what interests you

View More