Square
Following
Hot
News
Notifications
Profile
Share your thoughts
placeholder
Article
$XRP ‌
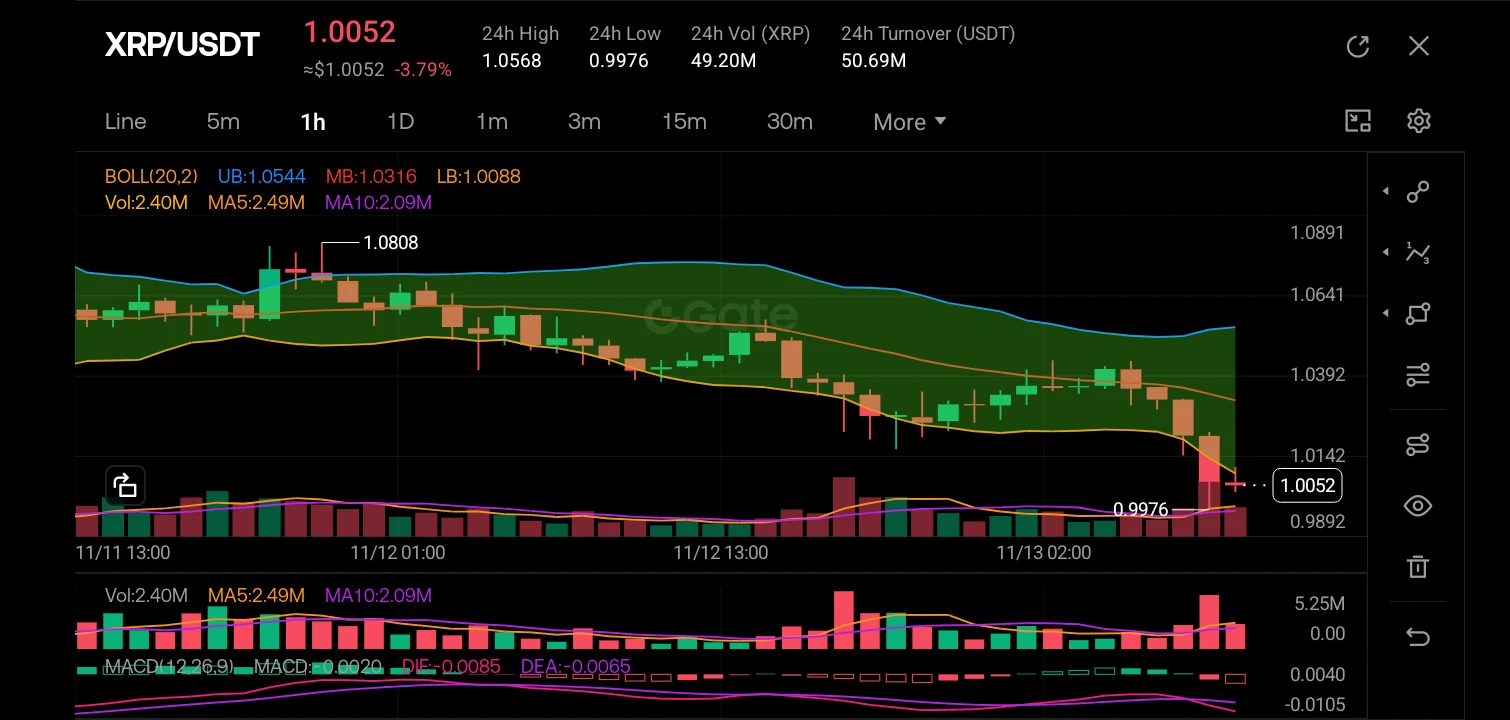
The market structure has clearly shifted bearish, transitioning from a consolidation phase near the 1.0641 level into a sharp breakdown. The K-line analysis shows a series of lower highs and lower lows, with the price currently piercing the lower Bollinger Band (LB: 1.0088) and trading significantly below the middle band (MB: 1.0316). The recent price action is dominated by strong red candles, indicating heavy selling pressure, while the MACD histogram is expanding downward and the signal lines (DIF and DEA) have crossed below the zero line, confirming strong bearish momentum.

The mos
post-image
XRP-1.15%
  • 2
  • 2
Spot prices are rising, but the derivatives market is weakening: What does this mean?

In crypto markets, a notable phenomenon sometimes occurs: spot prices continue to rise, while perpetual contract funding rates fall and open interest begins to decline.

Faced with this divergence, some believe the market is losing upward momentum, while others think leverage is being flushed out, making the market healthier.

So how should we interpret this? The key is to first understand what different market indicators reflect.

First, rising spot prices do not necessarily mean stronger demand for leverag
post-image
Trenches
mihao
m
bade
b
mihao
4Cxj...pump
Market Cap
$.
Change
.
24h Vol
$.
Holders
.
AGT
A
bade
b
AGT
0x5d...e274
Market Cap
$.
Change
.
24h Vol
$.
Holders
.
FOOD
F
bade
b
FOOD
FTu5...pump
Market Cap
$.
Change
.
24h Vol
$.
Holders
.
IDOL
I
bade
b
IDOL
0x3b...ab07
Market Cap
$.
Change
.
24h Vol
$.
Holders
.
AI
A
bade
b
AI
2T56...pump
Market Cap
$.
Change
.
24h Vol
$.
Holders
.
Now we finally know why Jensen Huang failed!
post-image
  • 2
BTC Market Analysis
Looking at BTC’s 1-hour order book, the overall structure is bearish, and the price has fallen to around $68,700. Spot CVD and futures CVD are both accelerating downward, dropping to -11.7K and -28.8K, respectively, indicating active selling pressure in both spot and futures markets. The good news is that the Funding Rate has fallen significantly compared with yesterday and the day before, but OI (open interest) continues to rise, indicating that new contract positions are outpacing closing positions as the price falls. With Futures CVD continuing to decline and the Funding
BTC-0.65%
As I said at noon, MSTR shorts dragged Bitcoin below 69,000 and 68,800.

The price is still hovering around 68,700, and support at 68,000 is weak, so don’t buy the dip just yet.

If it breaks, watch 66,975 (67,100)—both of these are only bottoms for today.

Below 67,000 is the major bottom. Spot buyers don’t need to chase the absolute low; you can add to your position for every 3,000-point drop.
post-image
MSTR-6.55%
BTC-0.67%
At this point in the gold market, retail traders are making more noise on social media than the market itself—some are calling for a “bullish pullback,” while others are afraid of “catching a falling knife.” What I pay attention to isn’t who’s shouting the loudest, but that moment when the price spikes through stops intraday and then snaps right back. A common example: liquidity is thin during the early Asian session, and gold suddenly plunges by dozens of dollars, just enough to break through the cluster of stop-losses near the previous low. Within minutes, buying pressure pulls it back into
post-image
GLDX-0.40%
PAXG+0.37%
XAU+0.38%
XAG+0.47%
  • 2
  • 3
Another day of Bitcoin tanking and Ethereum following back like a siamese twin. All these humiliation rituals in the name of crypto just because I refused to work 8-5?
post-image
BTC-0.67%
ETH-1.26%
#BTC
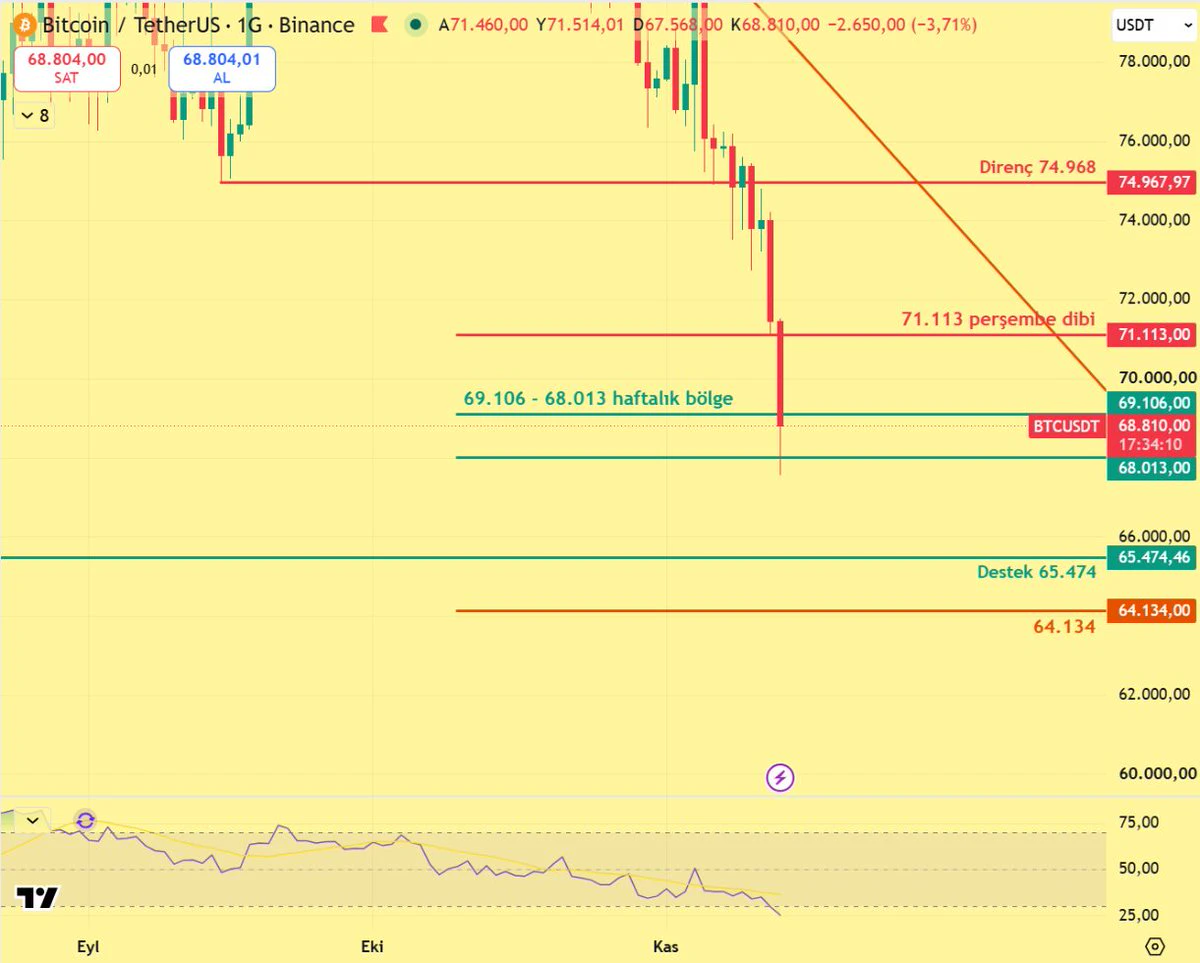
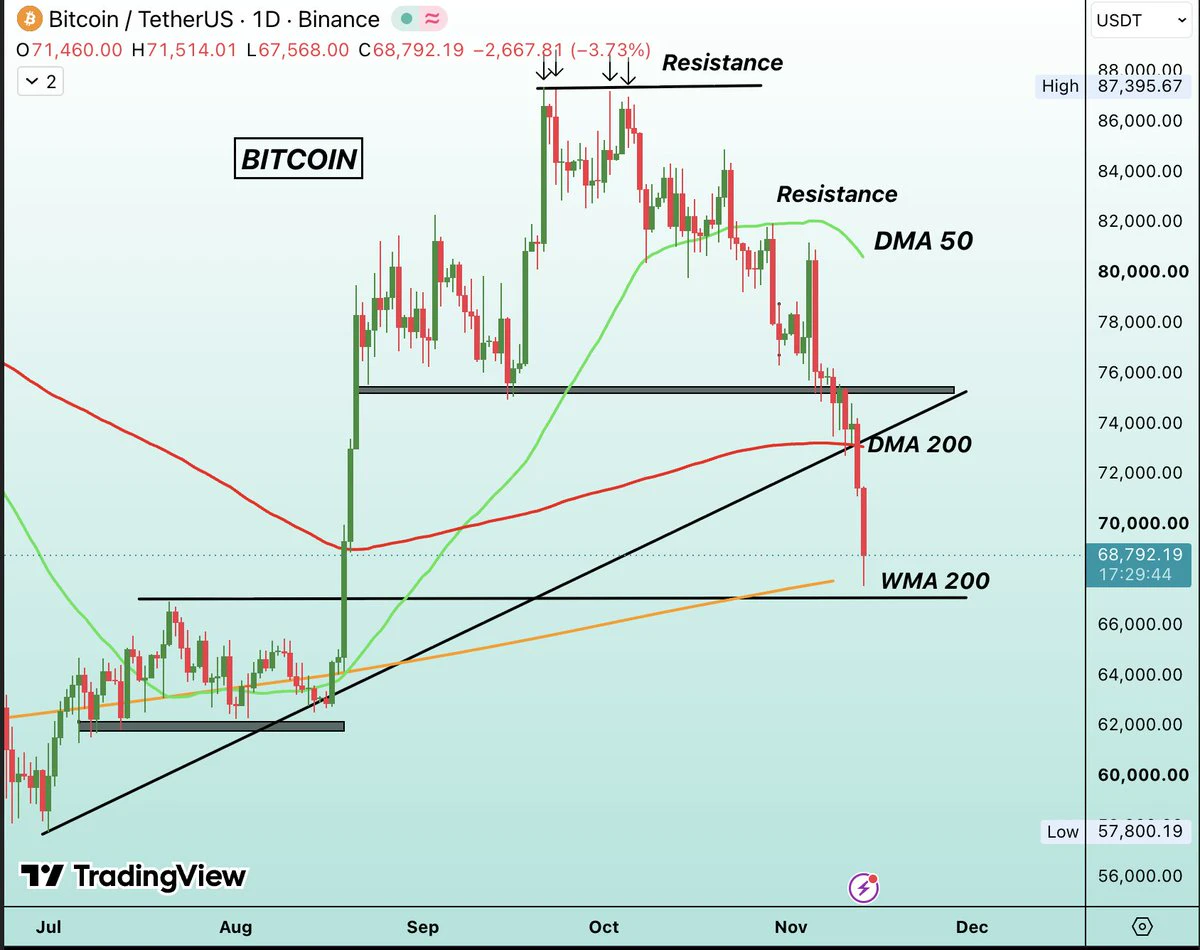
70,000 broken, price in the weekly support zone.
Friends, Bitcoin $BTC fell below 70,000 on Friday morning and dropped to 67,568. The decline is around 3.7% compared with Thursday's close. The daily RSI fell to 25.
On the weekly chart, the price is in the 69,106–68,013 zone I marked. This is where the 0.618 retracement of the June–September rally and the 200-week moving average are. The weekly close is what really matters. If the weekly close is above 68,013, the structure that began in June will remain intact.
If the daily close is below 67,568, the 65,474 level I marked on the chart wi
post-image
BTC-0.67%
Why Do Stop-Losses Keep Getting Swept? You May Be Overlooking Normal Market Volatility

Have you ever experienced this: You set a stop-loss, and the price quickly drops to trigger it. Then, after you exit, the market starts moving in the direction you originally expected.

After this happens a few times, some traders begin to wonder whether the market is deliberately targeting their stop-loss levels.

But the stop-loss logic itself may be more worth examining.

First, does the stop-loss distance match the level of volatility?

Price fluctuations vary greatly across different assets and timefra
post-image
#CandyDrop192ndWorldLiberty

𝗪𝗵𝗮𝘁 𝗺𝗮𝗸𝗲𝘀 𝗖𝗮𝗻𝗱𝘆𝗗𝗿𝗼𝗽’𝘀 𝟭𝟵𝟮𝗻𝗱 𝗰𝗮𝗺𝗽𝗮𝗶𝗴𝗻 𝘄𝗼𝗿𝘁𝗵 𝘆𝗼𝘂𝗿 𝗮𝘁𝘁𝗲𝗻𝘁𝗶𝗼𝗻, 𝗮𝗻𝗱 𝗵𝗼𝘄 𝗰𝗮𝗻 𝘆𝗼𝘂 𝗽𝗮𝗿𝘁𝗶𝗰𝗶𝗽𝗮𝘁𝗲 𝗶𝗻 𝘁𝗵𝗲 𝟵𝟬𝟲,𝟬𝟬𝟬-𝘂𝗻𝗶𝘁 𝗿𝗲𝘄𝗮𝗿𝗱 𝗽𝗼𝗼𝗹?

𝗖𝗔𝗡𝗗𝗬𝗗𝗥𝗢𝗣 𝟭𝟵𝟮𝗡𝗗: 𝗪𝗢𝗥𝗟𝗗 𝗟𝗜𝗕𝗘𝗥𝗧𝗬 𝗙𝗜𝗡𝗔𝗡𝗖𝗜𝗔𝗟 𝗕𝗥𝗜𝗡𝗚𝗦 𝗧𝗥𝗔𝗗𝗜𝗡𝗚 𝗔𝗡𝗗 𝗖𝗢𝗠𝗠𝗨𝗡𝗜𝗧𝗬 𝗥𝗘𝗪𝗔𝗥𝗗𝗦 𝗧𝗢𝗚𝗘𝗧𝗛𝗘𝗥

The 192nd CandyDrop campaign features World Liberty Financial (WLFI), giving users an opportunity to combine token trading with community participation. The campaign introduces a reward p
post-image
WLFI-0.16%
Bitcoin just retest WMA 200 at $68,000 after 85 days.
post-image
BTC-0.67%
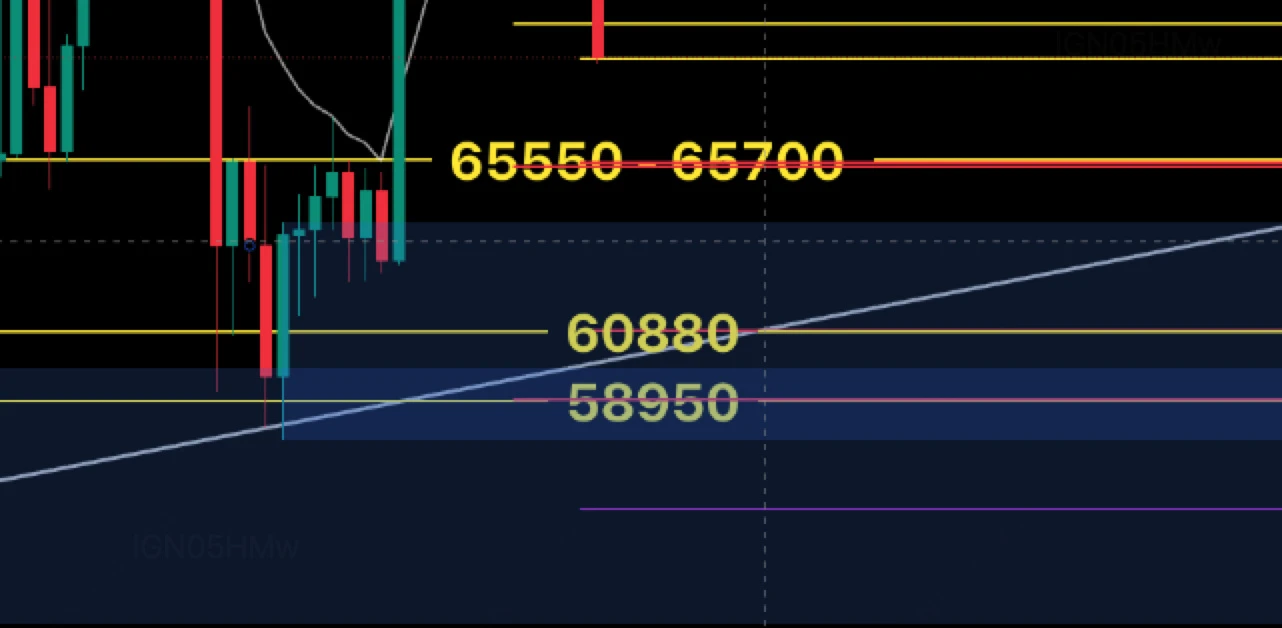
I'll share all the levels I can see below BTC ↓
post-image
BTC-0.67%
Morning Updates and Newses......
live-cover
LIVE2,433
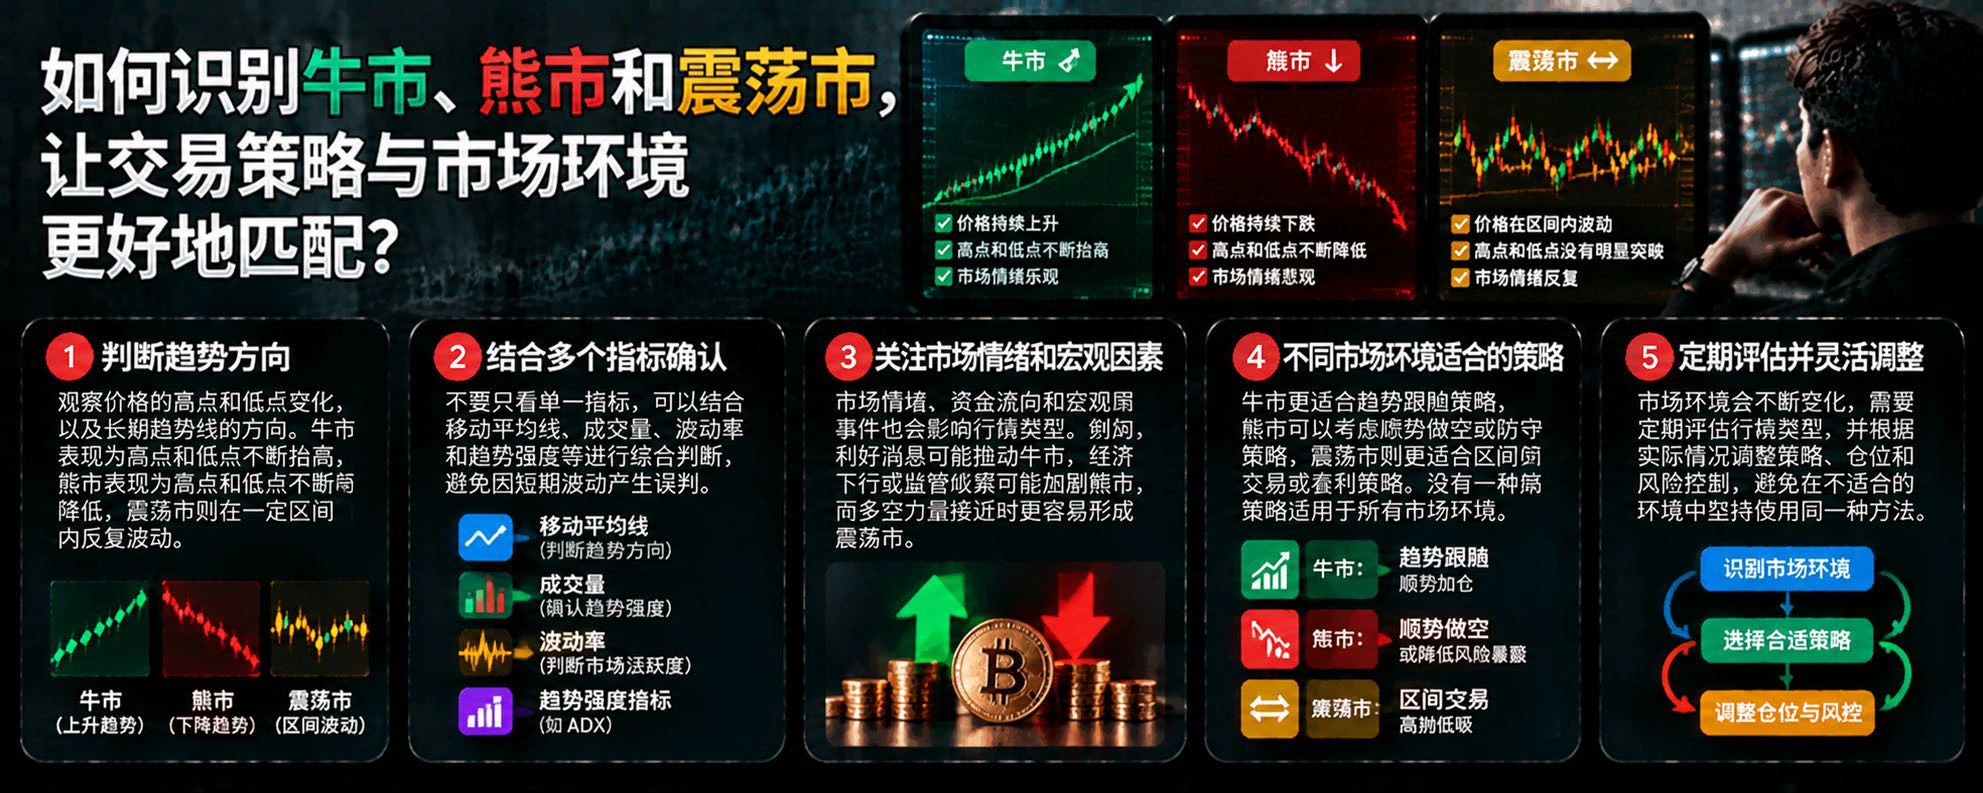
How can you identify bull, bear, and sideways markets so your trading strategy better matches market conditions?

The same trading strategy can produce very different results under different market conditions. A method that works in a trending market may trigger frequent stop-losses in a sideways market; a strategy suited to range trading may miss opportunities during a sustained rise or fall. Therefore, before trading, you need to assess not only price direction but also the market phase.

First, observe price structure. Bull markets typically feature progressively higher highs and lows, whil
post-image
Qiao Feng was born to the Khitan couple Xiao Yuanshan and his wife. As an infant, he was adopted by the Han Chinese couple Qiao Sanhuai and his wife, and as he grew up and went about his life, he saw himself as a member of the Song people's jianghu. He knew nothing of his origins, and for years led the Beggars' Guild in resisting the Liao, earning many merits.
But against the backdrop of the long-running Song-Liao wars, the Beggars' Guild was more than a jianghu organization; it was also seen as an important force resisting the Liao. The previous leader, Wang Jiantong, had long known he was Kh
post-image
#BTCDown4% #ShareWeekly
Bitcoin's $70,000 Battle: Breakdown, Recovery or a Bigger Market Reset?

Bitcoin is no longer simply approaching the $70,000 support zone. The market has tested and briefly traded below that psychological level, making the next daily and weekly closes extremely important. After struggling around $80,000 earlier in November, BTC fell toward $69,000–$70,000. The latest market snapshot showed BTC near $69,270, down approximately 6.10% over 24 hours and 8.55% over seven days. Its reported 24-hour range was roughly $68,900–$73,858. Market capitalization was around $1.40 tri
Go long $RUNE : Price is at 0.546, and buyers must defend this level. Hold 0.546 → 0.565, then look toward 0.576. A break below 0.530 → invalidates this trade setup. I want price to firmly hold this level and then break higher. If it falls below 0.530, I’ll step aside for now. - Price is attempting a rebound below the 4-hour EMA50 at 0.593, so stop-losses are important - The 1-hour RSI is 13, indicating a pullback rather than an overextended move - The daily chart is holding above the EMA200 at 0.535, so the daily trend supports the entry Entry: 0.5464–0.5486 (long) Targets: 0.5581 → 0.5652 →
post-image
RUNE-0.11%
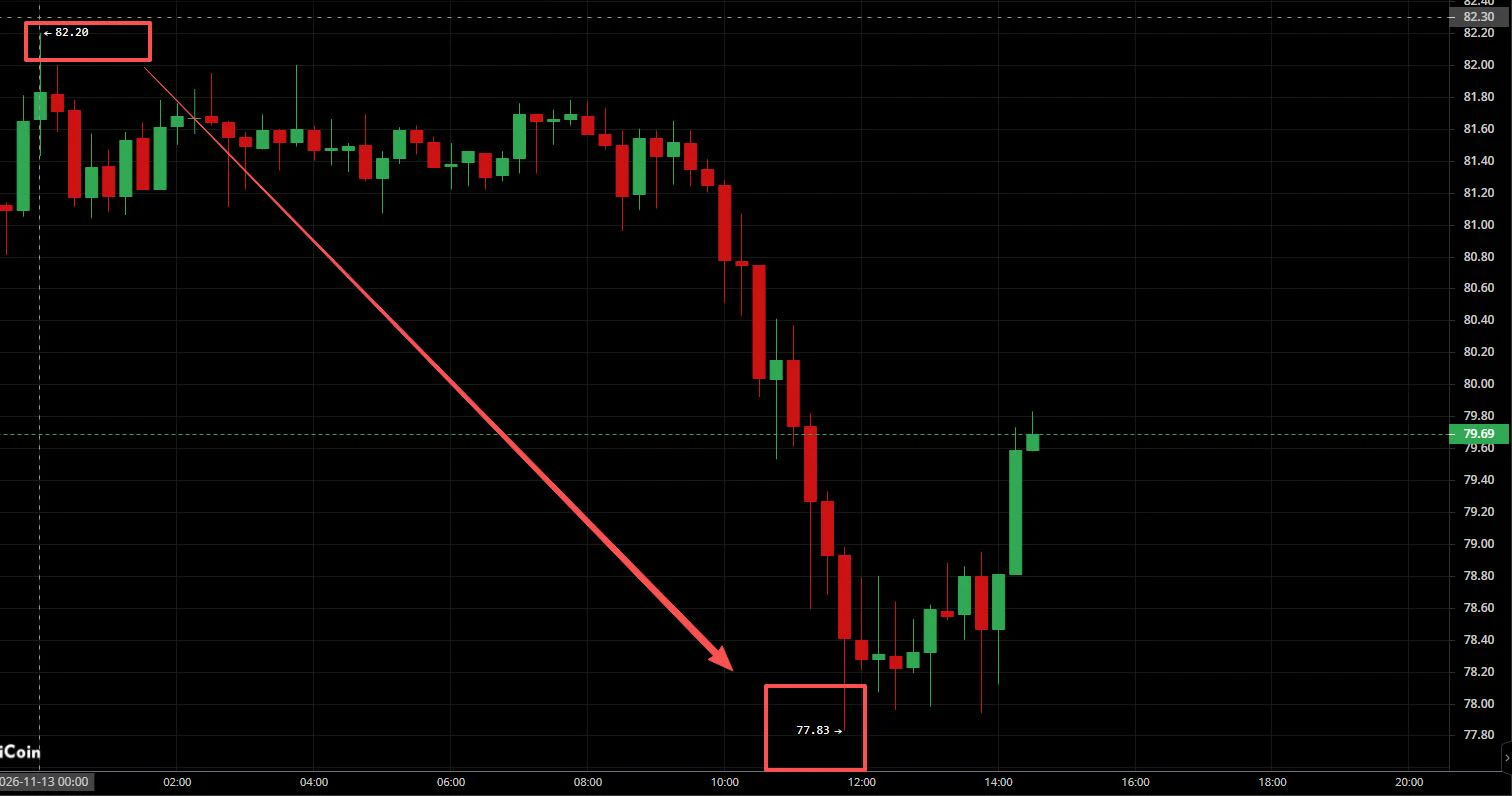
$SOL
Intraday, bears drove a high-volume selloff, pushing the price down from 82.20 to 77.83, with sellers clearly in control.
The market is currently in an oversold rebound phase, but rebound momentum is limited and the trend has not reversed. There is still room to fall after facing resistance.

Resistance: 79.8-80.2, 81.0
Support: 77.8-78.0
The strategy is to favor shorting rallies; avoid blindly buying the dip for now.#黄仁勋辞职 #BTC跌4%
post-image
SOL-0.77%
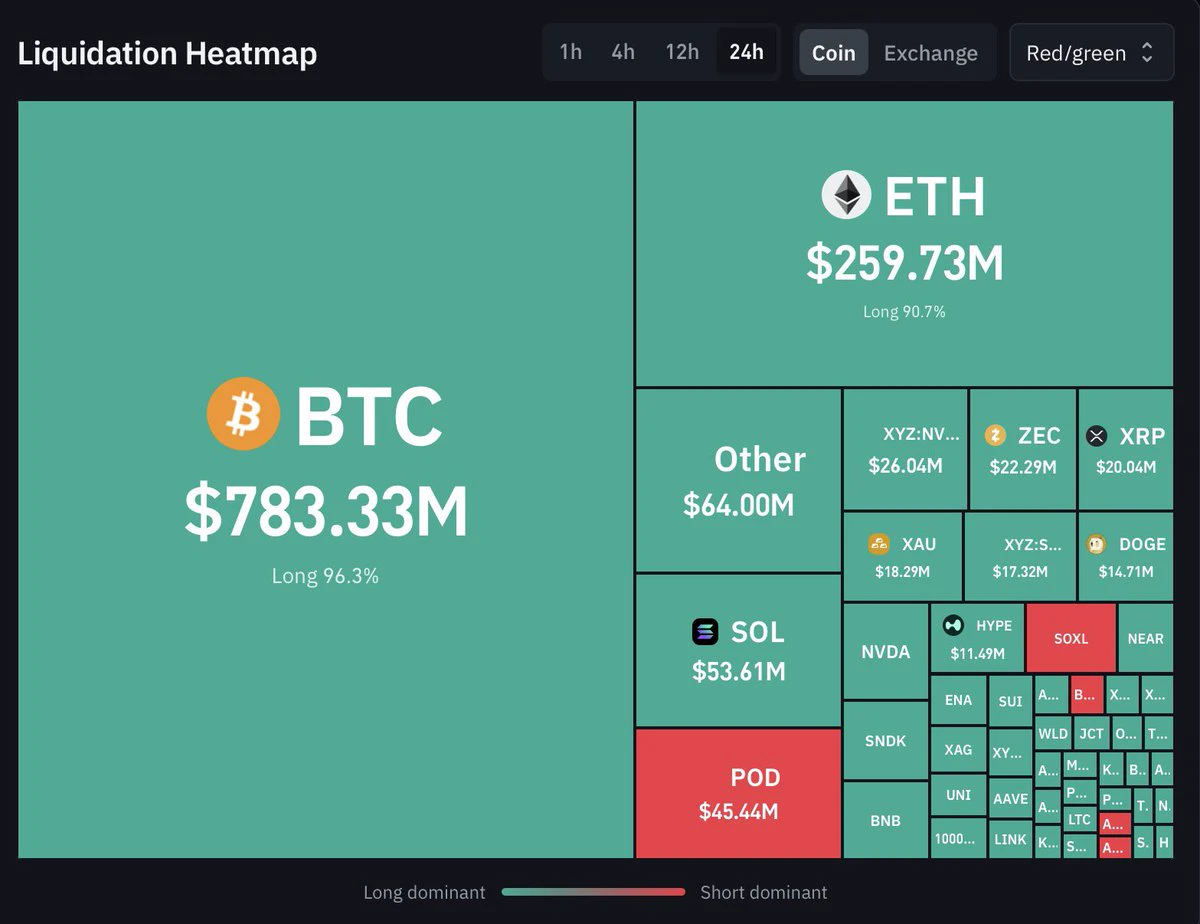
$1.47 Billion Wiped from the Crypto Market 🥹
Most of the long positions were worth $1.3 billion
post-image
  • 1
  • 3
🔹South Korean Chip Stocks Rebound Against the Trend! KOSPI Gains Over 2, While SK Hynix and Samsung
live-cover
LIVE3,602
Load More

Join 40 M users in our growing community

⚡️ Join 40 M users in the crypto craze discussion

💬 Engage with your favorite top creators

👍 See what interests you

Trending Topics

JensenHuangResigns

507.1K Views7.6K Discussing

Jensen Huang has resigned as NVIDIA CEO and stepped down from the board. CFO Colette Kress will serve as interim CEO while NVIDIA considers internal and external successors. $NVDA fell more than 10% in premarket trading following the announcement. With one of AI’s most influential leaders stepping aside, markets are now reassessing NVIDIA’s leadership stability, AI strategy, and long-term valuation.

GateIPOAccessAnthropic

275.1K Views2.6K Discussing

Dr.HanOxfordUnionSpeech

143.5K Views403 Discussing

View More