Square
Following
Hot
News
Profile
Share your thoughts
placeholder
Article
$NPC
There is no second best 🫡
20% bounce like nothing 🚀
@CryptoWizardd
post-image
NPC+8.51%
$OP
This move is pushing from 0.1397 toward 0.1418, up more than 13% over the past 7 days, while open interest is piling up as longs keep adding and driving it higher🚀 The wildest part is that shorts are effectively paying to stay in, having to hold on while funding remains negative. The pressure isn’t a bad thing—it’s an early-entry position. Break through 0.1418 and jump aboard.
post-image
OP-0.14%
Who is truly leading the gains in the same sector? The answer points to $INJ
.
A horizontal comparison makes it clear: $INJ rose 10.92% over 24h, with a trading volume of 24.0M USDT, while $JTO fell 3.94% and $DOGE barely moved (-0.28%) over the same period. All three have an MA5 crossing above MA20, but only $INJ ’s RSI surged to 71.2, with the MACD histogram expanding significantly to +0.136. Its price of 8.379 is already approaching the Bollinger upper band at 8.618, and its 30-candle amplitude of 17.89% shows far greater volatility elasticity than the other two. The funding rate of +0.0
post-image
INJ+10.36%
JTO-3.75%
DOGE-0.40%
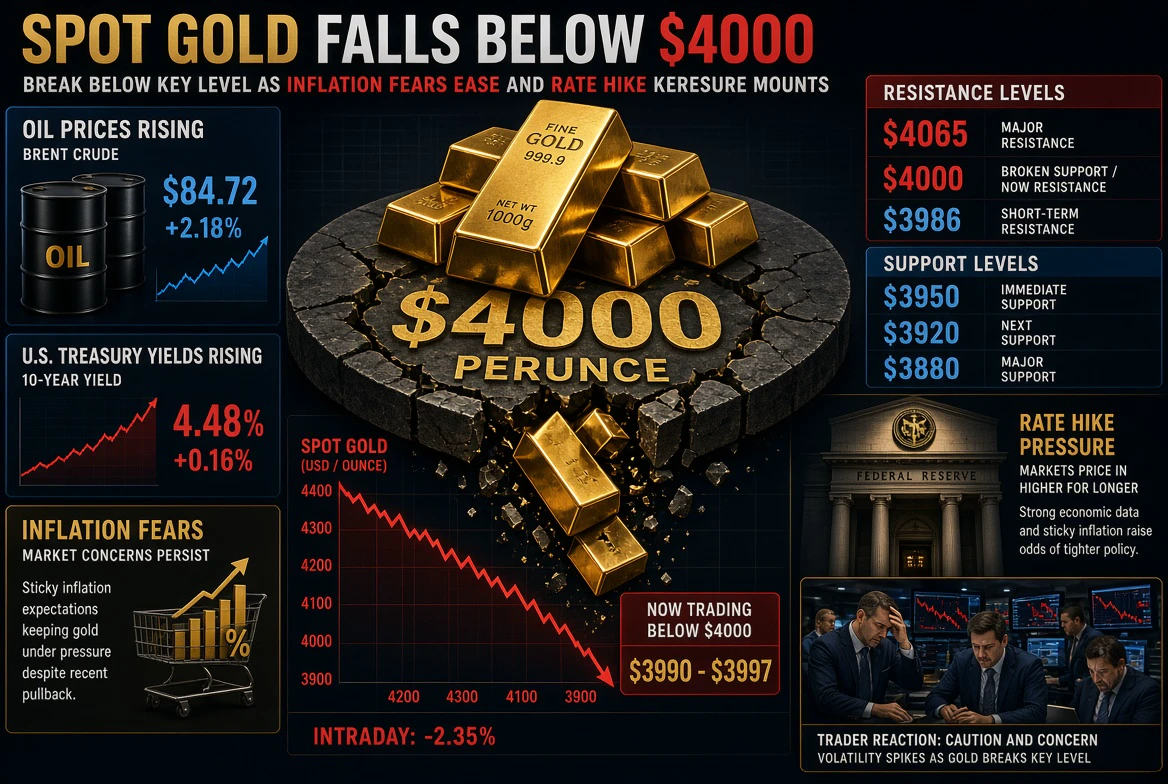
The more gold prices fall, the more aggressively China buys. From March to July, its purchases rose from 4.98 tons to 19.91 tons. This isn’t bottom-fishing; it’s welding a floor under gold prices. Ahead of the Fed decision, the market is already pricing in expectations. True liquidity providers only watch who is quietly absorbing the supply. Those holding gold should weigh this for themselves. If you have anything to add, see you in the comments.
post-image
GLDX+1.96%
PAXG+1.41%
$AVAX 🔺
B1 filled for the subs at $9.60 🎯
$10.07 already
we keep winning 🔔🚀
post-image
AVAX+0.35%
If I could leave only one note for $KORUB today, it would be: don’t let -8.42% make the decision for you.
What is really worth discussing is that $KORUB moved first on the 1-hour chart, while the 4-hour chart still hasn’t acknowledged it. $KORUB is currently at 11.96, down -8.42% over 24 hours. The 1-hour support is 10.07, resistance is 12.99, and current volume is 0.18 times the average volume of the past 20 candles.
The 1-hour trend is relatively strong, with RSI at 79; the 4-hour trend is relatively weak, with RSI at 36. This combination makes me temporarily accept the following interpreta
post-image
The Day i decided to learn how to trade the financial market was the Day my life changed forever....... I never knew what i was getting into was this big.
All i wanted then was to grow and earn $500 monthly and i am satisfied, i also said if could build one house then i am satisfied, well i Currently own over 8 houses, might get to 10 houses soon, still hungry for more, what i lacked the most as a kid was shelter, well all my future kids will become landlords as soon as they are born🤝
Those things i thought were impossible when i was still working as an house boy, i got them all and more (
#Bitcoin Golden Cross loading.
You know what this means...
post-image
BTC+0.31%
#晒出我的持仓收益#A group of friends huddling together for warmth—welcome, friend.
post-image
I make about $29k a month with options.
NO Day trading
NO Swing trading
NO Covered calls
NO Cash secured puts
NO BS
INSTEAD, I DO THIS:
Build base portfolio
Sell portfolio secured puts (not cash secured)
Buy LEAPS with the premium from sold puts
BUY shares with the premium from sold puts
Keep ratios in check
I can explain it to a 13 year old & I will likely outperform 95% of people that read this.
Simple wins.
post-image
$ZEC short fighting a fresh bullish reversal.
Pair: $ZEC /USDT
Direction: SHORT
Entry: 1135.67
TP1: 1090.48 +4.0%
TP2: 1060.36 +6.6%
SL: 1195.92
- Steady decline from ~1280 through all three MAs, into a sharp final push down, now a strong green reversal candle
- RSI snapped from ~20s to ~55-58 one of the sharpest recoveries of the week
- MACD still negative overall, but the last bar just flipped green fresh cross, same timing as CRCL/ZEC-last-week
$ZEC ‌
ZEC+8.93%
If you had put $10,000 into Richard Heart’s Hex token at the 2021 all time high you would only have $11 left and be down over -99.9%.
post-image
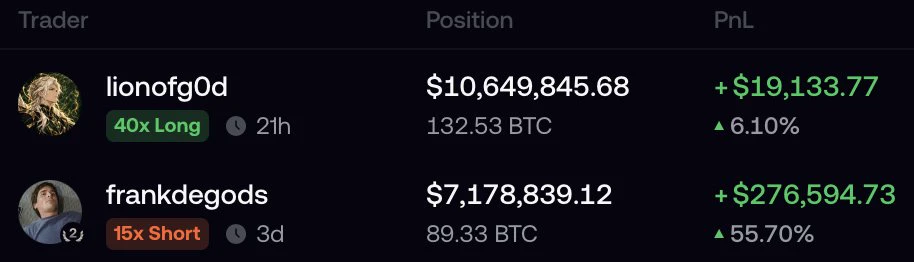
$BTC Don’t get baited into heavily chasing longs in this rally! The one-hour chart looks like a strong rebound, but it is actually just a corrective bounce after the sharp drop, not a trend reversal. Overhead trapped positions are weighing on the market, so any surge could pull back at any time.
ETH rebounded and rallied after hitting a low of 2314.27 one hour ago. The MA5 and MA10 turned upward, and the MACD formed a golden cross, indicating a corrective rebound after the sharp drop rather than a trend reversal. Overhead resistance from previous trapped positions remains.
Enter ETH long posit
BTC+0.31%
Bitcoin’s Long Term Cycle Chart Points to a Bigger Question: Are We in Another Accumulation Zone? 🙄
Bitcoin’s historical price cycles show a recurring pattern: major rallies, deep corrections, and long recovery periods.
The chart highlights previous peaks near $19,700 in 2017, $69,000 in 2021, and $126,000 in 2025, alongside earlier areas that some traders viewed as accumulation zones.
Now, the key question is whether the current price structure represents another opportunity to accumulate or whether the cycle is changing.
I think that the Historical patterns can offer useful context, but the
post-image
BTC+0.31%
Layout: Bitcoin, Ethereum, Dogecoin
live-cover
LIVE880
  • 4
While XRP has seen significant developments on the institutional front, its price has followed a more cautious trend. Despite approximately $1.8 billion in net inflows into XRP exchange-traded products (ETPs) over the past 13 weeks, the token’s price currently sits at $1.39—a decline of over 8% in the last week alone. This divergence raises a fundamental question that is now at the forefront of investors' minds.
The developments on the institutional side are noteworthy. Evernode—a company holding 473 million XRP and $300 million in cash—has begun trading on the Nasdaq under the ticker symbol X
post-image
XRP+0.94%
  • 8
  • 1
BTC UPDATE
live-cover
LIVE50
Does a bullish moving-average alignment always mean you should chase long positions?
Not necessarily. The key is whether the price’s position relative to the moving averages is synchronized with momentum. Take $ZEC as an example: the current price is 1235.97, with MA5=1225.24 above MA20=1138.62, forming a standard bullish alignment and indicating a healthy trend direction; however, RSI has reached 70.2, nearing overbought territory, while the price is hugging the Bollinger upper band at 1248.36, making the risk-reward of chasing short-term highs unattractive. A reusable approach is: use movin
post-image
ZEC+8.75%
XPL+7.58%
INJ+10.27%
🚨 LATEST: Stripe partners with Plasma to introduce multi-currency stablecoin cards, allowing users to spend in USD, EUR, BRL, MXN and COP.
The cards will support payments in local currencies without requiring users to first convert their funds into U.S. dollars.
Another major step toward global stablecoin adoption.
XPL+7.58%
Honestly, there is still support below overall, and it has been holding above 82000, but I still couldn’t hold on. I’ll take profits first and redeploy later. 😁
post-image
Load More

Join 40 M users in our growing community

⚡️ Join 40 M users in the crypto craze discussion

💬 Engage with your favorite top creators

👍 See what interests you

Trending Topics

USSeptemberPPIBeatsExpectations

91.35k Views1.88k Discussing

US September PPI came in at 6.3% YoY, well above the 5.3% market expectation, pointing to renewed producer-side inflation pressure. Weekly jobless claims were 199K, broadly in line with forecasts. Could hotter inflation further reduce room for rate cuts, and what does it mean for $BTC, US stocks, and gold?

DrLinHanSpeaksAtOxfordUnion

135.63k Views1.86k Discussing

JapanAndKoreaStocksPlunge

47.27k Views1.76k Discussing

View More