Square
Following
Hot
News
Profile
Share your thoughts
placeholder
Article
might take profits soon
post-image
$SUI SUIUSDT 5X Long: Technical Analysis
Here we are going LONG on SUIUSDT with 5X. The entry price can be anything below $1.05; the entry range can also reach as high as $1.08-$1.10. This is a strong chart setup.
A bullish breakout turned red for two weeks; now it is the third week, which may be enough for a retrace. The retrace ending could lead to bullish continuation, and the chart signals agree. A new bullish wave is possible.
Price action
The market never moves in a single line; it fluctuates. Now we are seeing red as part of a retrace, followed by green. This green period may be followe
post-image
SUI+0.69%
Mantle's treasury holds $2,278,697,265 as of October 14. Beyond MNT, it includes $289,957,751 in ether, $241,777,567 in bitcoin and $111,168,809 in stablecoins.
@Mantle_Official
MNT+1.72%
BTC+0.84%
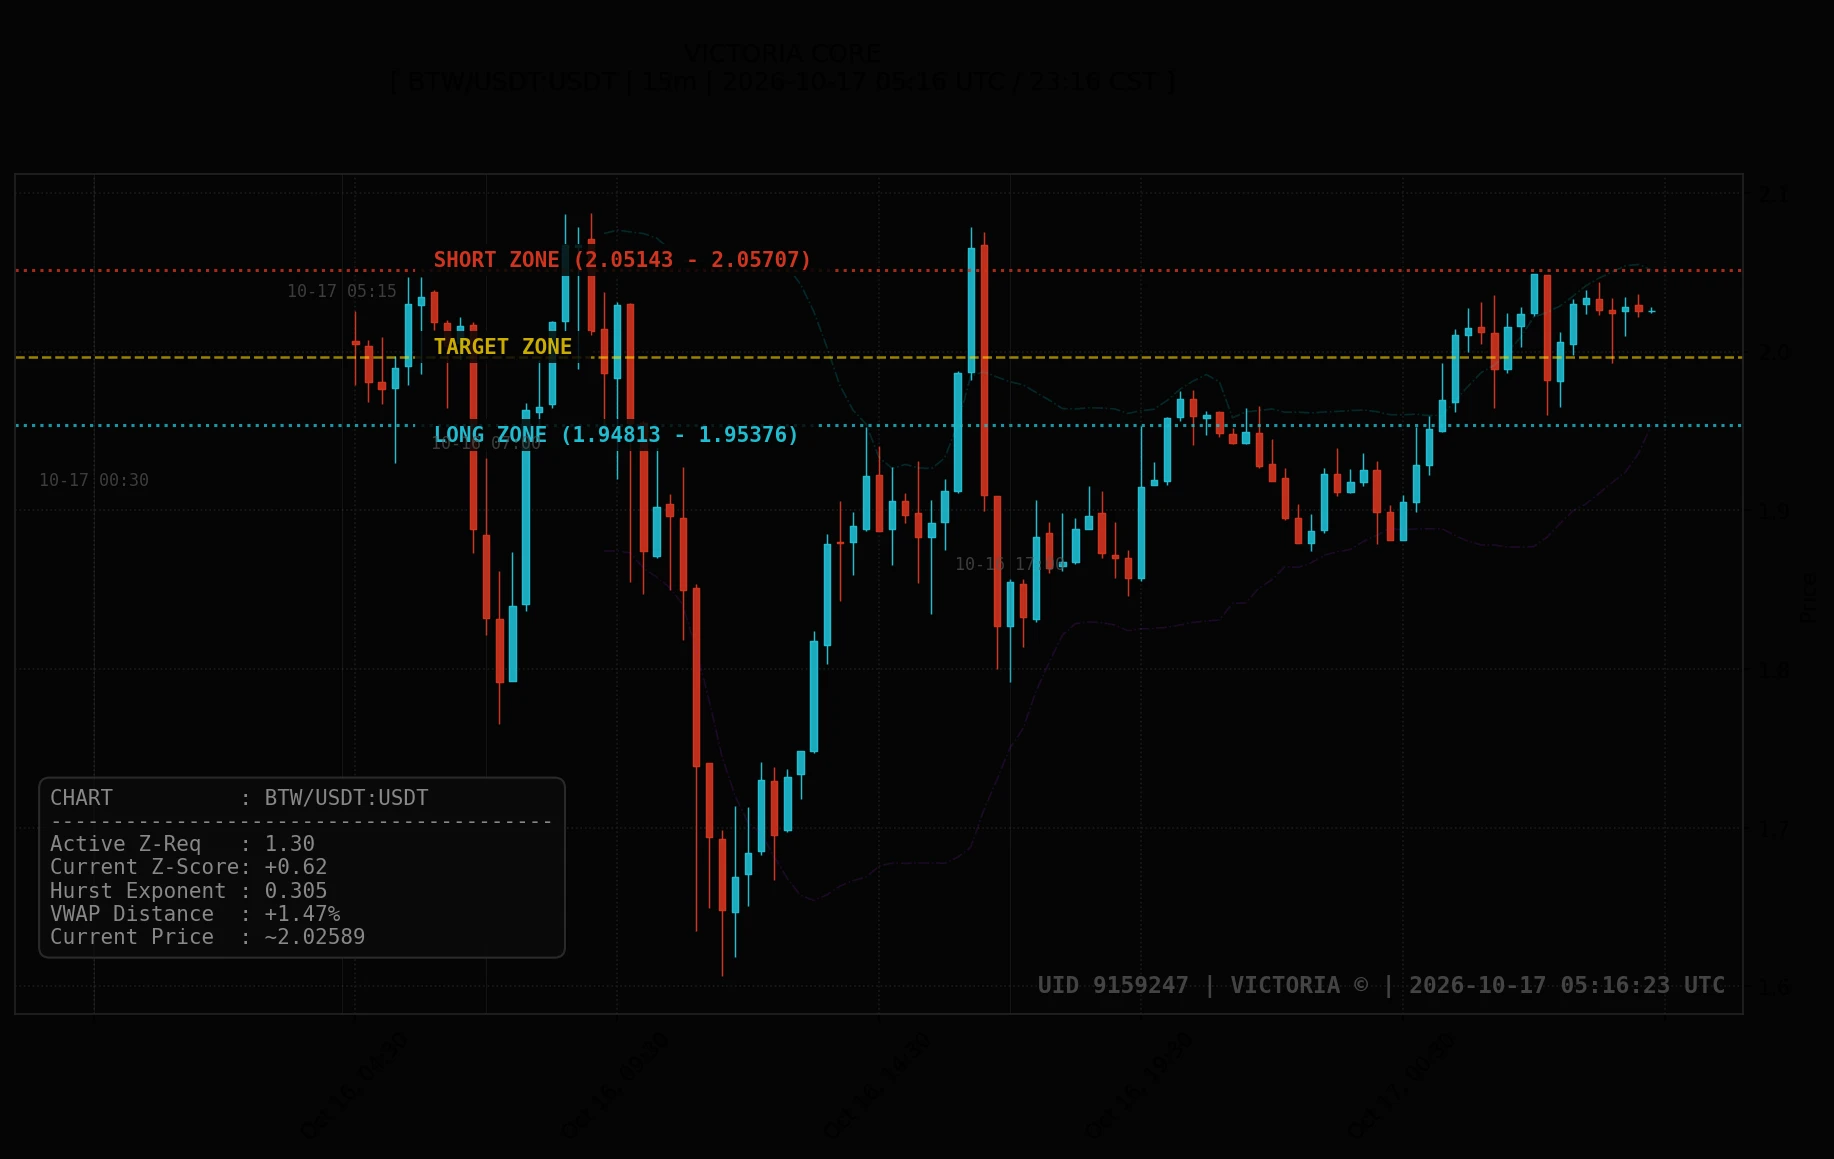
$BTW Long plan: 4-hour chart support at 1.908–1.925
Buyers must hold this area to maintain dominance. I will watch whether they can defend it here and avoid chasing the price. Why focus on this level: - The 4-hour price is 1.92, above the EMA50 at 1.81, favoring buyers - The stop-loss risk is 6.4%, while the potential TP3 gain is 10.3%, giving a favorable risk-reward ratio - BTC's short-term trend is bullish, providing support🟢 Long · Entry 1.908–1.925 · Take profit 1.990 / 2.039 / 2.113 · Stop loss 1.794
Not investment advice · Do your own research
post-image
BTW-21.04%
BTC+0.84%
$ADA About to rise after a slight pullback
Buy 0.2285–0.2255, targets 0.2310, 0.2335, 0.2360, stop loss 0.2210
post-image
ADA+0.05%
This woman is very wealthy, but she’s genuinely low-key.
I thought this was a couple with a huge size difference when I came across this post, but then I clicked into their profile and was shocked. What on earth are you two up to?
post-image
First, a word for the bullish side $AAVE , then one for the bearish side.
The bullish side needs to prove that someone is buying above 158.98; the bearish side needs to prove that nobody is catching it after 147.05 gives way. $AAVE is currently at 158.72, up 3.44% over 24 hours. The 1-hour support is 147.05, resistance is 158.98, and current volume is 0.23 times the average volume of nearly 20 candles.
Before either side has fully presented its evidence, I’m more focused on the fact that $AAVE’s price has already moved, while trading activity and volume have not kept up. We can temporarily bel
post-image
AAVE+2.29%
The most unusual detail in today’s market action is not on the gainers list, but in the volatility structure: $CRCLB rose 9.20% over 24h, while the 30-candle range has already reached 14.77%; the price is running along the Bollinger upper band at 89.77, RSI 68.5 is approaching the overbought zone, while the Fear & Greed Index is only 53 (neutral). This means the rise is driven by capital rather than overheated sentiment, but it also shows that once bullish momentum fades, the high volatility will amplify the downside—at this point, the risk-reward ratio of chasing longs is not attractive.
Tec
post-image
BNB-0.20%
$BERA Current price 0.2275, 24h -5.88%, trading volume only 5.6M USDT, MA5 at 0.23092 has crossed below MA20 at 0.23155, RSI at 46.6 is weak, the MACD histogram at -2.941e-05 remains bearish, and the Bollinger Bands are [0.214696, 0.248404], with the 30-candle amplitude at approximately 17.58%. The funding rate is -0.0001%, with bears slightly dominant but not at an extreme, and the Fear & Greed Index is neutral at 53—this is a typical low-volume, gradual decline structure rather than panic selling, meaning downside may open slowly instead of being released all at once.
Directional view: Beari
post-image
EPIC-19.18%
I checked @CoinMarketCap 's market movements, and $NEAR is among the tokens showing positive momentum.
What makes this project interesting to me is that it goes beyond token price. NEAR is building blockchain infrastructure focused on scalability, user-friendly applications, cross-chain transactions, and AI-powered systems.
The ecosystem is positioning itself at the intersection of Web3 and AI, two areas worth watching as blockchain adoption evolves.
But here is my take: a green candle alone is not enough to make me bullish on a token. I want to see sustained momentum, healthy trading volume,
post-image
One memecoin with 20B+ MC potential?
#Shill me.
post-image
MEME-0.75%
$INJ continues to rise strongly
Buy at 8.30–8.05; targets 8.56, 8.72, 8.90; stop-loss 7.85
post-image
INJ+10.59%
$QNT
A steady grind lower all the way, with longs liquidating longs—everyone trying to catch the falling knife got buried.😤 A rebound to 213.7 is the window to escape; if 201.8 breaks, it will head straight down. Don’t wait until the waterfall comes to run.
post-image
QNT-0.12%
#Solana大升级定档
#SolanaMajorUpgradeScheduled
SOLANA’S ALPENGLOW UPGRADE: A MAJOR TECHNICAL BREAKTHROUGH OR A CLASSIC “SELL THE NEWS” EVENT?
Solana is approaching an important milestone, with its Alpenglow consensus upgrade scheduled for October 21, 2026. The announcement has attracted attention across the crypto community because it promises to improve transaction finality and make the network more efficient. However, one important question remains: will this technological progress push SOL higher, or has the market already priced in most of the positive expectations?
In my view, Alpenglow repr
SOL+0.98%
BTC+0.84%
$ENA Right now it feels like a multiple-choice question with no standard answer, but the answer will not be hidden in emotions.
First, let’s copy the full question: $ENA is currently at 0.2051, up 4.32% over 24 hours. The 1-hour support is 0.1825, resistance is 0.2069, and current volume is 0.43 times the average volume of the past 20 candles. The 1-hour trend is strong, with RSI at 80; the 4-hour trend is strong, with RSI at 46.
The angle I’m watching is that $ENA remains strong, while the crowded positioning is already on the table. I acknowledge that the trend is strong, but what matters ne
post-image
ENA+3.28%
Many people see the funding rate turn positive and MACD turn green and automatically assume “the bulls are back,” then chase in with oversized positions—this is the most common position-sizing mistake: treating indicator direction as an entry signal while ignoring the moving-average structure and volatility levels. $BERA is a textbook example of this trap.
First, the structure: current price 0.2284, MA5=0.2311 remains below MA20=0.231595, and the short-term moving average has not crossed above, meaning the bearish alignment has yet to be repaired; RSI=47.3 is stuck in the neutral-to-weak zone
post-image
BERA-7.54%
vietnam’s built different 🧸
gn ct
post-image
CT+4.94%
( new streamer ) market overview
live-cover
LIVE1,261
Load More

Join 40 M users in our growing community

⚡️ Join 40 M users in the crypto craze discussion

💬 Engage with your favorite top creators

👍 See what interests you

Trending Topics

USSeptemberPPIBeatsExpectations

91.35k Views1.88k Discussing

US September PPI came in at 6.3% YoY, well above the 5.3% market expectation, pointing to renewed producer-side inflation pressure. Weekly jobless claims were 199K, broadly in line with forecasts. Could hotter inflation further reduce room for rate cuts, and what does it mean for $BTC, US stocks, and gold?

DrLinHanSpeaksAtOxfordUnion

135.63k Views1.86k Discussing

JapanAndKoreaStocksPlunge

47.27k Views1.76k Discussing

View More